


Interest Rate Swaps
AnalystPrep’s Actuarial Exams Preparation Materials For our question bank, study notes, quizzes, and all... Read More

After completing this chapter, the candidate will be able to:
- Define and recognize the components of interest rates, including real risk-free rate, inflation rate, default risk premium, liquidity premium, and maturity risk premium.
- Explain how the components of interest rates apply in various contexts, such as commercial loans, mortgages, credit cards, bonds, and government securities.
- Explain the roles of the Federal Reserve and the FOMC in carrying out fiscal policy and monetary policy and the tools used by the Federal Reserve and the FOMC, including targeting the Federal Funds rate, setting reserve requirements, and setting the discount rate.
- Explain the theories of why interest rates differ by the term, including liquidity preference (opportunity cost), expectations, preferred habitat, and market segmentation.
- Explain how interest rates differ from one country to another (e.g., U.S. vs. Canada).
- Identify the real interest and the nominal interest rate in the context of loans with and without inflation protection and calculate the effect of changes in inflation on loans with inflation protection.
From an economic angle, the interest rate can be defined as either reward for postponing the consumption (for example, saving money) or payment for consuming resources when they are unavailable (for example, buying goods using credit).
In a broad context, a person with money now can either to spend or save for the future (with an incentive to earn more).On the other side of the coin, a person without money can either borrow money to buy something or forfeit the purchase. The borrower has to pay interest to the lender. The choice to spend (or not to spend), save or borrow intuitively depends on each decision’s end result. For instance, a person might decide to borrow since the interest rates are low (hence the cost of borrowing is low) or save since saving interest rate is high (the reward for postponing consumption is high).
The interest rates in an economy are determined by the interaction of the demand and supply of the available funds. Households are the net supplier of loanable funds through savings, whereas corporations and governments are the net demanders of these funds, mostly through bonds.
This is shown graphically below.
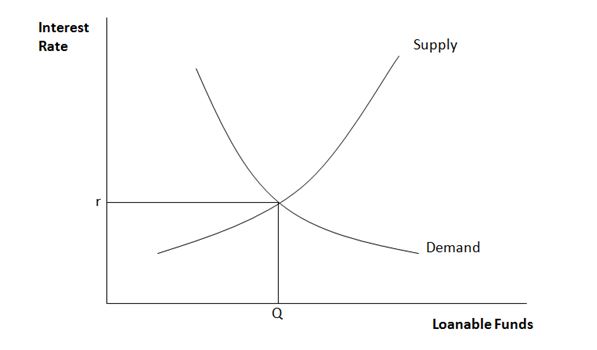
The supply curve represents the amount being saved in the economy. As the interest rate increases, people will want to save more as they will get higher interest earnings. These funds will then usually be available for borrowing by others.
The demand curve shows the total demand for borrowing, which will generally decrease as the interest rate rises. As the interest rate rises, the cost of borrowing becomes more expensive, and people are less likely to borrow.
At equilibrium, the total amount saved equals the total amount borrowed, this being the point where the two curves intersect.
It should be noted that the equilibrium price may shift position due to various factors such as the introduction of a new product into the market.
There are different ways of quoting interest rates. We shall consider three ways: Rates on U.S Treasury Bills, Rates on Government of Canada Treasury Bills, and Effective and Continuously Compounded Rates.
U.S Treasury bill is a short-term debt security issued by the U.S. government to meet short-term cashflows needs. In other words, US T-Bill is a loan to the government with a term of less than one year. Typically US T-Bill has a fixed maturity value.
U.S. T-bill is usually quoted using the formula:
$$ \text{Quoted rate} =\ \frac{360}{\text{Days to maturity}} \times \frac{\text{Dollar amount of interest}}{\text{Maturity value of the Treasury bill}} $$
Where Days to maturity is the remaining number of days until the bill is redeemed.
For example, consider a 180-day US T-Bill with a maturity value of 100,000 and priced at 97,500. The quoted rate at issue is given by:
$$ \frac{360}{180}\times\frac{100,000-97,500}{100,000}=0.05=5\% $$
The Canadian T-Bill is quoted using the following formula:
$$ \text{Quoted rate} = \frac{365}{\text{Days to maturity}} \times \frac{\text{Dollar amount of interest}}{\text{Current price of the Treasury bill}} $$
Where Days to maturity is the remaining number of days until the bill is redeemed.
Note that the quoted rate is calculated using the T-bill’s current price (unlike U.S. T-bill), and the days in a year are 365.
Using the same example, consider a 180-day Canadian T-Bill with a maturity value of 100,000 and priced at 97,500. The quoted rate at issue is given by:
$$ \text{Quoted rate} = \frac{365}{180}\ \times\ \frac{100,000-97,500}{97,500}=0.05199\approx5.20\% $$
In summary, there are two critical differences between the U.S and the Canadian quoted rate formula:
Due to these different bases, the normal convention is to convert interest rates to a common base resulting in either the effective interest rate or the continuously compounded rate/force of interest.
If an investor invests \(P_0\) at time 0 and receives \(P_t\) at time t, then:
\(P_t=\ P_0\bullet{(1+i)}^t\)
With i defined as the effective interest rate. When t is measured in years, i is referred to as effective per annum interest rate.
An alternative compound interest rate formula is given by:
\(P_t=\ P_0\bullet e^{rt}\)
with r defined as the continuously compounded rate/force of interest. Also, when t is measured in years, r is defined as continuously compounded per annum interest rate.
If the period, t, is measured in years, then the resulting rates are the per annum rates.
Further, the continuously compounded rates are additive, which allows them to be decomposed into additive sums. If we have an investment over n years earning a return of \(r_1, r_2 \cdots r_n\) then the accumulation of the investment after n years is given by:
$$ {P_n=P}_0\cdots e^{r_1}\cdots e^{r_2}\ \cdots\ e^{r_n}=\ P_0\bullet e^{r_1+\ r_2\ \cdots\ r_n} $$
By using continuously compounded rates, it implies that the equivalent annual continuously compounded interest rate is:
$$ r=\frac{r_1+r_2+\ldots+r_n}{n} $$
Note if \(i_1, i_2 \cdots i_n\) are the effective interest rates for respective years up to year n, then an investment of \(P_0\) accumulates to \(P_n\) at time n is given by:
$$ P_n=P_0\left(1+i_1\right)\left(1+i_2\right)\ldots(1+i_n) $$
So that the equivalent annual effective rate of interest is given by:
$$ i=\left[\left(1+i_1\right)\left(1+i_2\right)\ldots\left(1+i_n\right)\right]^\frac{1}{n}-1 $$
Recall that we defined interest rate as a reward for postponing consumption (saving) or payment for consuming resources when they are unavailable (debt). Also, the interest rate can be thought of as an equilibrium price of money. Thus, one of the determinants of interest rates is the demand and supply of money. Other determinants include:
With the component of interest rates in mind, let us now examine the interest rates in the following environments: Interest rates in the following worlds:
In an environment where there are inflation and default risks, it implies that the prices of goods and services remain constant over time, and the borrowed money is paid fully and on time, respectively. Intuitively, this is practically impossible.
In the world of no inflation and default risk, interest rates are typically expected to vary by term. The longer the loan term, the larger the amount of interest you pay. In other words, borrowers who wish to borrow money for a longer-term will pay the highest interest.
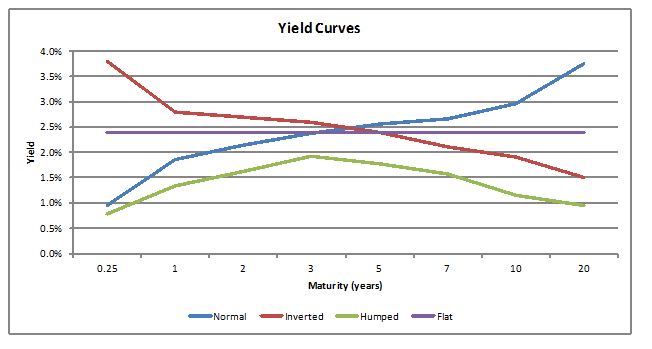
The term structure of interest rates is the relationship between interest rates (or yields) and different terms. It shows the relationship among interest rates over different maturities using a curve, often referred to as the yield curve. In a world of no inflation and default risk, the yield curve can take one of a variety of shapes, which are often used to infer how the economy is expected to perform. The most common of which are discussed below:
In this case, the economy is expected to grow at a normal rate with no significant inflation and credit quality changes. As such, people investing for longer terms will demand higher yields as longer maturities are riskier.
In this case, the economy is expected to go on a slump with a subsequent fall in interest rates. Borrowers will generally prefer to borrow long term as the interest rates are expected to fall.
This curve is generally associated with a lull period in the economy just before a recession or a boom.
This is the assumption used in traditional mortgage and annuity mathematics to help simplify calculations.
The types of yield curves are summarized in the figure below:
The following theories usually explain the shapes of the yield curves discussed above:
This theory postulates that the forward rates derived from long rates exclusively represent the expected future rates.
The entire term structure reflects the market’s expectations of future short-term rates. Therefore, a normal curve indicates that short-term rates will rise in the near future, a flat term structure indicates constant rates, and a falling structure indicates declining rates.
For instance, an investor who invests in a 2-year bond versus one who invests in a 1-year bond then reinvests this in another 1-year bond at the end of the first year would both be exactly in the same position at the end of year 2 based on this theory.
One main drawback with this theory is that future short rates often differ from what is calculated. It also ignores the fact that longer maturities will generally be considered riskier than shorter maturities.
According to this theory, investors are inclined to invest in short-term maturities over long-term maturities as the latter are riskier due to the longer commitment. They will thus hold longer-term maturities only if they are offered a forward rate that reflects both interest rate expectations and a liquidity (or risk) premium.
A consequence of this theory is that long-term rates will be made up of current and future short rates, together with a liquidity risk premium. This premium incentivizes investors to hold long-term bonds.
This theory states that the yield curve’s shape is affected by the demand and supply of specific maturity sectors. The interest rates for each maturity sector are thus determined independently of each other.
It assumes neither investors nor borrowers are willing to shift maturity sectors to take advantage of forward rate or expectations opportunities. As such, higher supply/lower demand for bonds in a given maturity sector results in higher yields, whereas lower supply/higher demand leads to lower yields.
This theory emanates from the market segmentation theory.
It postulates that if there is a mismatch in demand and supply for funds in a given maturity sector, investors will shift to maturities showing the opposite imbalances. They will require a risk premium, reflecting the extent of aversion to price or reinvestment risk.
Investors are thus willing to move out of their preferred maturity sectors but only if they are rewarded for taking on more risk.
The shape of the yield curve, under this theory, is determined by both expectations of future interest rates and the risk premium that will persuade such investors to shift out of their preferred habitat.
If the current 1-year Treasury security yields 6% and based on the expectations theory, the 1-year yield for equivalent securities in a year will be 6.25%.
Estimate the current yield on 2-year Treasury securities.
Based on the expectations theory, we know that the following equation holds with x being the current yield on 2-year Treasury securities.
$$ 1.0625=\ \frac{{(1+x)}^2}{1.06} $$
Hence
$$ x=\left(1.0625\bullet 1.06\right)^{\frac {1}{2}}-1=0.06125\ i.e.\ 6.125\% $$
In a world with no risk, the interest rate that would be charged is the risk-free interest rate as the possibility of financial loss is non-existent. However, the financial loss is a normal occurrence, and financial institutions usually adjust the interest rate to cater for the possibility of this occurring in a given cohort of business. An example best explains the need for this adjustment due to financial loss occasioned by some borrowers defaulting.
Suppose there are only two types of borrowers – those who always repay in full and on time and those who are possible to default.
If we lend to 5000 borrowers an amount of 1000 for a term of 5 years and suppose that it is known in advance that 50 borrowers will default in full. If \(x\) is the contractual repayment at the end of year five (assuming that the loan is repaid as lump sum), then the total amount received by the lender will be:
$$ 4950 \cdot x+50\cdot 0=4950 \cdot x $$
Suppose that if without default, the lender would have received 1,250 (equivalent to 4.56% effective per annum or 4.46% continuous per annum) from each non-defaulting borrower so that at the end of five years, he received a total of
$$ 5000\times 1.250=6250000 $$
Now, for the lender to
$$ 4950\cdot x\ \geq 6250000\ i.e.x\ \geq1\ 262.63 $$
In a world with default, the repayment must be at least 1,263, which corresponds to an effective per annum interest rate of 4.77% or a continuous per annum rate of 4.66%.
If instead of full default, the lender can recover 25% of the repayable amount (from the defaulting borrowers), then the lender expecting repayment of x at the end of five years will receive
$$ 4950\cdot x+50\cdot 0.25\cdot x=4962.5\cdot x $$
Hence, we have
$$ 4962.5\cdot x\ \geq 6250000\ i.e.x\ \geq1\ 259.45 $$
In a world with default but partial recovery, the repayment must be at least 1,259.45, which corresponds to an effective per annum interest rate of 4.72% or a continuous per annum rate of 4.61%.
The interest rate charged in a world with default will thus be higher than that in a world without default, and a premium, s, is usually added to the risk-free rate to cater for this. If interest rates are expressed in continuous per annum form, we have
$$ R= r+ s $$
where s represents the compensation for default risk and is referred to as the credit spread or default risk premium. R is, therefore, the rate on loan with possible default.
On the other hand, if the interest rate is quoted using effective annual rates, then the rate on the defaulting rate is given by:
$$ R=\left(1+r\right)\left(1+s\right)-1 $$
Where R, s and are as defined above. Note that:
$$ \begin{align*} R & =\left(1+r\right)\left(1+s\right)-1\\ & =r+s+r.s \end{align*} $$
Now, r.s is relatively small; thus, we can approximate R as
$$ R\approx r+s $$
Note that this is just an approximation, and it is not true.
Inflation is the general tendency of prices to increase over time generally. Inflation is measured by keeping track of the prices of a basket of goods and services. Usually, price index and consumer price index are used to measure inflation. The inflation is typically stated as a compounded annual rate and sometimes a continuous rate of return.
The increase in prices of goods and services decreases the purchasing power of money. That is, more money is needed to purchase fewer goods (this was illustrated in the last chapter)
Moreover, inflation affects the incentive and ability to borrow money at a given rate. In the presence of inflation rates, the income of a borrower (for example, wages) will increase, and thus the borrower will pay a more significant amount to service a loan than when there is no inflation.
For instance, consider an investor who takes a two-year loan of 10,000, which is supposed to be paid as a lump sum at the end of two years at an annual effective interest of 3%. Now, assuming that there is no inflation, the investor will pay 1,060.90 \((=1000\left(1.03\right)^2)\), and hence the investor will pay interest of 60.90 (=1,060.90-1,000). Now assume that there is 2% inflation per year. Then the investor will have to repay 1,103.76 \((=1000\left(1.03\right)^2\left(1.02\right)^2)\). Note this is equivalent to per annum effective interest rate of 5.06%. Evidently, in this case, the borrower will pay an interest of 103.76 (=1,103.76-1,000).
The example above clearly shows that, in the presence of inflation, lenders demand borrowers to pay more interest rates to gather for the loss of the purchasing power during the loan term. On the other hand, the borrowers will be able to pay the interest because their income will also increase in the presence of inflation.
Generally, consider an investor willing to lend \(P_0\) for t years and that the interest on the loan is paid at the end of the loan term. If there is no inflation (and uncertainty of loan repayment is considered), then repayment of the loan is given by:
$$ P_t=P_0e^{Rt} $$
Where R=r+s and variables are defined as before.
Now, assume that there is an inflation of i expressed as an annual continuous rate. Now since inflation affects both the wages and prices, the borrower, in this case, is willing to pay:
$$ \begin{align*} P_t&=P_0e^{Rt}.e^{it}\\ &=P_0e^{\left(R+i\right)t}\\ &=P_0e^{R^\prime t} \end{align*} $$
It, therefore, follows that when interest rates are quoted as continuous per annum, then the interest rate in a world or certain inflation and default risk is given by:
$$ R^\prime=r+s+i $$
Where
r = compensation for deferred consumption
s = compensation for default risk
i = compensation for inflation rate
On the other hand, if interest rates are quoted as effective per annum, then intuitively,
$$ R^\prime=\left(1+r\right)\left(1+s\right)\left(1+i\right)-1 $$
Where the variables are defined as before.
The above analysis assumes that the inflation rate is known in advance, and though simplistic, it is an essential principle in analyzing the determinants of interest rates.
In reality, however, the inflation rate will not be known in advance, and investors deal with this uncertainty in a number of ways
In this case, a loan is set such that the amount of repayment by the borrower captures the actual inflation rate over the loan term as measured by a particular reference index such as the consumer price index. In other words, the loan contract, in this case, specifies the interest rate that will be paid, assuming that there is no inflation and a provision of an index to adjust the loan payments to incorporate inflation.
Therefore, the borrower’s repayment is calculated as loan repayment, assuming no inflation multiplied by the ratio of index observed at the beginning of the loan term to that observed at the end of the loan term. Simply put, the loan repayment is given by:
$$ \text{Repayment amount}_{\text{no inflation}}\times\frac{{\text{Index value}}_{\text{end}}}{\text{Index value}_{\text{beg}}} $$
2. Loans without Inflation Protection.
If an investor (lender) does not want to take the risk embedded in the uncertainty of inflation through the indices, the compensation is received in two ways:
In this case, if the interest is quoted as continuous per annum, then the rate on a loan without inflation protection and default risk is given by:
$$ R^{\prime}=\ R+i=\ R+i_e+\ i_u $$
where
\(i_e\) = compensation for expected inflation and
\(i_u\) = compensation for unexpected inflation
\(i_u\) will typically be non-negative but \(i_e\) can be in which case inflation is expected to be negative. If \(i_e\) < 0, the purchasing power of money increases over time.
3. Use of Real and Nominal Interest Rate
The real interest rate is a quoted rate on a loan where an adjustment for inflation has been incorporated. In other words, it is an interest rate with an inflation rate protection. On the other hand, the nominal interest rate is a quoted rate with no inflation.
If we assume there is no risk of default and the interest rates are quoted as per annum continuous, then the real interest rate, \(R_{real}\), is given by
$$ R_{real}=r-c $$
where
r = compensation for deferred compensation and
c = cost of inflation protection
The nominal risk-free rate assuming no risk of default (commonly referred to as treasury bill rate), \(R_{nominal}\), is given by
$$ R_{nominal}=r+i_e+ i_u=r+IRP $$
Where
\(i_e\) = compensation for expected inflation and
\(i_u\) = compensation for unexpected inflation
The inflation risk premium is the component of an interest rate that compensates an investor for holding nominal assets exposed to inflation risk instead of those that offer a safe inflation-adjusted return. In the case, the inflation risk premium is \(i_e+i_u\).
The variables r, c, \(i_e \text { or } i_u\) can be detected directly. However, the difference between nominal and real interest rates can be observed and given by
$$ R_{nominal} – R_{real}=i_e+ i_u+ c $$
The difference between real and nominal interest rates gives a rough estimate of the expected inflation. However, it overestimates the approximation of future inflation.
The one-year U.S. Treasury bill rate in 2018 was 3.68%, with an expected inflation rate of 1.97%.
The real rate is 3.68% – 1.97% = 1.71%
3. Interest Rates when Default are Possible with Uncertain Inflation.
In the case where inflation is uncertain, and the interest rates are quoted as continuous per annum and that all rates are based on the term of the loan, then the rate on loan is given by:
$$ R^\prime=r+s+i_e+i_u $$
The default risk premium (or credit spread), s, is the component of an interest rate that is attributed to the risk that the borrower of a loan may default on payments. Note that
$$ s=R^\prime-R_{nominal} $$
The formula above implies that credit spread is calculated by finding the difference between the observed on the loan and observed rate on the loan without default risk (nominal rates).
It is worth noting that credit spread varies by the loan term, so the resulting curve is termed as aspread curves. Generally, spread curves can assume different shapes like yield curve but generally upward sloping, implying that the longer the loan term, the greater probability of default.
The liquidity premium is the component of an interest rate that compensates an investor for the risk of loss relative to an investment’s fair value if the investment needs to be converted to cash quickly.
The maturity risk premium is the component of an interest rate that compensates an investor for bearing a longer debt maturity.
The quoted interest rate on a loan is thus ultimately made up of different components as follows,
$$ R^\ast=r+\ IRP+DRP+LP+MRP $$
where
r is the real risk-free rate,
IRP is the inflation risk premium,
DRP is the default risk premium,
LP is the liquidity premium, and
MRP is the maturity risk premium
The level of interest rates is also affected by overhead costs, such as financial intermediation. The demand and supply analysis assumes that lenders and borrowers interact and transact on their own. However, this is practically impossible, and thus there are third parties that act as financial intermediaries. Financial intermediaries in a retail market include banks and savings and loan companies. The intermediation occurs because banks and savings and loan companies receive deposits and offer the same to borrowers. However, the rate charged on the loan is higher than that paid on the deposits, such that it covers the overhead costs and loss due to possible defaults.
In most jurisdictions, banks and savings and loan companies are regulated to ensure the safety of the depositor’s money. More specifically, banks are regulated because they play a pivotal role in most payment systems. Other than banks and savings and loan companies, other lenders have emerged where they do not accept deposits but rather raise funds to lend. Most of the time, these entities are not regulated. In a sense, these lenders operate just like a bank; hence they are mostly referred to as shadow banking.
Saving products in banks and savings and loan companies comes in two forms: savings account and certificate of deposits (C.D.s). A savings account allows the depositor to withdraw funds up to the full amount at any time with no penalty. On the other hand, CD requires a depositor to keep a certain amount of money for a specified period of time before withdrawal; otherwise, there is a penalty for early withdrawal.
The saving interest rates are determined by economic factors such as inflation and other factors such as the banks’ overhead cost. Larger banks with numerous business lines tend to have high overhead costs, translating to lower saving interest rates than relatively small banks.
Another factor affecting saving interest rate is the environment in which a bank is operating. For instance, if the demand for a loan is high in an environment a bank is operating, the banks maybe willing to pay more savings interest to gain more deposits.
Moreover, the kind of business the bank runs affects the amount of interest rate to be paid. For instance, if a bank wishes to grow its loan book, it might raise the saving interest rates to attract more deposits.
The credit rating of a bank also affects the level of savings rates paid by the banks. For instance, banks that are perceived to be a greater risk of failing may offer higher savings rates as an incentive for the depositors to retain their money in the bank.
Lending Interest Rates
Typically banks and savings and loan companies offer three types of lending products:
Unsecured loans refer to loans that have no guarantors or any underlying collateral. In these loans, the lender is purely dependent on the borrower’s creditworthiness, and in case of default, the lender has no assets to seize and sell. Credit cards and personal loans fall into this category.
Secured loans are loans that have underlying collateral. In the event of default, the lender can repossess the underlying collateral to repay the loan or at least reduce the financial loss. Mortgages and auto loans fall into this category
Guaranteed loans are loans that have a guarantor. In the event of default, the guarantor assumes the debt obligation. Student loans guaranteed by the federal government are guaranteed loans.
If a default occurs, the financial loss incurred is reduced in secured and guaranteed loans; all else equal, the rate on these loans will be lower than on unsecured loans.
Other factors influencing the interest rates on the products above are:
Governments and corporations borrow funds by issuing bonds. An investor buying a government and corporate bond is lending money to the government and corporation, respectively. The different forms of bonds are discussed in the following paragraphs.
U.S. Treasury securities are securities issued by the Treasury department of the U.S. government. They represent borrowing by the federal government over a period of time and are generally considered risk-free. This generally means that the interest rates will be lower relative to other borrowings by corporations.
Treasury bills are short-term borrowings with maturities of one year or less and function like zero-coupon bonds, which pay no periodic coupon payments with the bills bought at a discount and repaid at face value on maturity.
Treasury notes are medium-term borrowings with tenors of two to ten years.
Treasury bonds are long-term borrowings with tenors of more than ten years.
The notes and bonds pay interest at regular intervals normally semi-annually. The interest payments and maturity amount can be fixed at issue, nominal return bonds, or indexed to inflation, real return bonds.
State and local government bonds are bonds issued by states and local governments to raise money for public infrastructure projects such as schools, housing, hospitals, roads, and any other projects for the public good.
Revenue bonds are backed by revenue generated from the infrastructure build from the borrowing, e.g. road tolls levied on highways built from borrowings. General obligation bonds are backed by the general taxing authority of the state or local government.
The income from these bonds usually is tax-exempt, which makes them attractive investment opportunities though some are not tax-exempt but still with a preferential tax rate.
Government bonds in Canada – These are low risk bonds issued by the Government of Canada ranging from 91-day Treasury bills to long-term Treasury bonds. They are usually issued in Canadian dollars, but some are issued in U.S. dollars to attract a wider array of investors who have obligations in the U.S. dollar and do not wish to be exposed to currency fluctuation risks. Most features of these instruments are similar to those issued by the U.S. government.
Corporate bonds are issued by companies to raise money for capital expenditure, operations, and acquisitions. These bonds usually have more credit risk than government bonds and hence pay higher interest rates.
Due to the wide variety of companies issuing corporate bonds, the creditworthiness is assessed using the bond issuer rating normally determined by one of the rating agencies Standard & Poor’s (S&P), Moody’s, or Fitch Group. Higher-rated companies will have a lower risk of default; hence bonds issued by such companies will have lower yields.
Liquidity, which refers to the ease with which it is possible to buy or sell a particular bond and the costs associated with doing so, is a more significant concern for corporate bonds as some of them will not be transacted as frequently as government bonds. It is measured using the bid-ask spread with a higher bid-ask spread, indicating that the bond is more illiquid and hence more costly to trade.
This results in the bonds having higher yields than equivalent government bonds.
Seniority refers to the order followed in repaying the bondholders in the event of default or liquidation. According to seniority, bonds can be categorized into equity, junior secured bonds, and senior secured bond in that order from the least secured to the most secured.
The central bank is a special bank in most countries that control money flow through the country. The functions of a central bank vary from one country to another. As such, Central banks play an important role in influencing the general level of a country’s interest rates through two key functions (applies to all central banks):
The central bank plays an essential role in facilitating payments by acting as an intermediary between commercial banks.
Commercial banks are required to maintain a reserve account with the central bank. As part of its role, the central bank uses this account to net off interbank transactions and continuously monitors the extension of credit together with the creditworthiness. Given the neutrality position that a central bank normally has together with trust from the public and institutions, it can facilitate this fiduciary role effectively.
If commercial banks exhaust their resources and run into a liquidity crisis, they approach the central as a lender of last resort. This ensures that there is no systemic failure of the banking system, thereby maintaining the confidence of the financial system.
The U.S. central bank, the Federal Reserve, is made up of three main parts:
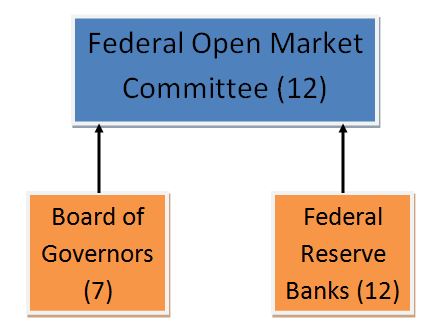
The Federal Reserve is responsible for monetary policy for which it uses three tools:
FOMC is responsible for open market operations, whereas the Board of Governors is responsible for it.
FOMC consists of 12 members, as follows:
The remaining FRB presidents attend meetings of the FOMC but as non-voting members.
The Committee has eight meetings in a year where it reviews economic and financial conditions, determines the appropriate stance of monetary policy, and assesses the risks to its long-run goals of price stability and sustainable economic growth.
As noted above, FOMC influences the money supply through open-market operations, which it does through setting a target rate for the federal funds rate. Depository institutions charge each other for overnight loans of funds from their reserve balances at this interest rate.
FOMC will decide on the target federal funds rate, which it then achieved by:
Besides this, the Federal Reserve actively buys and sells government securities in the secondary market to influence the federal funds rate level. The impact of this is felt through an increase or decrease in the money supply and is carried out at the Open Market Desk of the Federal Reserve Bank of New York
The Board is the Federal Reserve’s main governing body and consists of seven members nominated by the U.S. president and confirmed by the Senate to serve 14-year terms.
The Board supervises the work of the FRBs and issues a variety of banking and consumer-credit regulations.
It sets the reserve requirements, which is required to be between 8% to 14% for transaction deposits and up to 9% on non-personal time deposits. It also approves the discount rate recommended by the directors of the FRBs.
The discount rate is the rate at which depository institutions borrow from the Federal Reserve. Most of these institutions will prefer to borrow amongst themselves rather than from the Federal Reserve as the latter could be viewed negatively by the markets. The Chairman of the Board of Governors also serves as the Chairman of the FOMC.
In summary, the Federal Reserve is expected to conduct monetary policy in a way that promotes:
Pursuing one of these could result in a conflict with another, making monetary policy complex, and the Federal Reserve has to balance this finely.
Access actuarial exam study notes, practice questions, and video lessons to strengthen your understanding of the determinants of interest rates.
Offered by AnalystPrep


Get Ahead on Your Study Prep This Cyber Monday! Save 35% on all CFA® and FRM® Unlimited Packages. Use code CYBERMONDAY at checkout. Offer ends Dec 1st.