


Hypothesis Test on Correlation
Intuitively, if the correlation coefficient between two variables is zero, then there is... Read More

Hypothesis testing is used to confirm if the estimated regression coefficients bear any statistical significance. Either the confidence interval approach or the t-test approach can be used in hypothesis testing. In this section, we will explore the t-test approach.
The following are the steps followed in the performance of the t-test:
$$t=\frac{\widehat{b_1}-b_1}{s_{\widehat{b_1}}}$$
Where:
\(b_1\) = True slope coefficient.
\(\widehat{b_1}\) = Point estimate for \(b_1\)
\(b_1 s_{\widehat{b_1\ }}\) = Standard error of the regression coefficient.
An analyst generates the following output from the regression analysis of inflation on unemployment:
$$\small{\begin{array}{llll}\hline{}& \textbf{Regression Statistics} &{}&{}\\ \hline{}& \text{Multiple R} & 0.8766 &{} \\ {}& \text{R Square} & 0.7684 &{} \\ {}& \text{Adjusted R Square} & 0.7394 & {}\\ {}& \text{Standard Error} & 0.0063 &{}\\ {}& \text{Observations} & 10 &{}\\ \hline {}& & & \\ \hline{} & \textbf{Coefficients} & \textbf{Standard Error} & \textbf{t-Stat}\\ \hline \text{Intercept} & 0.0710 & 0.0094 & 7.5160 \\\text{Forecast (Slope)} & -0.9041 & 0.1755 & -5.1516\\ \hline\end{array}}$$
At the 5% significant level, test the null hypothesis that the slope coefficient is significantly different from one, that is,
$$ H_{0}: b_{1} = 1\ vs. \ H_{a}: b_{1}≠1 $$
Solution
The calculated t-statistic, \(\text{t}=\frac{\widehat{b_{1}}-b_1}{\widehat{S_{b_{1}}}}\) is equal to:
$$\begin{align*}\text{t}& = \frac{-0.9041-1}{0.1755}\\& = -10.85\end{align*}$$
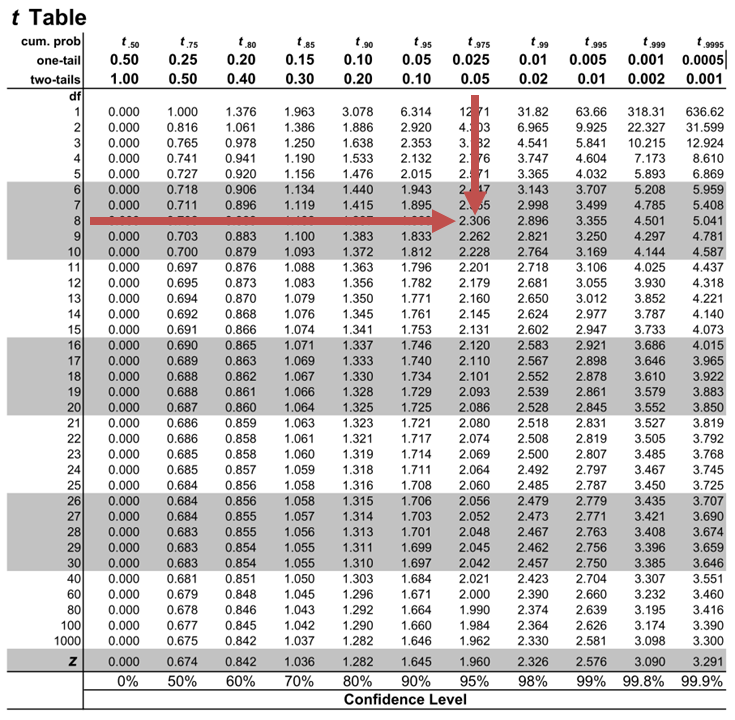
The critical two-tail t-values from the table with \(n-2=8\) degrees of freedom are:
$$\text{t}_{c}=±2.306$$
Notice that \(|t|>t_{c}\) i.e., (\(10.85>2.306\))
Therefore, we reject the null hypothesis and conclude that the estimated slope coefficient is statistically different from one.
Note that we used the confidence interval approach and arrived at the same conclusion.
Question
Neeth Shinu, CFA, is forecasting price elasticity of supply for a certain product. Shinu uses the quantity of the product supplied for the past 5months as the dependent variable and the price per unit of the product as the independent variable. The regression results are shown below.
$$\small{\begin{array}{lccccc}\hline \textbf{Regression Statistics} & & & & & \\ \hline \text{Multiple R} & 0.9971 & {}& {}&{}\\ \text{R Square} & 0.9941 & & & \\ \text{Adjusted R Square} & 0.9922 & & & & \\ \text{Standard Error} & 3.6515 & & & \\ \text{Observations} & 5 & & & \\ \hline {}& \textbf{Coefficients} & \textbf{Standard Error} & \textbf{t Stat} & \textbf{P-value}\\ \hline\text{Intercept} & -159 & 10.520 & (15.114) & 0.001\\ \text{Slope} & 0.26 & 0.012 & 22.517 & 0.000\\ \hline\end{array}}$$
Which of the following most likely reports the correct value of the t-statistic for the slope and most accurately evaluates its statistical significance with 95% confidence?
A. \(t=21.67\); slope is significantly different from zero.
B. \(t= 3.18\); slope is significantly different from zero.
C. \(t=22.57\); slope is not significantly different from zero.
Solution
The correct answer is A.
The t-statistic is calculated using the formula:
$$\text{t}=\frac{\widehat{b_{1}}-b_1}{\widehat{S_{b_{1}}}}$$
Where:
- \(b_{1}\) = True slope coefficient
- \(\widehat{b_{1}}\) = Point estimator for \(b_{1}\)
- \(\widehat{S_{b_{1}}}\) = Standard error of the regression coefficient
$$\begin{align*}\text{t}&=\frac{0.26-0}{0.012}\\&=21.67\end{align*}$$
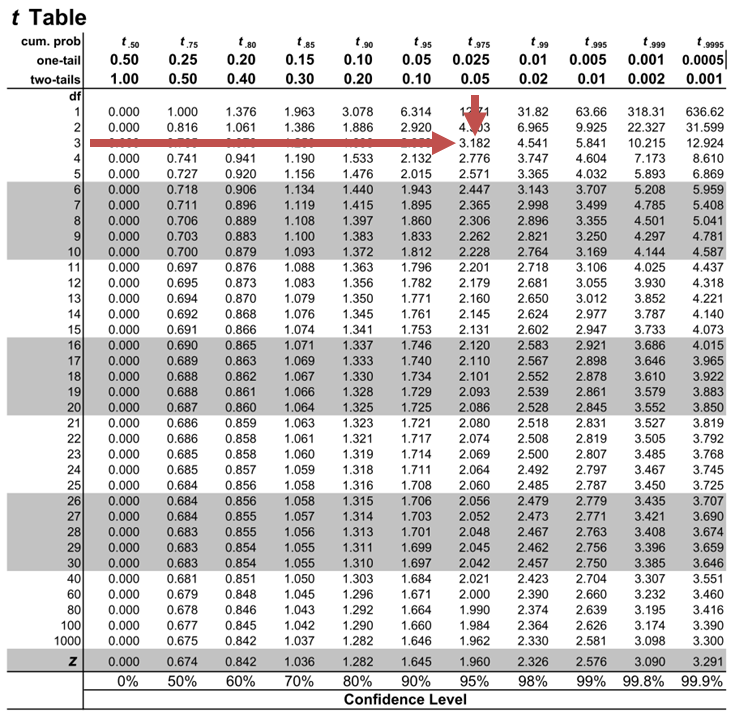
The critical two-tail t-values from the t-table with \(n-2 = 3\) degrees of freedom are:
$$t_{c}=±3.18$$
Notice that \(|t|>t_{c}\) (i.e \(21.67>3.18\)).
Therefore, the null hypothesis can be rejected. Further, we can conclude that the estimated slope coefficient is statistically different from zero.
Access CFA Level I practice questions, video lessons, and study notes covering regression analysis, hypothesis testing, and statistical inference in quantitative methods.


Get Ahead on Your Study Prep This Cyber Monday! Save 35% on all CFA® and FRM® Unlimited Packages. Use code CYBERMONDAY at checkout. Offer ends Dec 1st.