


Bootstrap Resampling
Resampling Resampling means repeatedly drawing samples from the original observed sample to make... Read More

Since the deviations from the mean are squared when calculating variance, we cannot determine whether significant deviations are more likely to be positive or negative. In order to identify other crucial distributional traits, we must look beyond measures of central tendency, location, and dispersion.
Skewness refers to the degree of deviation from a symmetrical distribution, such as the normal distribution. A symmetrical distribution has identical shapes on either side of the mean.

Nonsymmetrical distributions have unequal shapes on either side of the mean, leading to skewness. This is because they depart from the normal distribution’s usual bell shape.
Skewness can be positive, negative, or, in some cases, undefined. The shape of a skewed distribution depends on outliers, which are extremely negative and positive observations.
A positively skewed distribution has a long right tail because of many outliers or extreme values on the right side. Perhaps the best way to remember its shape is to consider its points in a positive direction. In a positively skewed distribution, the majority of data points are clustered to the left of the mean, while the right tail is elongated due to extreme positive values (outliers).
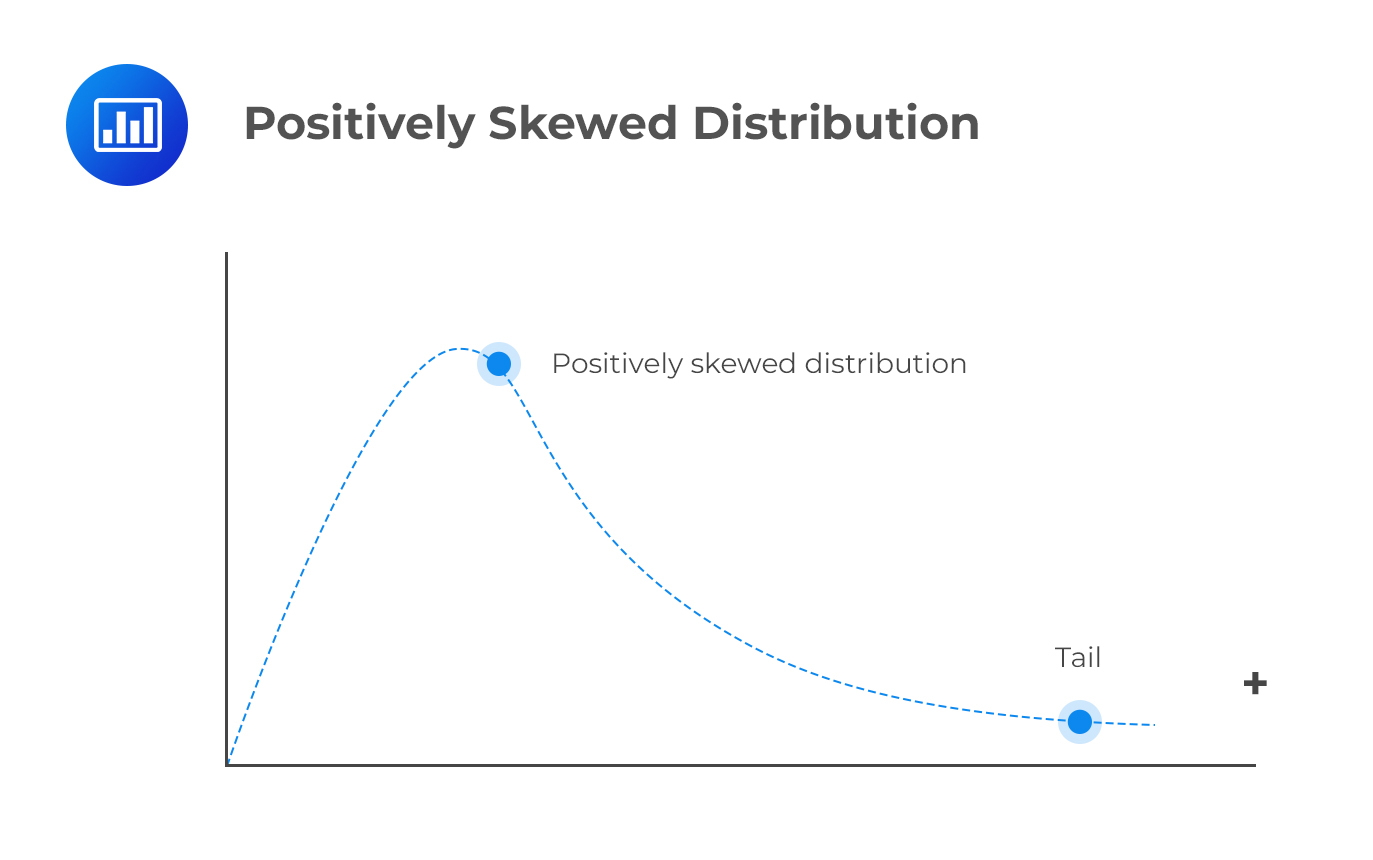
An example of a positively skewed distribution would be the income of individuals living in a specific country.
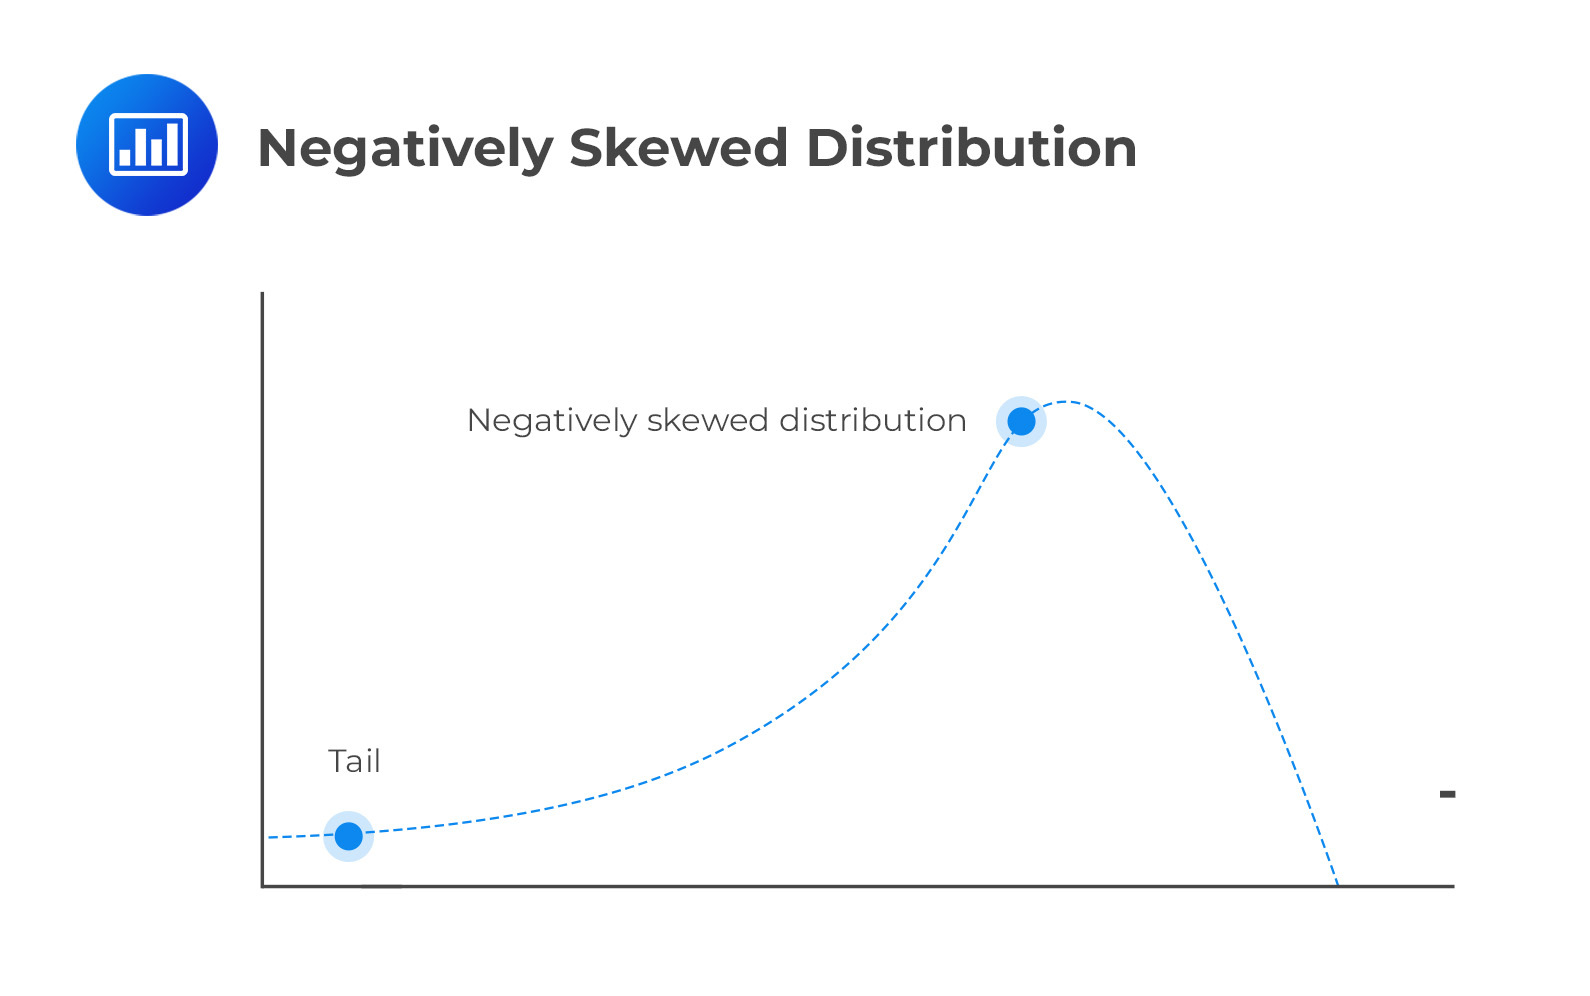
A negatively skewed distribution has a long left tail resulting from many outliers on the left side of the distribution. Therefore, we could say that it points in the negative direction. This is because the right side harbors most of the data points.
Skewness matters in finance. Market data often show positive or negative skewness, like stock prices or mortgage costs. Investors can predict if future prices will be above or below the mean based on the skewness of the market segment.
The approximate sample skewness when sample is large \((n\geq100)\) is given by:
$$\text{Skewness}=\left(\frac{1}{n}\right)\frac{\sum_{i=1}^{n}{(X_i-\bar{X})}^3}{s^3}$$
Where:
\(\bar{X}\) = Sample mean.
\(s\) = Sample standard deviation.
\(n\) = Number of observations.
A positive value indicates positive skewness. A ‘zero’ value indicates that the data is not skewed. Lastly, a negative value indicates negative skewness or a negatively skewed distribution.
Example: Calculating Skewness
Suppose we have the following observations:
{12 13 54 56 25}
What is the skewness of the data?
Solution
First, we must determine the sample mean and the sample standard deviation:
$$\begin{align}\bar{X}&=\frac{\left(12+13+54+56+25\right)}{5}=\frac{160}{5}=32\\ s^2 &=\frac{(12-32)^2+(13-32)^2+\ldots(25-32)^2}{4}\\ &=467.5\end{align}$$
Therefore,
$$s=\sqrt{467.5}=21.62$$
Now we can work out the skewness:
\begin{align*}\text{Skewness} &= \left(\frac{1}{n}\right)\frac{\sum_{i=1}^{n}{(X_i-\bar{X})}^3}{s^3}\\
\text{Skewness}&=\left(\frac{1}{5}\right)\frac{{(-20)}^3+{(-19)}^3+{22}^3+{24}^3+{(-7)}^3}{{21.62}^3}\\
\text{Skewness}&=0.1835\end{align*}
Skewness is positive. Hence, the data has a positively skewed distribution.
Kurtosis refers to the measurement of the degree to which a given distribution is more or less ‘peaked’ relative to the normal distribution. The concept of kurtosis is instrumental in decision-making. In this regard, we have three categories of distributions:
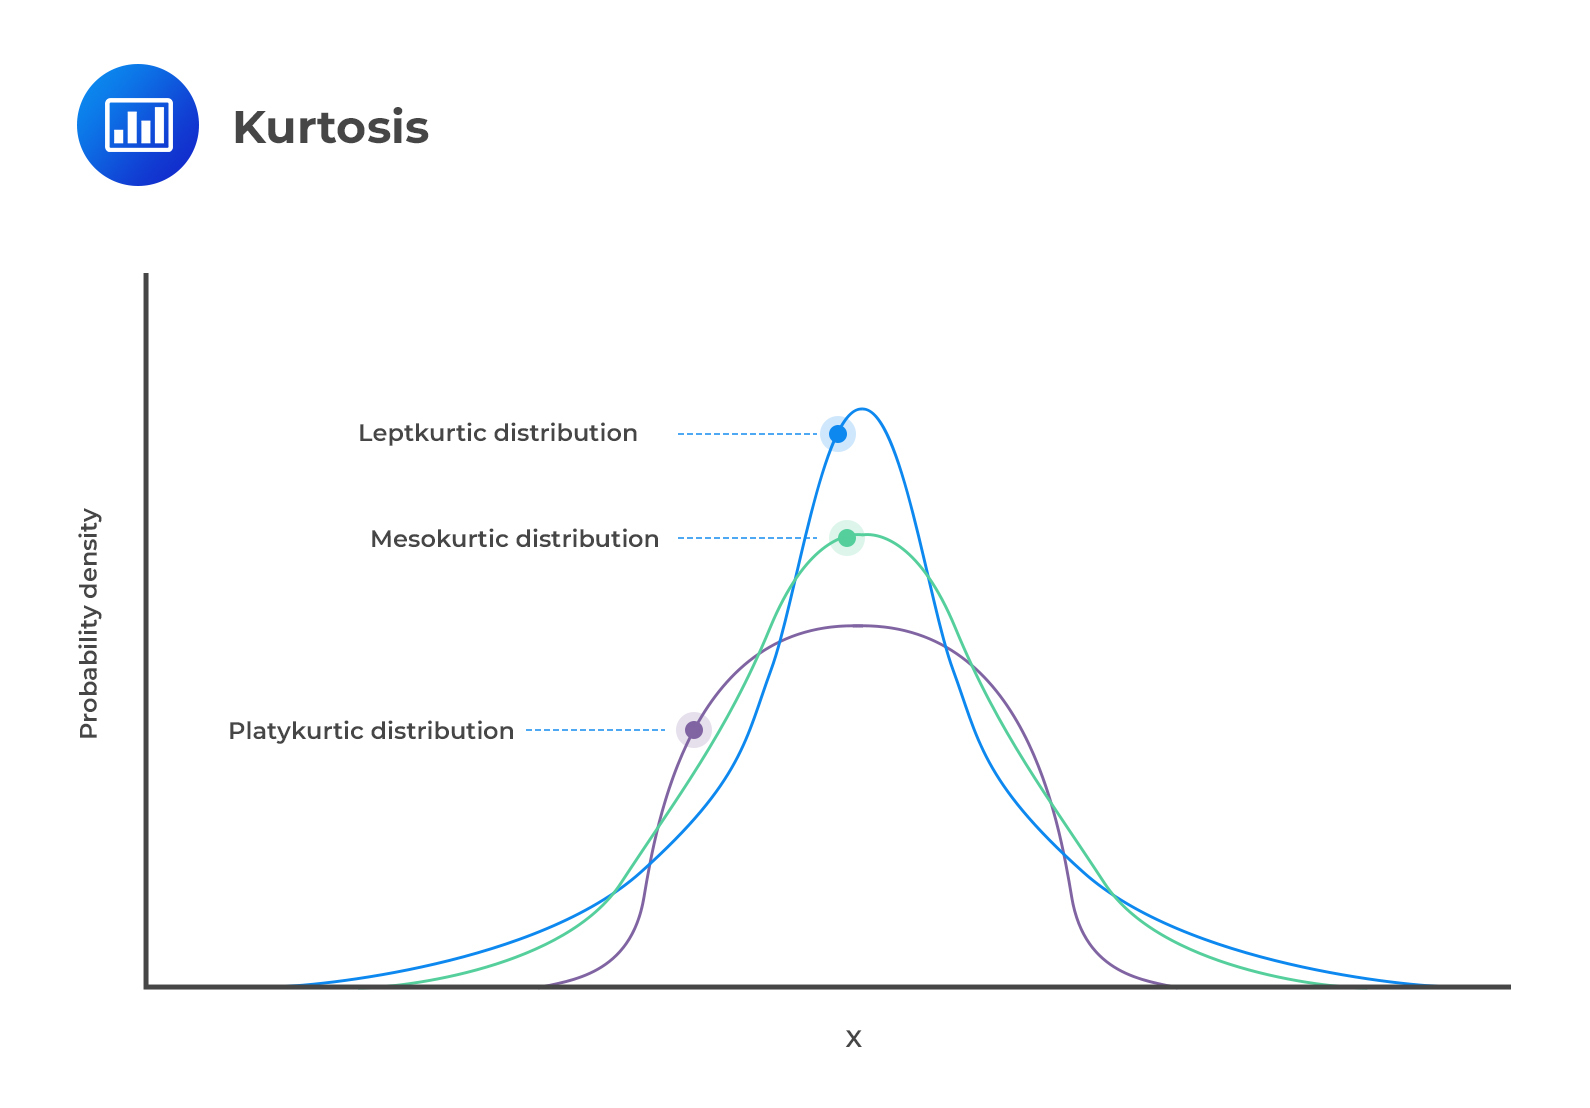
A leptokurtic distribution peaks more than the normal distribution. The higher peak results from the clustering of data points along the x-axis. The tails are also fatter than those of a normal distribution. The coefficient of kurtosis is usually more than 3.
The term “lepto” means thin or skinny. When analyzing historical returns, a leptokurtic distribution means that small changes are less frequent since historical values are clustered around the mean. However, there are also large fluctuations represented by the fat tails.
A platykurtic distribution has extremely dispersed points along the x-axis, resulting in a lower peak when compared to a normal distribution. “Platy” means broad. Hence, the prefix fits the distribution’s shape, which is wide and flat. The points are less clustered around the mean compared to a leptokurtic distribution. The coefficient of kurtosis is usually less than 3.
Returns that follow this type of distribution have fewer major fluctuations compared to leptokurtic returns. However, you should note that fluctuations represent the riskiness of an asset. More fluctuations represent more risk and vice versa. Therefore, platykurtic returns are less risky than leptokurtic returns.
Lastly, mesokurtic distributions have a curve that is similar to that of a normal distribution. In other words, the distribution is mainly normal.
The majority of equity return series are found to have fat tails. Suppose a return distribution has fat tails, and we apply statistical models that do not consider distribution. In that case, we will overestimate the probability of either extremely poor or very favorable outcomes.
Investors often study a stock’s daily trading volume distribution to assess its trading liquidity. It helps them see if the market can handle a large trade in that stock. This is useful for investors who want to make big investments or exit their positions in a particular stock.
Sample kurtosis is always measured relative to the kurtosis of a normal distribution, which is 3. Therefore, we are always interested in the “excess “kurtosis, i.e.,
$$ \text{Excess kurtosis} = \text{Sample kurtosis} – 3 $$
Where:
$$\text{Sample Excess Kurtosis}=\left(\frac{1}{n}\right)\frac{\sum_{i=1}^{n}{(X_i-\bar{X})}^4}{s^4}-3$$
Positive excess kurtosis indicates a leptokurtic distribution. A zero value indicates a mesokurtic distribution. Lastly, a negative excess kurtosis represents a platykurtic distribution.
Example: Calculating Kurtosis
Using the data from the example above (12, 13, 54, 56, and 25), determine the type of kurtosis present.
$$\begin{align}\bar{X}&=\frac{\left(12+13+54+56+25\right)}{5}=\frac{160}{5}=32\\ {s}^2&=\frac{({12-32)}^2+({13-32)}^2+\ldots({25-32)}^2}{4}=467.5\\ s &=\ \sqrt{467.5}=21.62\end{align}$$
Therefore,
$$\begin{align}\text{Excess Kurtosis}&=\left(\frac{1}{n}\right)\frac{\sum_{i=1}^{n}{(X_i-\bar{X})}^4}{s^4}-3\\ \text{Excess Kurtosis}&=\left(\frac{1}{5}\right)\frac{\left(-20\right)^4+\left(-19\right)^4+{22}^4+{24}^4+\left(-7\right)^4}{{21.62}^4}-3\\\text{Excess Kurtosis}&=-2.2139\end{align}$$
Since the excess kurtosis is negative, we have a platykurtic distribution.
Question 1
The skewness of the normal distribution is most likely:
- Zero.
- Positive.
- Negative.
Solution
The correct answer is A.
Since the normal curve is symmetric about its mean, its skewness is zero.
B is incorrect because a positively skewed distribution has positive skewness.
C is incorrect because a negatively skewed distribution has negative skewness.
Question 2
A frequency distribution in which there are too few scores at the extremes of the distribution is most likely called:
- Platykurtic.
- Leptokurtic.
- Mesokurtic.
Solution
The correct answer is A.
A platykurtic distribution has “thin” tails and is flatter compared to a normal distribution. It implies that there are fewer scores at the extremes of the distribution, which aligns with the question’s description.
Question 3
When most of the data are concentrated on the left of the distribution, it is most likely called:
- Symmetric distribution.
- Positively skewed distribution.
- Negatively skewed distribution.
Solution
The correct answer is B.
A distribution is said to be skewed to the right or positively skewed when most of the data are concentrated on the left of the distribution. A distribution is said to be skewed to the left or negatively skewed if most of the data are concentrated on the right of the distribution. The left tail clearly extends farther from the distribution’s center than the right tail.
A is incorrect. A symmetric distribution is one in which the left and right sides mirror each other.
C is incorrect. A distribution is said to be skewed to the left or negatively skewed if most of the data are concentrated on the right of the distribution. The left tail extends farther away from the mean than the right tail.
Practice skewness, kurtosis, and distribution analysis with CFA Level I questions.


Get Ahead on Your Study Prep This Cyber Monday! Save 35% on all CFA® and FRM® Unlimited Packages. Use code CYBERMONDAY at checkout. Offer ends Dec 1st.