


Kurtosis and Skewness
Kurtosis refers to measuring the degree to which a given distribution is more... Read More

We calculate the predicted value of the dependent variable, \(Y\), by inserting the estimated value of the independent variable, \(X\), into the regression equation. The predicted value of the dependent variable, \(Y\), is determined using the following formula:
$$\hat{Y}=\widehat{b}_0+\widehat{b}_1X$$
Where:
\(\widehat{Y}\) = Predicted value of the dependent variable.
\(X\) = Estimated value of the independent variable.
The estimated linear regression equation for inflation and unemployment rates for a certain country is:
$$\hat{Y}=0.070953-0.90405X_i$$
Calculate the predicted value of the inflation rate if the forecasted value of the unemployment rate is 7.5%.
Solution
The predicted value of the inflation rate is determined as follows:
$$\begin{align}\hat{Y}&=\widehat{b}_0+\widehat{b}_1X\\ &=0.070953-0.90405\times 7.5\%=0.3\%\end{align}$$
The calculation of the confidence interval for the predicted value of a dependent variable is the same as that of the confidence interval for regression coefficients. The confidence interval for a predicted value of the dependent variable is given by:
$$\text{Prediction Interval}=\ \hat{Y}\pm t_cs_f$$
Where:
\(t_c\)= Two-tailed critical t-value at the given significance level with n – 2 df.
\(\hat{Y}\) = Predicted value of a dependent variable.
\(s_f^2\)= The estimated variance of the prediction error.
$$s_f^2=s_e^2\left[1+\frac{1}{n}+\frac{\left(X-\bar{X}\right)^2}{\left(n-1\right)s_x^2}\right]=s_e^2\left[1+\frac{1}{n}+\frac{\left(X-\bar{X}\right)^2}{\sum_{i\ =\ n}^{n}\left(X_i-\bar{X}\right)^2}\right]$$
Where:
\(s_e^2\) = The squared standard error of estimate.
\(n\) = Nnumber of observations.
\(s_x^2\)= Variance of the independent variable.
\(X\) = Value of the independent variable.
We can, therefore, calculate the standard error of forecast as shown below:
$$s_f=s_e\sqrt{1+\frac{1}{n}+\frac{\left(X-\bar{X}\right)^2}{\sum_{i=n}^{n}\left(X_i-\bar{X}\right)^2}}$$
Consider the results of the regression analysis of inflation on unemployment performed by an analyst:
$$\small{\begin{array}{llll}\hline{}& \textbf{Regression Statistics} & & \\ \hline {}& \text{Multiple R} & 0.8766 & {}\\ {}& \text{R Square} & 0.7684 & {}\\ {}& \text{Adjusted R Square} & 0.7394 & {}\\ {}& \text{Standard Error} & 0.0063 & {}\\ {}& \text{Observations} & 10 & {}\\ \hline{}& \textbf{Coefficients} & \textbf{Standard Error} & \text{t-Stat} \\ \hline\text{Intercept} & 0.0710 & 0.0094 & 7.5160\\ \text{Forecast (Slope)} & -0.9041 & 0.1755 & -5.1516\\ \hline\end{array}}$$
Calculate the 95% confidence interval of the predicted value of the inflation rate given that the forecasted unemployment rate is 7.5%.
Solution
$$\text{Prediction Interval} = \widehat{Y}±t_{c}S_{f}$$
The estimated variance of the prediction error is:
$$S_{f}^{2}=S^{2}\bigg[1+\frac{1}{2}+\frac{(X-\bar{X})^2}{(n-1)S_{x}^{2}}\bigg]$$
$$\begin{align*}S_f^{2}&=0.0063^2\bigg[1+\frac{1}{10} +\frac{(0.075-0.0526)^2}{(10-1)0.0013}\bigg]\\&=0.006733^2\end{align*}$$
From the regression results, the estimated regression equation is:
$$\widehat{Y}=0.0710-0.9041X$$
The predicted value of the inflation rate given an unemployment rate of 7.5% is:
$$\begin{align*}\widehat{Y}&= 0.0710-0.9041\times7.5\%\\&=0.3\%\end{align*}$$
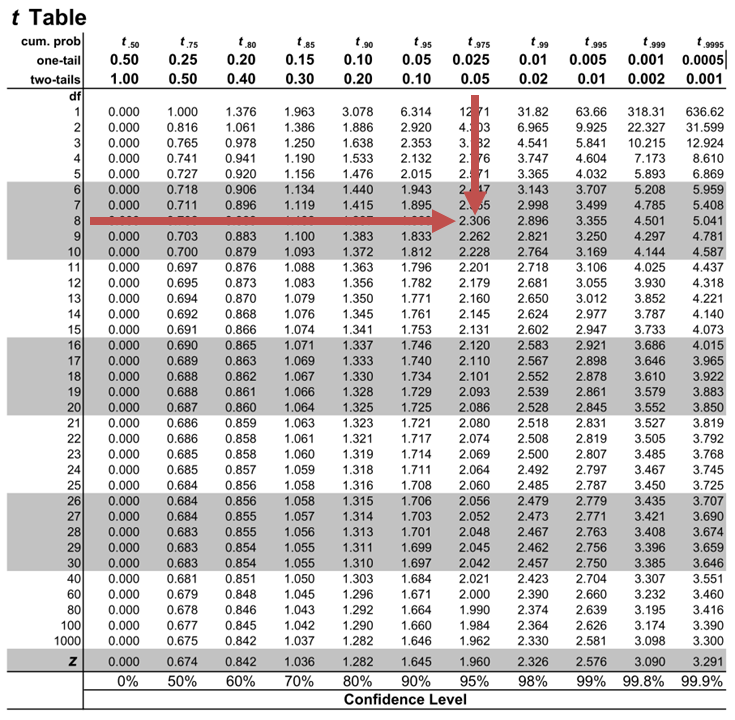
The two-tailed critical t-value with 8 (n-2) degrees of freedom at the 5% significance level is 2.306.
The prediction interval at the 95% confidence level is:
$$\text{Prediction Interval (PI)} = \widehat{Y}±t_{c}S_{f}$$
$$\text{PI} = 0.3\%±2.306\times 0.6735\% = -1.25\% \text{ to } 1.85\%$$
Interpretation
Given an unemployment rate of 7.5%, we are 95% confident that the inflation rate will lie between -1.25% and 1.85%.
Question 1
The regression equation of quantity of goods against the price is given by:
$$Y =-159+0.26X$$
Where:
\(Y\) = Quantity supplied.
\(X\) = Price per unit of the product.
The predicted value of the quantity supplied when the price equals 1,200 is closest to:
- 153.
- 155.
- 471.
The correct answer is A.
$$Y\ =\ -159\ +\ 0.26\times1,200=153$$


Get Ahead on Your Study Prep This Cyber Monday! Save 35% on all CFA® and FRM® Unlimited Packages. Use code CYBERMONDAY at checkout. Offer ends Dec 1st.