Use of Derivatives among Issuers
Financial intermediaries, investors, and issuers use derivative products to increase, reduce, or alter their exposure to an underlying to achieve their financial goals. With the development of derivatives accounting, these instruments are now reported on the balance sheet at their…
Benefits of Derivative Instruments
Benefits 1. Risk Allocation, Transfer, and Management Derivative instruments allow allocation, transfer, and management of risks without trading an underlying. The information on cash or spot market prices for financial instruments, goods, and services may assist an investor or issuer…
Forward Commitments vs. Contingent Claims
Derivatives typically fall into two classes: forward commitments or contingent claims. The primary difference between the two is based on rights and obligations. Forward commitments carry an obligation to transact, whereas contingent claims confer the right to transact but not…
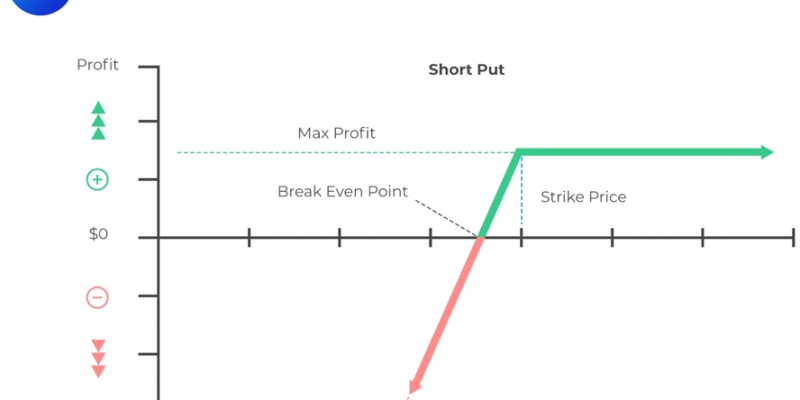
Determining the Value at Expiration and Profit from a Long or a Short Position in a Call or Put Option
Define the following: \(c_T =\) Value of the call at expiration. \(p_T =\) Value of a put option at expiration. \(S_T =\) Price of the underlying at time T. \(X =\) Exercise price. \(c_0=\) Call option premium. \(p_0 =\) Put…
Basic Features of Derivative Markets
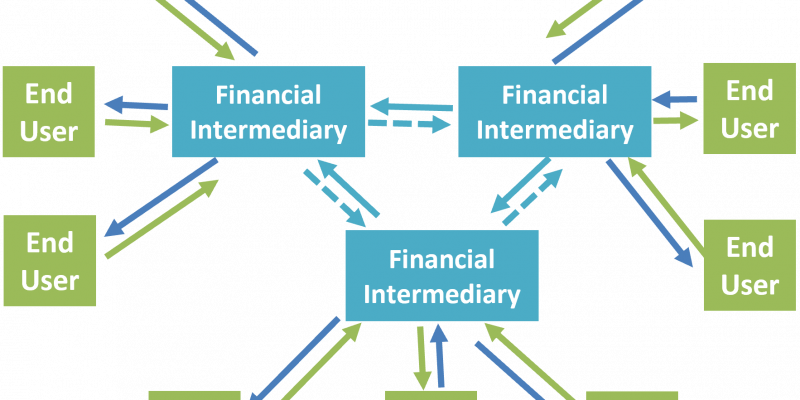
Over-the-Counter (OTC) Derivative Markets OTC derivative markets can be formal institutions such as NASDAQ or an information connection of parties who buy from and sell to one another. In OTC derivative markets, derivatives end-users enter contracts with dealers or a…

Defining Derivative and the Basic Features of a Derivative Instrument
What is a Derivative? A derivative is a financial instrument that derives (obtains) its value from the performance of an underlying. The underlying may be a single asset, a group of assets, or variables such as interest rates. Creation of…
Expected Value, Variance, Standard Deviation, Covariances, and Correlations of Portfolio Returns
A portfolio is a collection of investments a company, mutual fund, or individual investor holds. A portfolio consists of assets such as stocks, bonds, or cash equivalents. Financial professionals usually manage a portfolio.
Data Visualization
Data visualization refers to the presentation of data in a pictorial or graphical format using different graphs such as histograms, polygons, line charts, bar charts, etc. Histogram A histogram is a graphical representation of the data contained in a frequency…
Contingency Tables
A contingency table is a tabular representation of category-based data. It shows the frequencies for particular combinations of values for two discrete random variables, say X and Y. Each cell in the table represents a mutually exclusive combination of X-Y…
