


Option Sensitivity Measures: The “Gr ...
After completing this reading you should be able to: Describe and assess the... Read More
After completing this reading, you should be able to:
Linear regression is a statistical tool for modeling the relationship between two random variables. This chapter will concentrate on the linear regression model (regression model with one explanatory variable).
As stated earlier, linear regression determines the relationship between the dependent variable Y and the independent (explanatory) variable X. The linear regression with a single explanatory variable is given by:
$$Y={\beta}_0 +\beta X +\epsilon$$
Where:
\(β_0\)=constant intercept (the value of Y when X=0)
\(β\)=the Slope which measures the sensitivity of Y to variation in X.
\(ϵ\)=error(sometimes referred to as shock). It represents the portion of Y that cannot be explained by X.
The assumption is that the expectation of the error is 0. That is, \(E(ϵ)=0\) and thus,
$$E[Y]=E[β_0 ]+βE[X]+E[ϵ]$$
$$⇒E[Y]=β_0+βE[X]$$
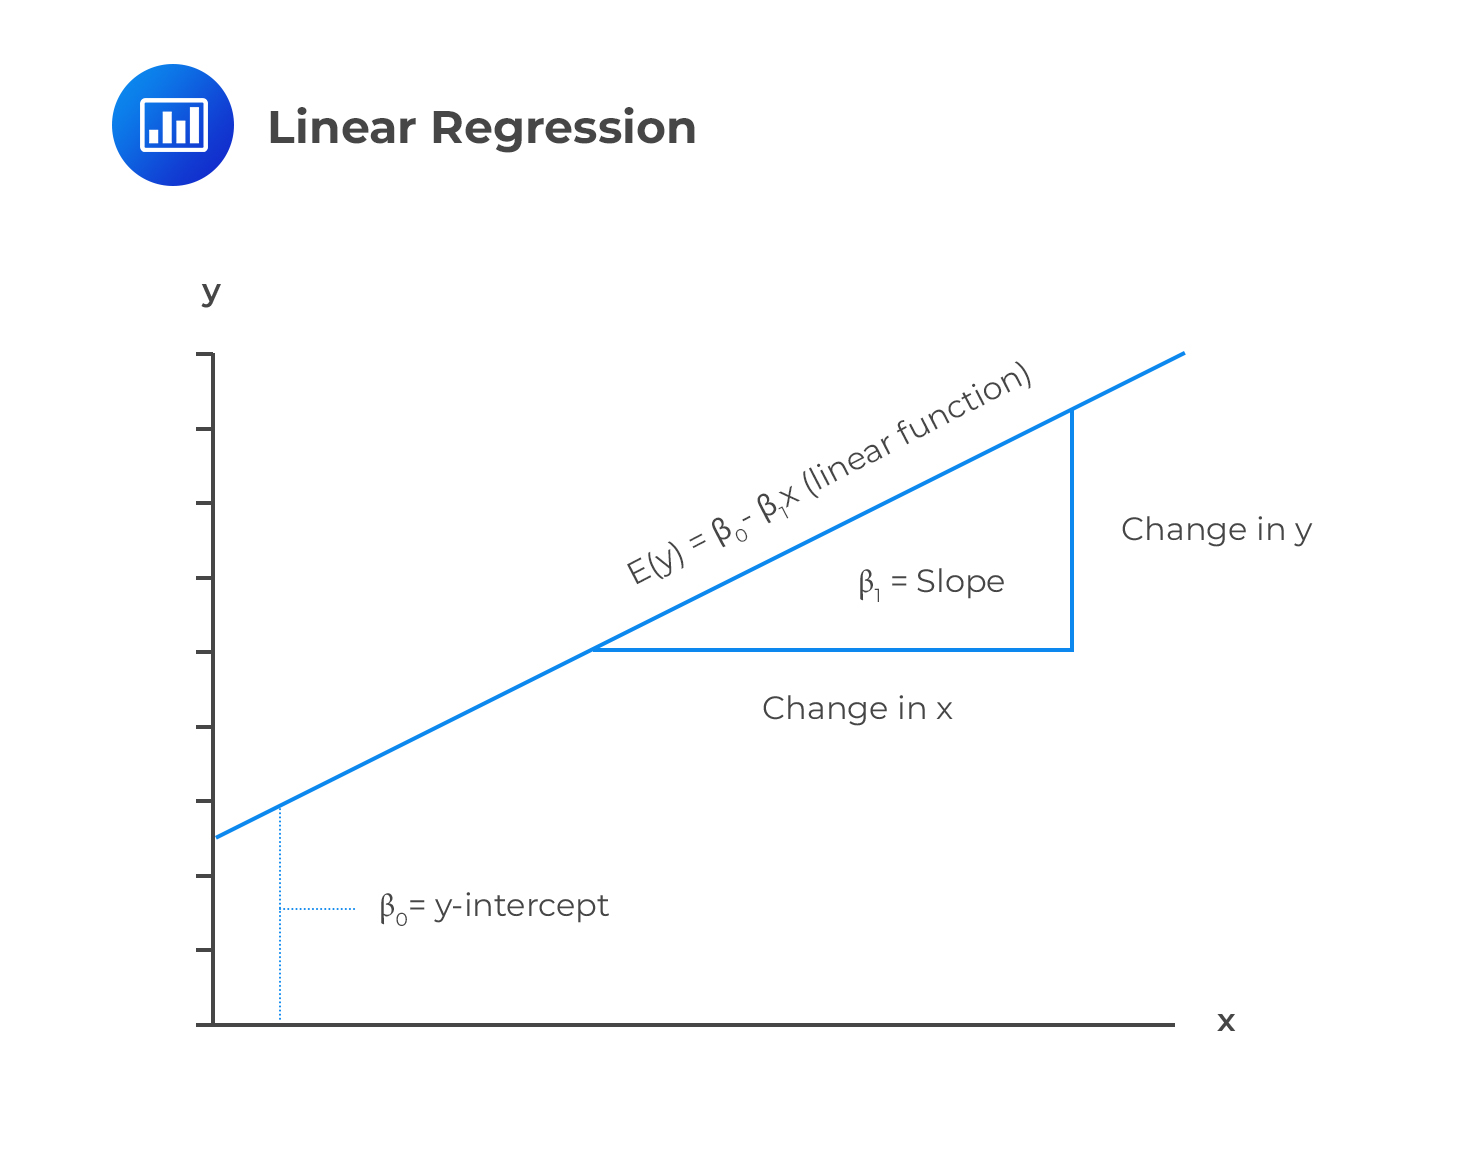 Note that \(β_0\) is the value of Y when \(X=0\). However, there are cases when the explanatory variable is not equal to 0. In this case, \(β_0\) is interpreted as the value that ensures that the \(\bar{Y}\) in the regression line \(\bar{Y}=\hat{\beta}_0 +\hat{\beta}\bar{X}\) where \(\bar{Y}\) and \(\bar{X}\) are the mean of \(y_i\) and \(x_i\) random variables.
The independent variable can be continuous, discrete or even functions. Above the diversity of the explanatory variables, they must satisfy the following conditions:
A good example of a violation of the linearity principle is:
$$Y={\beta}_0 +\beta X^k +\epsilon$$
This model cannot be estimated using linear regression due to the presence of the unknown parameter k, which violates the first restriction (it is non-linear regression function). This kind of nonlinearity can be corrected through transformation.
When a linear regression model does not satisfy the linearity conditions stated above, we can reverse the violation of the restrictions by transforming the model. Consider the model:
$$Y={\beta}_0 X^{\beta} \epsilon$$
Where ϵ is the positive error term (shock). Clearly, this model violates the condition of the restriction since X is raised to an unknown parameter β, and the error term is not additive. However, we can make this model linear by taking natural logarithm on both sides of the equation so that:
$$ln (Y) =\left({\beta}_0 X^{\beta} \epsilon \right)$$
$$ln (Y)=ln {\beta}_0 + \beta ln X +ln \epsilon$$
The last equation can be written as:
$$Y=\hat{\beta}_0 +\beta \hat{X}^k +\hat{\epsilon}$$
Clearly, this equation satisfies the three linearity conditions. It is worth noting that when we are interpreting the parameters of the transformed model, we measure the change of the transformed independent variable X on the transformed variable Y.
For instance, \(ln (Y)=ln {\beta}_0 + \beta ln X +ln \epsilon\) implies that β represents the change in lnY corresponding to a unit change in lnX.
There are cases where the explanatory variables are binary numbers (0 and 1) representing the occurrences of an event. These binary numbers are called dummies. For instance,
Assuming \({ D }_{ i }\) is a variable such that:
$$ { D }_{ i }=\begin{cases} 1 \quad \text{ The student-teacher ratio in ith school}<20 \\ 0\quad \text{ The student-teacher ratio in ith school}\ge 20 \end{cases} $$
The following is the population regression model whose regressor \({ D }_{ i }\):
$$Y_i=β_0+βD_i+ϵ_i ,∀i=0,\dots,n$$
\(\beta \) is the coefficient on \({ D }_{ i }\).
The equation will change to the one written below under the condition that \({ D }_{ i }=0\):
$$ { Y }_{ i }={ \beta }_{ 0 }+{ \epsilon }_{ i } $$
When \({ D }_{ i }=1\):
$$ { Y }_{ i }={ \beta }_{ 0 }+ \beta +{ \epsilon}_{ i } $$
This implies that when \({ D }_{ i }=1\),\(E\left( { Y }_{ i }|{ D }_{ i }=1 \right) ={ \beta }_{ 0 }+{ \beta }_{ 1 }\). The test scores will have a population mean value of \({ \beta }_{ 0 }+{ \beta }_{ 1 }\) when the ratio of students to teachers is low. The conditional expectations of \({ Y }_{ i }\) when \({ D }_{ i }=1 \) and when \({ D }_{ i }=0 \) will have a difference of \({ \beta }_{ 1 }\) between them written as:
$$ \left( { \beta }_{ 0 }+\beta \right) -{ \beta }_{ 0 }= \beta $$
This makes \( \beta \) to be the difference between population means.
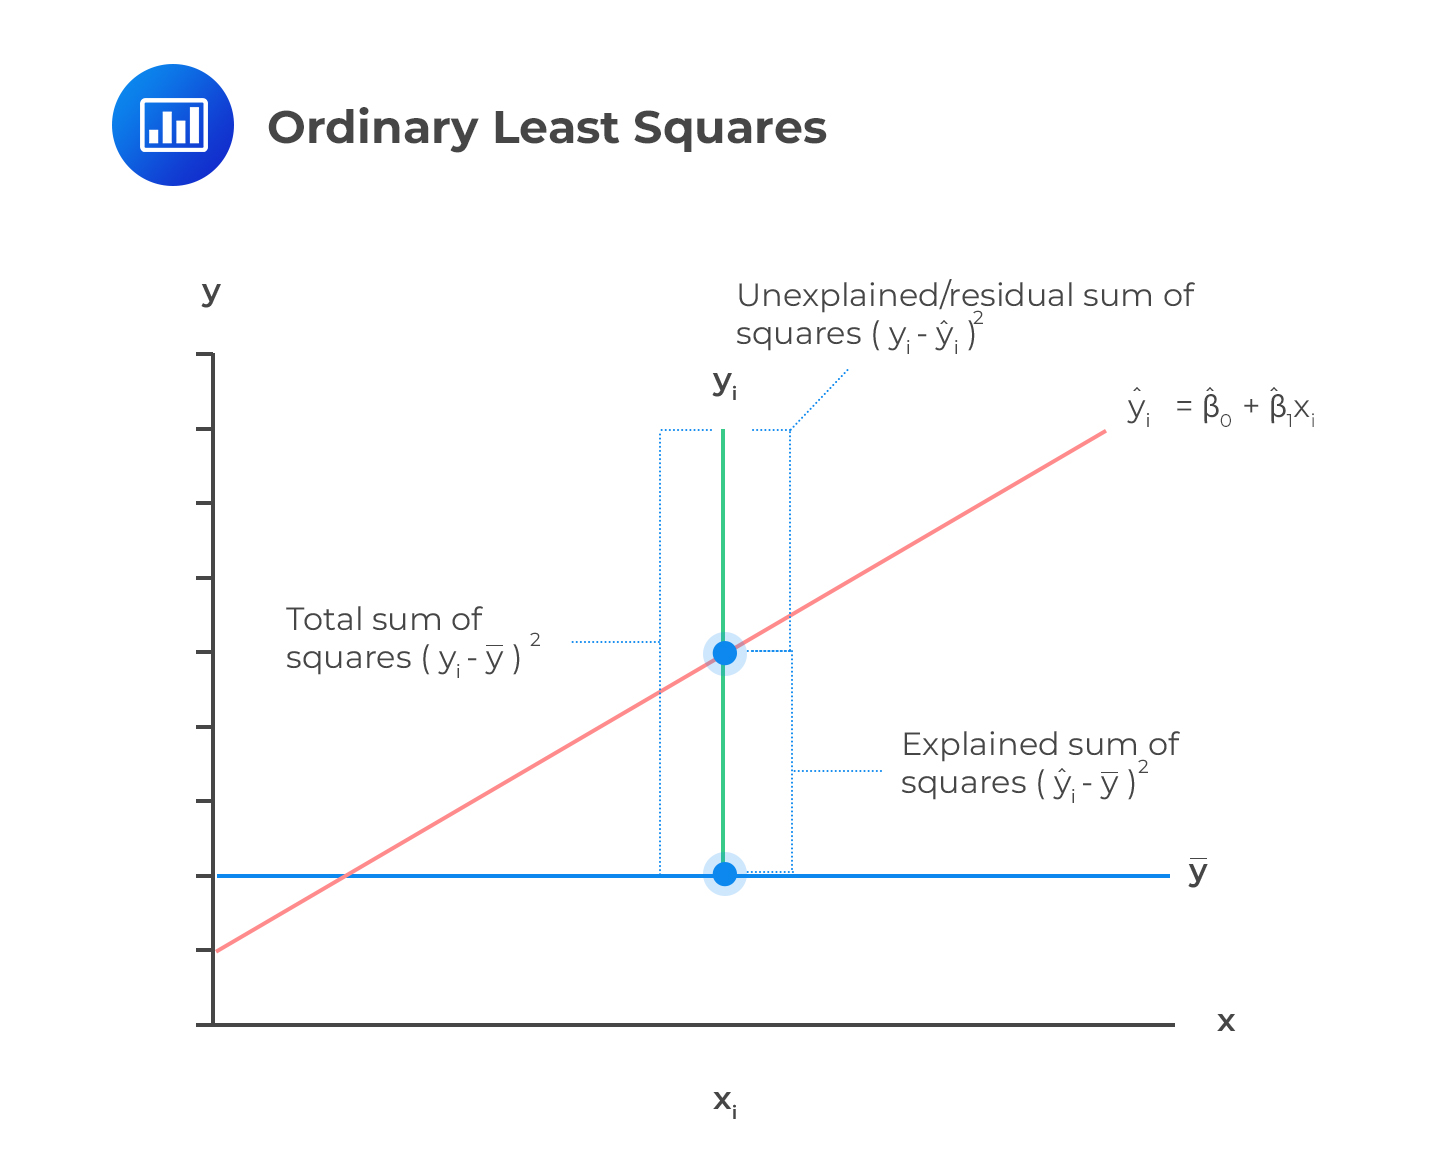
The Ordinary Least Squares (OLS) is a method of estimating the linear regression parameters by minimizing the sum of squared deviations. The regression coefficients chosen by the OLS estimators are such that the observed data and the regression line are as close as possible.
 Consider a regression equation:
$$Y=β_0+βX+ϵ$$
Where each of X and Y consists of n observations each \( (X=x_1,x_2,…, n) \) and \( (Y=y_1,y_2,…,y_n) \). Assume that each of xi and yi are linearly related, then the parameters can be estimated using the OLS. The estimators minimize the residual sum of squares such that:
$$\sum_{i=1}^n {\left(y_i -\hat{\beta_0} -\hat{ \beta } x_i\right)^2}=\sum_{i=1}^n {\hat{\epsilon}_{i}^{2}}$$
Where the \(\hat{\beta}_0\) and \(\hat{\beta}\) are parameter estimators (intercept and the slope respectively) which minimizes the squared deviations between the line \(\hat{\beta_0} +\hat{\beta} x_i\) and \(y_i\) so that:
$$\hat{\beta}_0=\bar{Y}-\hat{\beta} \bar{X} $$
and
$$\hat{\beta}=\frac{\sum_{i=1}^{n} {\left(x_i -\bar{X}\right) \left(y_i -\bar{Y}\right)}}{\sum_{i=1}^{n} {\left(x_i -\bar{X}\right)^2}}$$
Where \(\bar{X}\) and \(\bar{Y}\) are the means of X and Y respectively.
After the estimation of the parameters, the estimated regression line is given by:
$$\hat{y}_i =\hat{\beta}_0 +\hat{\beta}x_i $$
And the linear regression residual error term is given by:
$$\hat{\epsilon}_i =y_i -\hat{y}_i =y_i – \hat{\beta}_0 -\hat{\beta}x_i$$
The variance of the error term is approximated as:
$$s^2=\frac{1}{n-2} \sum_{i=1}^{n}{\hat{\epsilon}_{i}^{2}}$$
It can also be shown that:
$$s^2=\frac{n}{n-2} \hat{\sigma}_{Y}^{2} \left(1-\hat{\rho}_{XY}^{2} \right)$$
Note that n-2 implies that two parameters are estimated and that \(s^2\) is an unbiased estimator of \(σ^2\). Moreover, it is assumed that the mean of the residuals is zero and uncorrelated with the explanatory variables \(X_i\).
Now, consider the formula:
$$\hat{\beta}=\frac{\sum_{i=1}^{n} {\left(x_i -\bar{X}\right)\left(y_i -\bar{Y}\right)}}{\sum_{i=1}^{n} {\left(x_i -\bar{X}\right)^2}}$$
If we multiply both the numerator and the denominator by \(\frac{1}{n}\), we have:
$$\hat{\beta}=\frac{\frac{1}{n} \sum_{i=1}^{n} {\left(x_i -\bar{X}\right)\left(y_i -\bar{Y}\right)}}{\frac{1}{n} \sum_{i=1}^{n} {\left(x_i -\bar{X}\right)^2}}$$
Note that the numerator is the covariance between X and Y, and the denominator is the variance of X. So that we can write:
$$\hat{\beta}=\frac{\frac{1}{n} \sum_{i=1}^{n} {\left(x_i -\bar{X}\right) \left(y_i -\bar{Y}\right)}}{\frac{1}{n} \sum_{i=1}^{n} {\left(x_i -\bar{X}\right)^2}}=\frac{\hat{\sigma}_{XY}}{{\sigma}_X^{2}}$$
Also recall that:
$$Corr(X,Y) ={\rho}_{XY}=\frac{Cov(X,Y)}{{\sigma}_X{{\sigma}_Y}} $$
$$\Rightarrow {\sigma}_{XY} = {\rho}_{XY} {\sigma}_{X} {{\sigma}_{Y}}$$
So,
$$\hat{\beta}=\frac{{\rho}_{XY} {\sigma}_{X} {{\sigma}_{Y}}}{\hat{\sigma}_{X}^{2}}$$
$$\therefore \hat{\beta}=\frac{\hat{\rho}_{XY}\hat{\sigma}_Y}{\hat{\sigma}_X}$$
An investment analyst wants to explain the return from the portfolio (Y) using the prevailing interest rates (X) over the past 30 years. The mean interest rate is 7%, and the return from the portfolio is 14%. The covariance matrix is given by:
$$\left[\begin{matrix}\hat{\sigma}_{Y}^{2}&\hat{\sigma}_{XY}\\ \hat{\sigma}_{XY}&\hat{\sigma}_{X}^{2}\end{matrix}\right]=\left[\begin{matrix}1600&500\\ 500&338 \end{matrix}\right]$$
Assume that the analyst wants to estimate the linear regression equation:
$$\hat{Y}_{i}=\hat{\beta}_{0} +\hat{\beta} X_{i}$$
Estimate the parameters and, thus, the model equation.
Solution
Now,
$$\hat{\beta}=\frac{\hat{\sigma}_{XY}}{\hat{\sigma}_{X}^{2}}=\frac{500}{338}=1.4793$$
and
$$\hat{\beta}_{0}=\bar{Y}-\hat{\beta}\bar{X}=0.14-1.4793\times 0.07=0.0364$$
So, the estimated equation is given by:
$$\hat{Y}_{i}=0.0364 +1.4793 X_{i}$$
The OLS estimators assume the following:
The OLS estimators imply that the parameter estimators are unbiased estimators. That is,\( E(\hat{α})=α\) and \(E(\hat{β})=β\). This is actually true for large sample sizes or rather as the sample sizes increases.
Lastly, the assumptions ensure that that the estimated parameters are normally distributed. The asymptotic distribution of the slope is given by:
$$\sqrt{n}\left(\hat{\beta}-\beta \right) \sim N\left(0,\frac{{\sigma}^{2}}{{\sigma}_{X}^{2}}\right)$$
Where \(σ^2\) is the variance of the error term and \(σ_X^2\) is the variance of X. It is easy to see that the variance of \(\hat{β}\) increases as \(σ^2\) increases.
For the intercept, the asymptotic distribution is defined as:
$$\sqrt{n}\left(\hat{\beta}_{0}-{\beta}_{0} \right) \sim N\left(0,\frac{{\sigma}^{2}\left({\mu}_{X}^{2}-{\sigma}_{X}^{2}\right)}{{\sigma}_{X}^{2}}\right)$$
According to the central limit theorem (CLT), \(\hat{\beta}\) can be treated as the standard random variable with the mean as the true value \(\beta\) and the variance \(\frac{{\sigma}^{2}}{n {\sigma}_{X}^{2}}\). That is:
$$\hat{\beta} \sim N\left(\beta, \frac{{\sigma}^2}{n {\sigma}_{X}^{2} }\right)$$
However, we cannot use this value in hypothesis testing. We need to use the variance estimators such that:
$$σ^2=s^2$$
So, recall that for a large sample size:
$$\hat{\sigma}_{X}=\frac{1}{n}\sum_{i=1}^{n}{\left(x_i – \bar{X}\right)^{2}}$$
$$\Rightarrow n \hat{\sigma}_{X}=\sum_{i=1}^{n}{\left(x_i – \bar{X}\right)^{2}}$$
Therefore, the variance of the parameter \(β\) can be written as:
$$\hat{\sigma}_{\beta}^{2} =\frac{\hat{\sigma}^{2}}{\sum_{i=1}^{n}{\left(x_i – \bar{X}\right)^{2}}}=\frac{s^{2}}{n \hat{\sigma}_{X}^{2}}$$
The standard error estimate of the \(β\) denoted as \(\text{SEE}_{β}\) is equivalent to the square root of its variance, so:
$$\text{SEE}_{β}=\sqrt{\frac{s^{2}}{n \hat{\sigma}_{X}^{2}}} = \frac{s}{\sqrt{n}\hat{\sigma}_{X}}$$
Analogously, the variance of the intercept:
$$\hat{\sigma}_{{\beta}_{0}}^{2}=\frac{s^2 \left(\hat{\mu}_{X}^{2}+ \hat{\sigma}_{X}^{2}\right)}{n \hat{\sigma}_{X}^{2}}$$
When the OLS assumptions are met, the parameters are assumed to be normally distributed when large samples are used. Therefore, we can run a hypothesis tests on the parameters just like the random variable.
A hypothesis is a statistical procedure where an analyst tests an assumption on the population parameters. For instance, we may want to test the significance of a single regression coefficient in a simple linear regression. Most of the hypothesis tests are t-tests.
Whenever a statistical test is being performed, the following procedure is generally considered ideal:
For instance, assume we are testing the null hypothesis that:
$$ H_0:β=β_{H_0} vs. H_1:β≠β_{H_0} $$
Where \(β_{H_0}\) is the hypothesized slope parameter.
Then the test statistic will be:
$$T=\frac{\hat{\beta} -{\beta}_{H_0}}{\text{SEE}_{β}}$$
This statistic possesses asymptotic normal distribution, which is then compared to a critical value \(C_t\). The null hypothesis is rejected if:
$$|T|>C_t$$
For instance, if we assume a 5% significance level in this case, then the critical value is 1.96.
We can also evaluate the p-values. For one-tailed tests, the p-value is given by the probability that lies below the calculated test statistic for left-tailed tests. Similarly, the likelihood that lies above the test statistic in right-tailed tests gives the p-value.
Denoting the test statistic by T, the p-value for \(H_{1 }:\hat{\beta}>0\) is given by:
$$P(Z>|T|)=1-P(Z≤|T|)=1-\Phi (|T|)$$
Conversely, for \(H_{1 }:\hat{\beta}≤0\) the p-value is given by:
$$P(Z≤|T|)=\Phi (|T|)$$
Where z is a standard normal random variable, the absolute value of T (|T|) ensures that the right tail is measured whether T is negative or positive.
If the test is two-tailed, this value is given by the sum of the probabilities in the two tails. We start by determining the probability lying below the negative value of the test statistic. Then, we add this to the probability lying above the positive value of the test statistic. That is the p-value for the two-tailed hypothesis test is given by:
$$2[1-\Phi (|T|)]$$
We can also construct confidence intervals (discussed in detail in the previous chapter). Recall that a confidence interval can be defined as the range of parameters at which the true parameter can be found at a confidence level. For instance, a 95% confidence interval constitutes that the set of parameter values where the null hypothesis cannot be rejected when using a 5% test size.
For instance, if we are performing the two-tailed hypothesis tests, then the confidence interval is given by:
$$\left[\hat{\beta}-C_t \times \text{SEE}_{β},\hat{\beta}+C_t \times \text{SEE}_{β}\right]$$
An investment analyst wants to explain the return from the portfolio (Y) using the prevailing interest rates (X) over the past 30 years. The mean interest rate is 7%, and the return from the portfolio is 14%. The covariance matrix is given by:
$$\left[\begin{matrix}\hat{\sigma}_{Y}^{2}&\hat{\sigma}_{XY}\\ \hat{\sigma}_{XY}&\hat{\sigma}_{X}^{2}\end{matrix}\right]=\left[\begin{matrix}1600&500\\ 500&338 \end{matrix}\right]$$
Assume that the analyst wants to estimate the linear regression equation:
$$\hat{Y}_{i}=\hat{\beta}_{0} +\hat{\beta} X_{i}$$
Test whether the slope coefficient is equal to zero and construct a 95% confidence interval for the slope of the coefficient.
We start by stating the hypothesis:
$$T=\frac{\hat{\beta} -{\beta}_{H_0}}{\text{SEE}_{β}}$$
We had calculated the slope from the matrix as:
$$\hat{\beta}=\frac{\hat{\sigma}_{XY}}{\hat{\sigma}_{X}^{2}}=\frac{500}{338}=1.4793$$
Now, recall that:
$$\text{SEE}_{\hat{\beta}}=\frac{s}{\sqrt{n} \hat{\sigma}_{X}}$$
But
$$s^2=\frac{n}{n-2} \hat{\sigma}_{Y}^{2} \left(1-\hat{\rho}_{XY} \right)$$
So, in this case:
$$s^2=\frac{30}{30-2}\times 1600\left(1-\frac{500}{\sqrt{338}\sqrt{1600}}\right)=548.7251$$
(Note that for \(\hat{\rho}_{XY}\) we have used the relationship \(\hat{\rho}_{XY}=\frac{\hat{\sigma}_{XY}}{\hat{\sigma}_{X}\hat{\sigma}_{Y}}\). )
Therefore,
$$s=\sqrt{s^2}=\sqrt{548.7251}=23.4249$$
So,
$$\text{SEE}_{\hat{\beta}}=\frac{s}{\sqrt{n} \hat{\sigma}_{X}}=\frac{23.4249}{\sqrt{30}\sqrt{338}}=0.23263$$
Therefore the t-statistic is given by:
$$T=\frac{\hat{\beta} -{\beta}_{H_0}}{\text{SEE}_{β}}=\frac{1.4793}{0.23263}=6.3590$$
For the two-tailed test, the critical value is 1.96, and since the t-statistic here is greater than the significant value, then we reject the null hypothesis.
For the 95% CI, we know it is given by:
$$\hat{\beta}-C_t \times \text{SEE}_{β},\hat{\beta}+C_t \times \text{SEE}_{β} $$
$$=\left[1.4793-1.96×0.23263 ,1.4793+1.96×0.23263 \right]$$
$$=[1.0233,1.9353]$$
Practice Question 1
Assume that you have carried out a regression analysis (to determine whether the slope is different from 0) and found out that the slope \(\hat{β}=1.156\). Moreover, you have constructed a 95% confidence interval of [0.550, 1.762]. What is the likely value of your test statistic?
A. 4.356
B. 3.7387
C. 0.7845
D. 0.6545
Solution
The Correct answer is B
This is a two-tailed test since we’re asked to determine if the slope is different from zero. We know that:
$$\left[\hat{\beta}-C_t \times \text{SEE}_{β},\hat{\beta}+C_t \times \text{SEE}_{β} \right]$$
Which in this case is [0.550, 1.762].
We need to find the value of \(\text{SEE}_{β} \). That is:
$$1.156-1.96×\text{SEE}_{β}=0.550⇒\text{SEE}_{β}=\frac{1.156-0.550}{1.96}=0.3092$$
And we know that:
$$T=\frac{\hat{\beta} -{\beta}_{H_0}}{\text{SEE}_{β}}=\frac{1.156-0}{0.3092}=3.7387$$
Practice Question 2
A trader develops a simple linear regression model to predict the price of a stock. The estimated slope coefficient for the regression is 0.60, the standard error is equal to 0.25, and the sample has 30 observations. Determine if the estimated slope coefficient is significantly different than zero at a 5% level of significance by correctly stating the decision rule.
A. Accept H1; The slope coefficient is statistically significant.
B. Reject H0; The slope coefficient is statistically significant.
C. Reject H0; The slope coefficient is not statistically significant.
D. Accept H1; The slope coefficient is not statistically significant.
Solution
The correct answer is B.
Step 1: State the hypothesis
H0:β1=0
H1:β1≠0
Step 2: Compute the test statistic
$$ \frac { β_1 – β_{H0} } { S_{β1} } = \frac { 0.60 – 0} { 0.25 } = 2.4 $$
Step 3: Find the critical value, tc
From the t table, we can find t0.025,28 is 2.048
Step 4: State the decision rule
Reject H0; The slope coefficient is statistically significant since 2.048 < 2.4.
Access FRM practice questions, study notes, mock exams, and video lessons with AnalystPrep.
Offered by AnalystPrep


Get Ahead on Your Study Prep This Cyber Monday! Save 35% on all CFA® and FRM® Unlimited Packages. Use code CYBERMONDAY at checkout. Offer ends Dec 1st.