


What is ERM?
After completing this reading, you should be able to: Describe enterprise risk management... Read More

After completing this reading, you should be able to:
Risk refers to the potential variability of returns around an expected return from a portfolio or an expected outcome. The financial risk that arises from uncertainty can be managed and mitigated. Modern risk management refers to the ability, in many instances, to price risks and to provide adequate compensation for the risk taken in business activities.
The building blocks of risk management include:
Risk can be grouped depending on different types of business environments. Grouping the risks is essential for business institutions to factor in specific risks while managing them. This is true because each type of risk needs different skills to manage it.
A typical typology of risks should always be flexible to accommodate new forms of risks that are ever-emerging (such as cyber risks). The following diagram gives the typical modern typology of corporate risks:
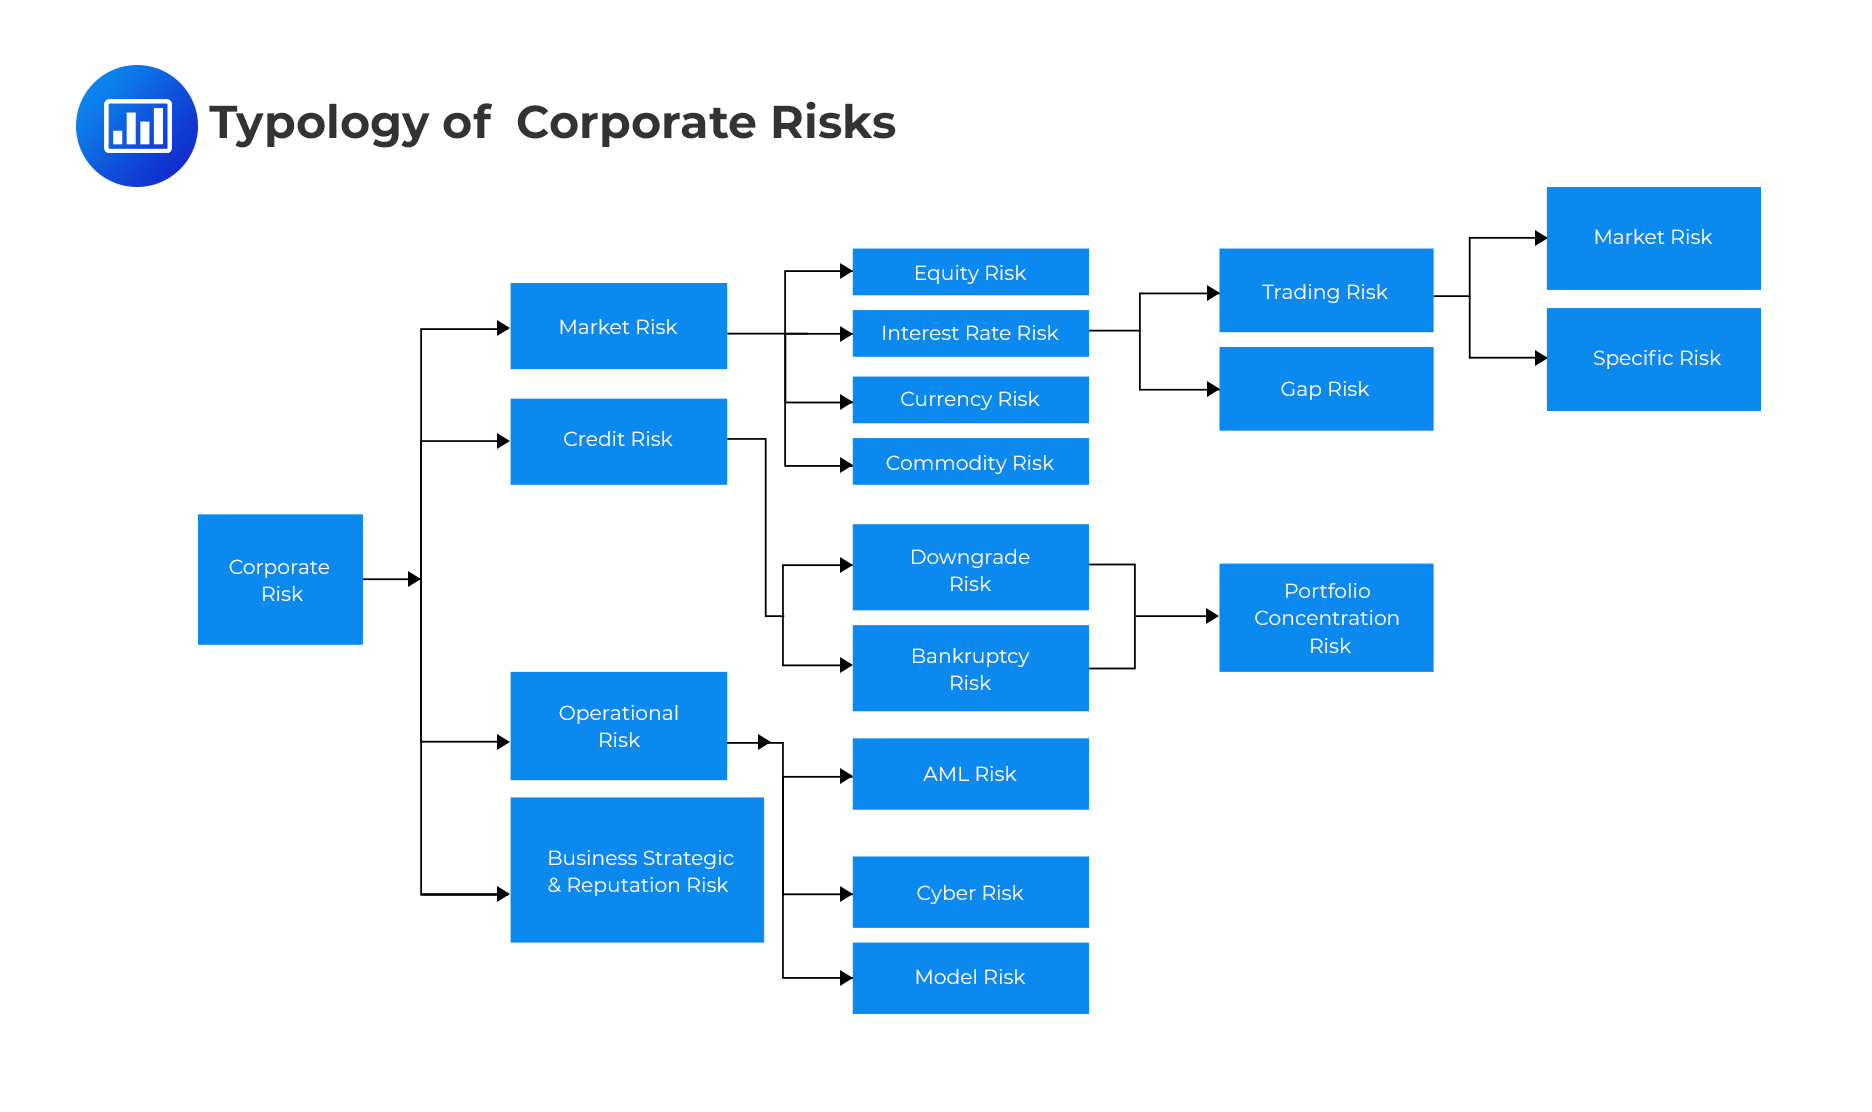 Market Risk
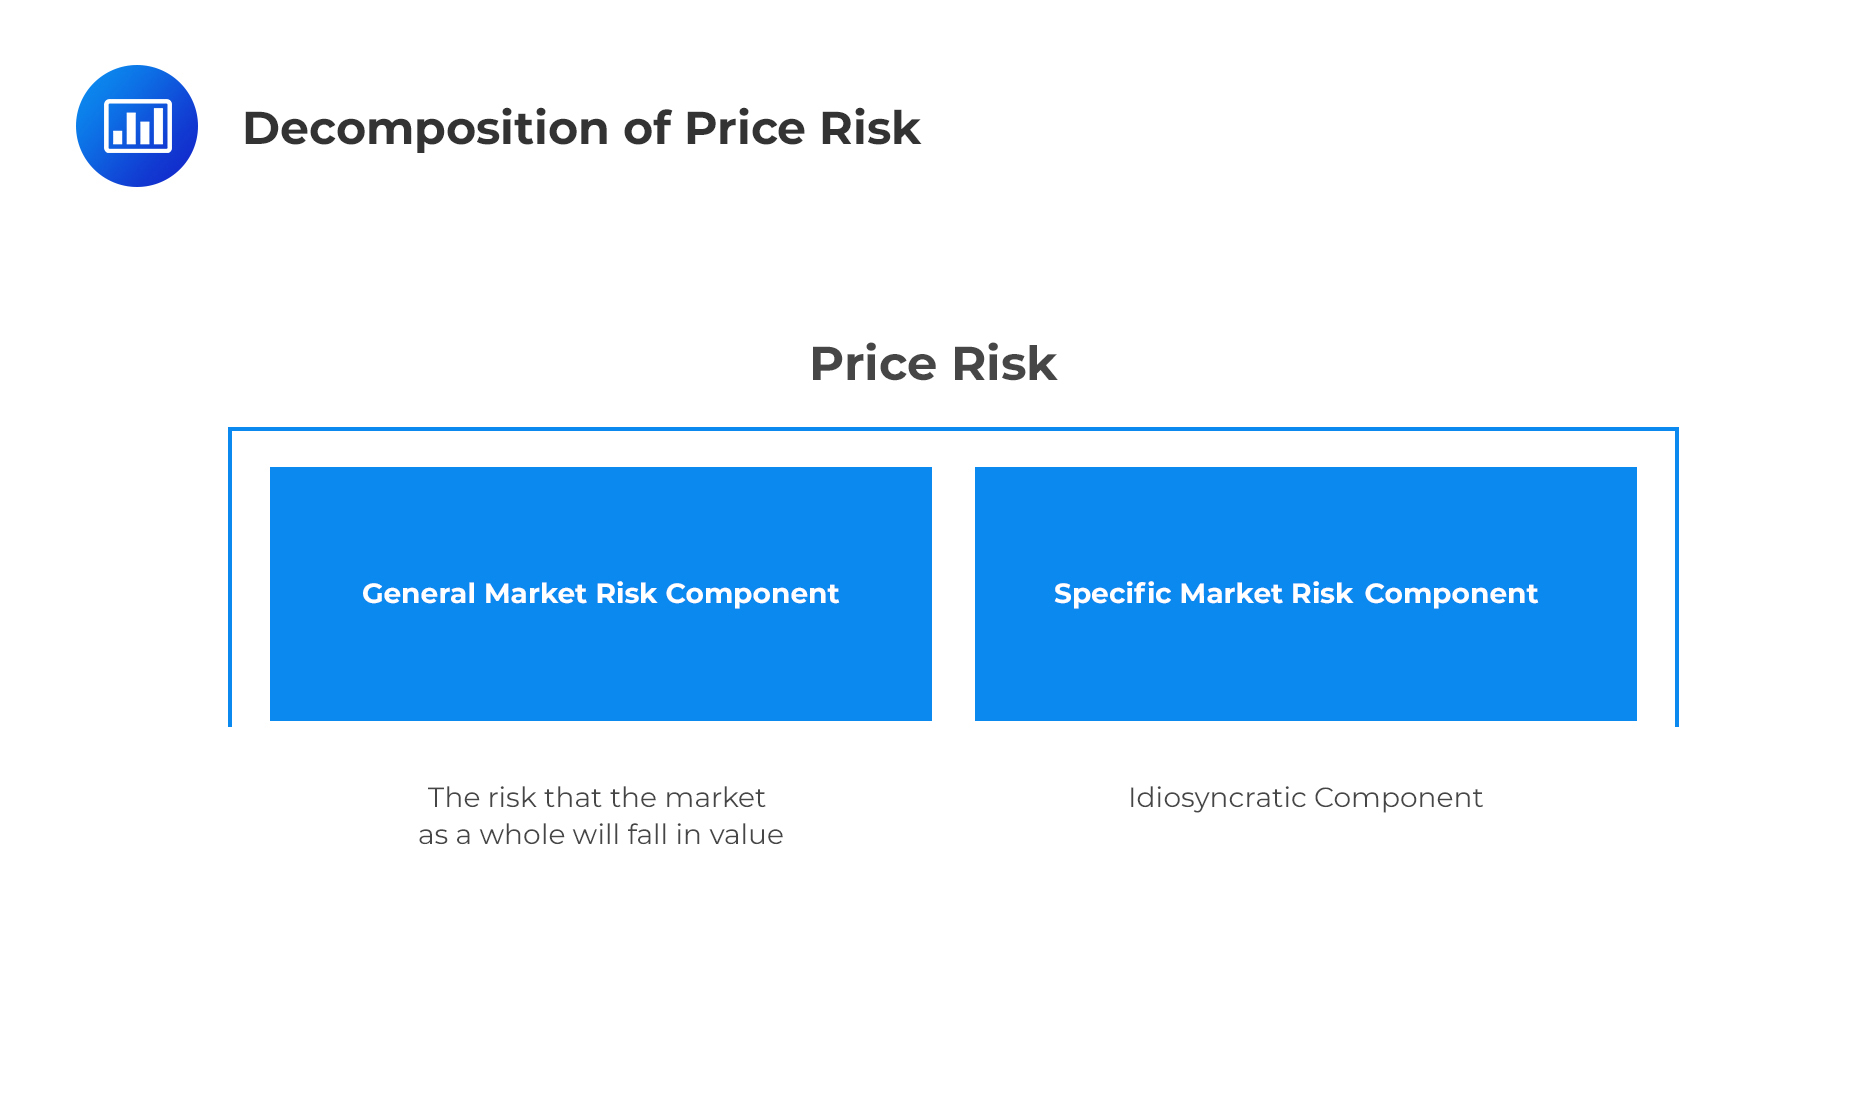
This is the risk associated with the potential reduction in the value of a portfolio or security due to changes in financial market prices and rates. Price risk can be decomposed into a general market risk component (the risk that the market as a whole will fall in value) and a specific market risk component (idiosyncratic component), unique to the particular financial transaction under consideration. In trading activities, a risk arises from open (unhedged) positions and imperfect correlations between market positions intended to offset one another.
 Market risk can be further classified into the following categories:
Interest Rate Risk – It arises from fluctuations in the market interest rates, which may cause a decline in the value of interest-rate-sensitive portfolios. For example, the bond market is affected by interest rates in the market. Curve risk can arise in portfolios in which long and short positions of different maturities are effectively hedged against a parallel shift in yields, but not against a change in the shape of the yield curve. If the rates of the positions are imperfectly correlated, basis risk may arise in offsetting positions having the same maturity.
Equity Price Risk – This is the risk associated with the volatility in the stock prices. The market risk component is the sensitivity of the equity or a portfolio to a change in the level of a market index. This risk cannot be done away with by diversification. The idiosyncratic or specific threat is the component of volatility determined by firm-specific characteristics like its management, production line, etc. This can be done away with by diversification.
Foreign Exchange Risk – Due to operations that involve foreign currencies, imperfectly hedged positions in certain currencies may arise, which may cause exposure to exchange rates. Major factors influencing foreign exchange risk are imperfect correlations in currency prices and fluctuating international interest rates.
The risk associated with a counterparty not fulfilling its contractual obligations is the credit risk. For example, the default on a credit card loan is the scenario in which credit risk materializes for a credit card company.
Credit risk can be further classified into:
Credit risk is a matter of concern only when the position is an asset and not a liability. If the position is an asset, then a default by the counterparty may cause a loss of the position’s total or partial value. The value that is likely to be recovered is called recovery value, while the amount that is expected to be lost is called loss given default.
At the portfolio level, the issues to be addressed are the following:
It comprises funding liquidity risk and market liquidity risk.
Funding liquidity risk is associated with the risk that a firm will not be able to settle its obligations immediately when they are due. It relates to raising funds to roll over debt and to meet margin calls and collateral requirements. Funding liquidity risk can be managed by holding highly liquid assets like cash.
Trading liquidity risk (also called market liquidity risk) is the risk associated with the inability of a firm to execute transactions at the prevailing market price, affecting the institution’s ability to hedge market risk and also its capacity to liquidate assets when necessary.
It refers to the risk that arises from operational weaknesses like management failure, faulty controls, and inadequate systems. Human factor risk is one of the essential operational risks, and it results from human errors like entering wrong parameter values and using wrong controls, among others. Technology risk arises from a computer system’s failure.
It arises from the uncertainties in demand, the cost of production, and the cost of delivery of products. Business risk is managed by framing appropriate marketing policies, inventory policies, choices of products, channels, suppliers, etc. Business risk is affected by the quality of a firm’s strategy and its reputation, too.
It is the risk associated with significant investments for which the uncertainty of success and profitability is high. It is related to the strategic change in the company’s policies to make it more competitive in the marketplace.
It comprises the belief that an enterprise can settle its obligations to counterparties and creditors and secondly, it follows ethical practices. Trust and fair dealing are two essential things that drive businesses. For example, reputation is of crucial importance in the financial industry.
Risks can flow from one type to another. For instance, during hard business times, the risk can flow from the credit risk to liquidity risk and then to market risk. This kind of flow was seen in the 2007- 2009 financial crisis.
Another example is where operational risk (as a form of lousy trading activity by the traders) flows to market risks by creating unfavorable market positions. Moreover, this can move to become a reputation risk to the concerned company.
Given below is the flow chart of the risk management process:
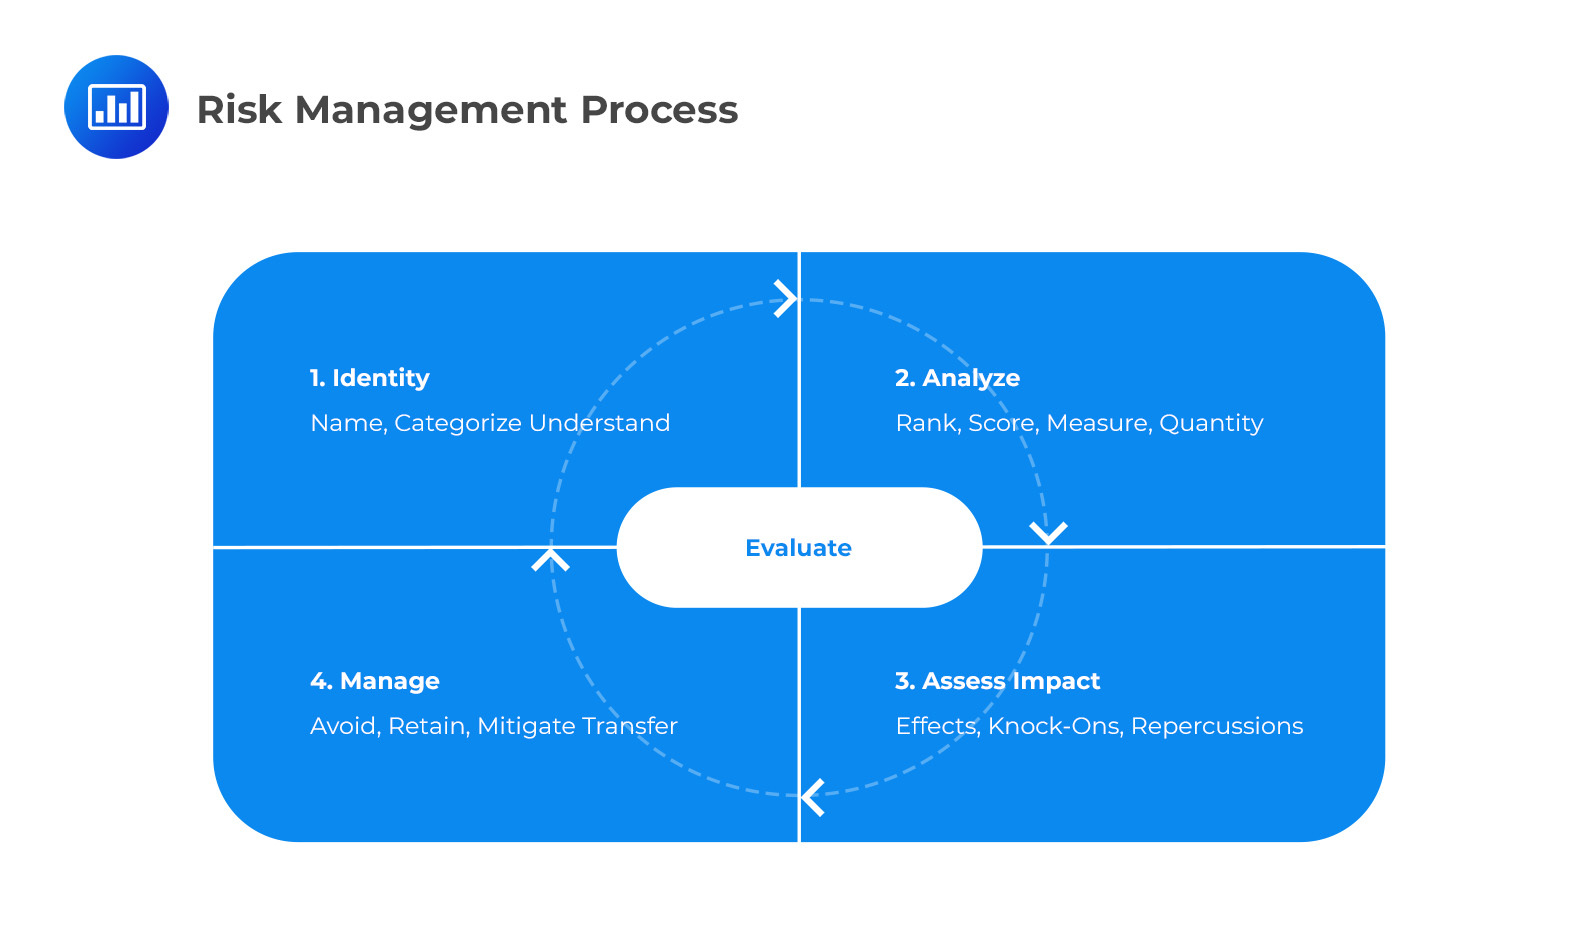
Risk management includes identifying the type and level of risk that is appropriate for the firm to assume, analyze, and measure the risk, and assess the possible outcomes of each risk. The final stage is the management of the risks.
According to Donald Rumsfeld (1921), risk managers should not concentrate on known risks only but also the unknown risks. He also classified the risks, as seen in the diagram below.
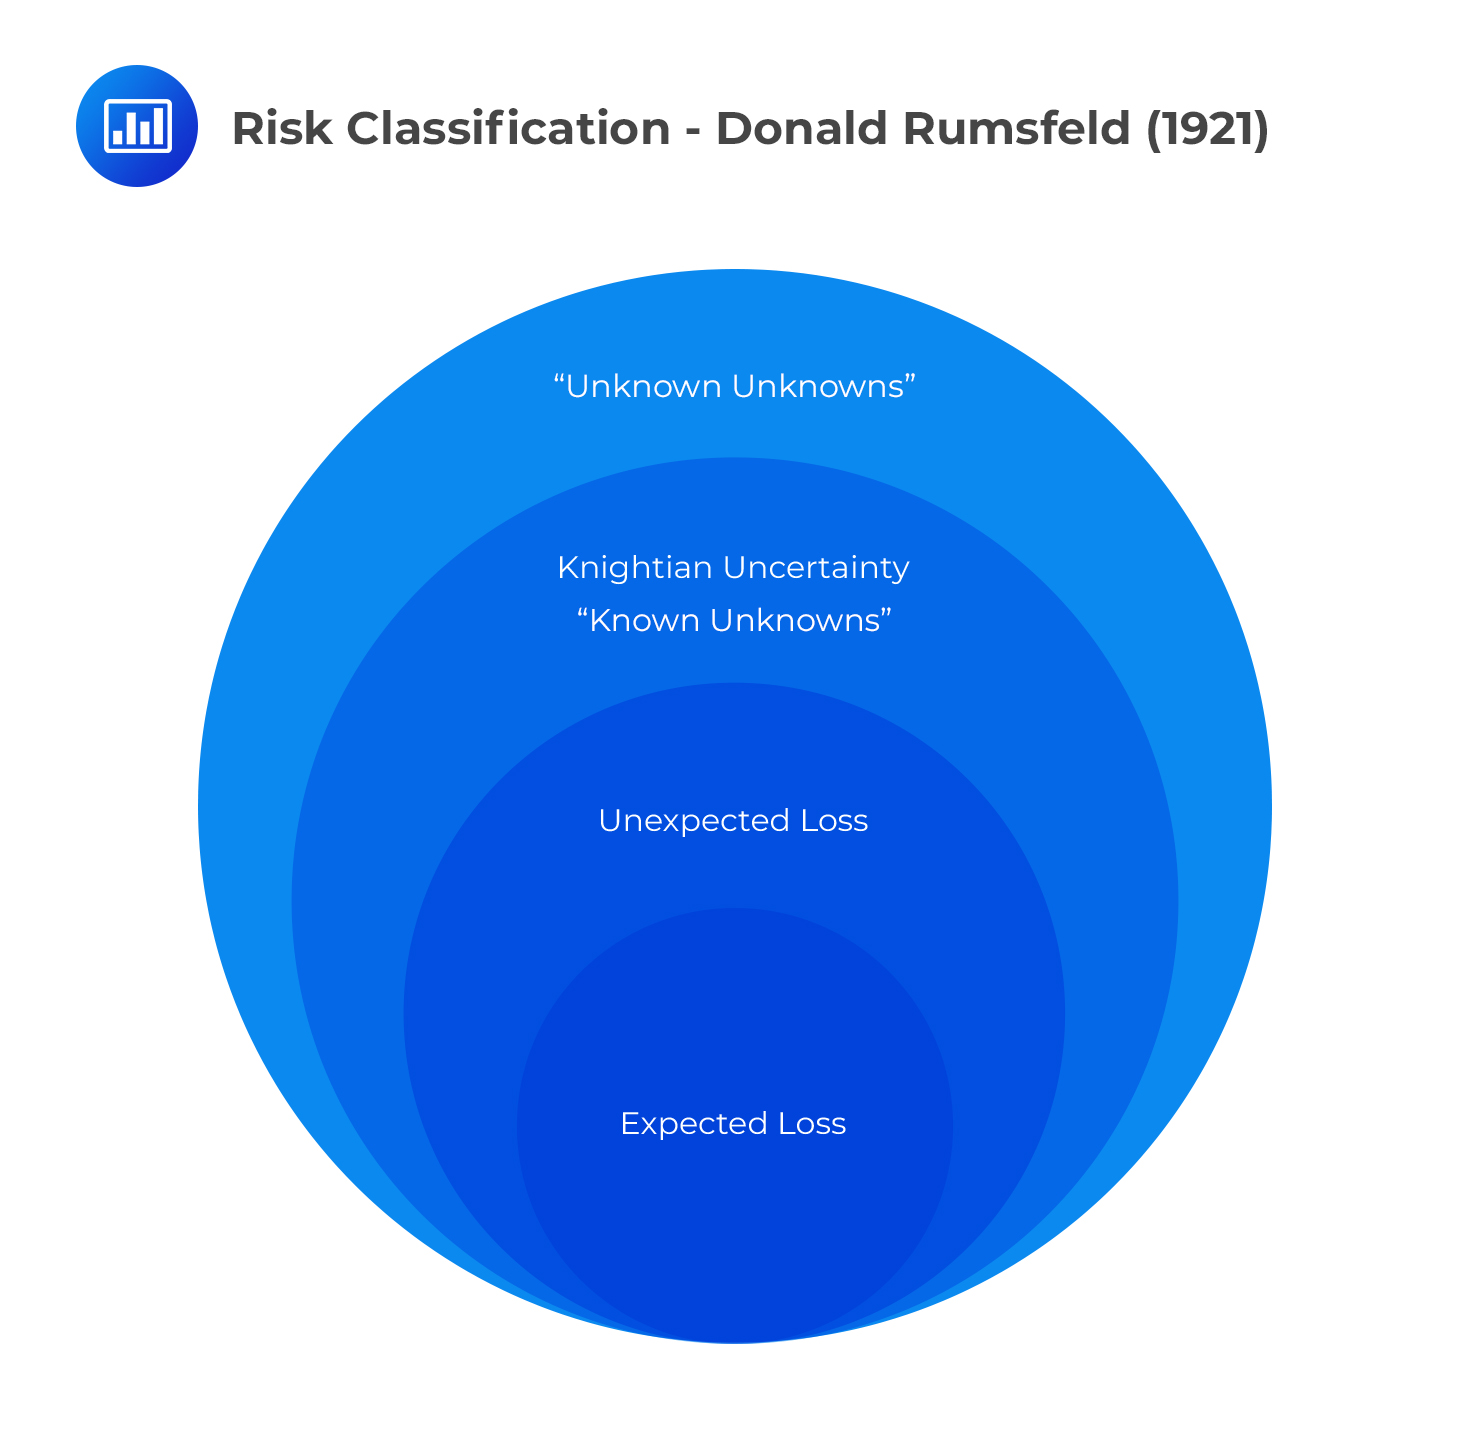 Unknown risks can be very significant and essential, even though their measurement may be difficult or outright impossible. However, unknown risks can be managed using the usual forms of risk management.
Rumsfeld’s classification implies that risk managers should focus not only on measurable risks but also on unknown risks. They should strive to unravel the “unknown unknowns,” which include threats that hide away.
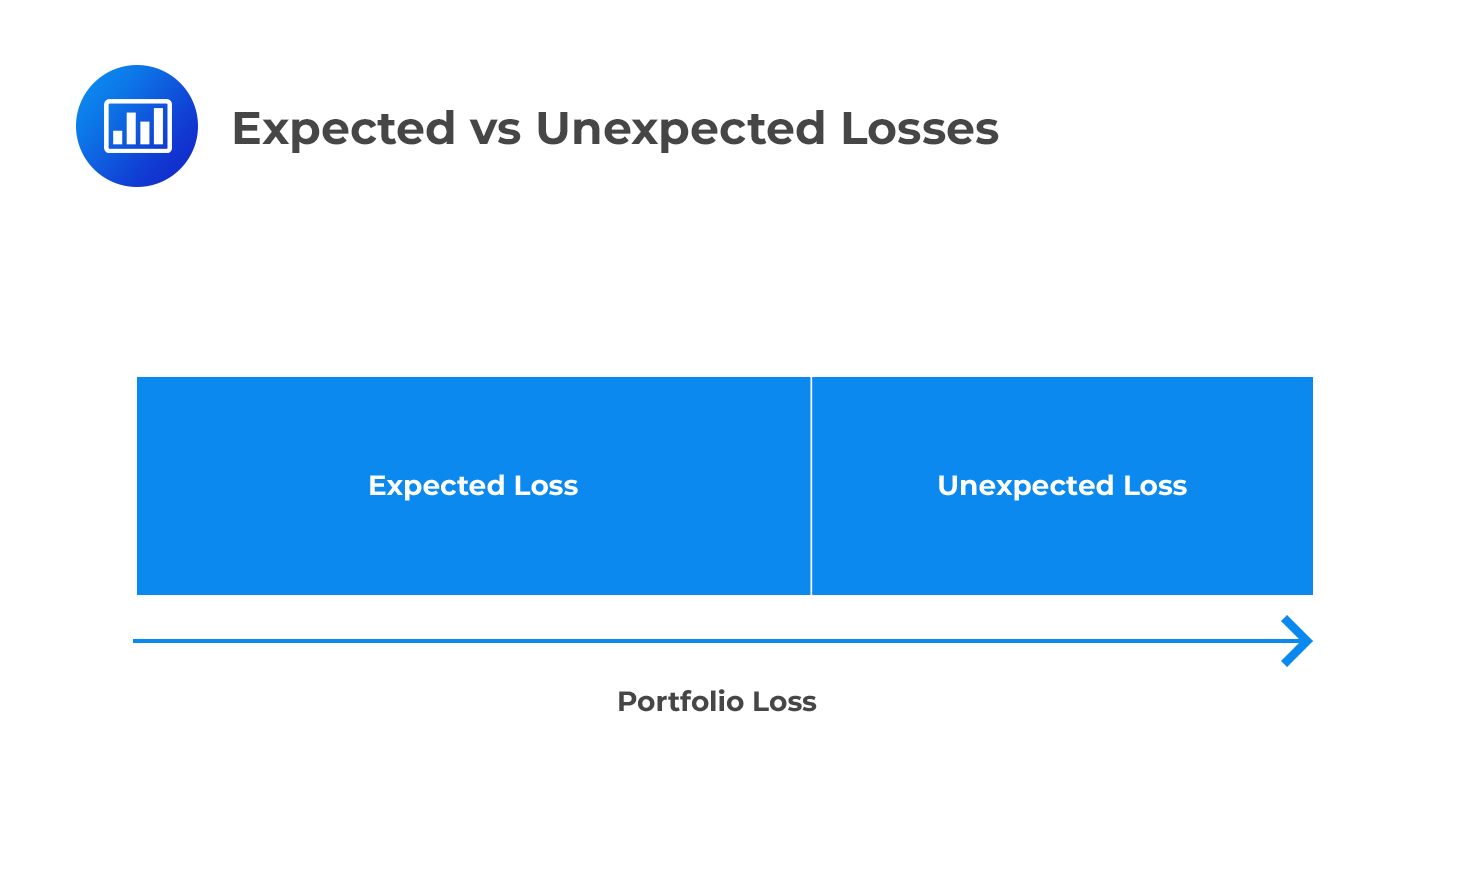
The expected loss can be defined as the mean loss an investor (position taker) might expect to experience from a portfolio. The expected risks are those that may be large in size, are predictable, and could be avoided with the risk management process.
Theoretically, portfolios usually bear a loss that is near to the average loss, which can be statistically measured with some degrees of freedom.
Expected loss can be calculated from the underlying risk factors. Such factors include:
Let us take an example of credit risk to the bank. Denote the probability of default by PD, the bank’s exposure at default by EAD, and the severity of loss given default by LGD. So, the EL is given by:
$$EL=EAD \times LGD \times PD$$
So, how does the bank’s manager make sure that they make a profit? The bank management should come up with a price that covers the expected loss. It is important to note that the computation of expected loss is based on assumptions.
The unexpected loss is the level at which the losses in a portfolio differ from the average loss. Unexpected risks due to unanticipated variability in the losses.
For instance, in a credit portfolio, an unexpected loss can be caused by a difference in the number and severity of the loans. That is, a large number of small loans are diversified, and hence we can estimate the expected loss. However, if the EL continuously changes due to macroeconomic factors, it leads to unexpected loss.
 In some cases, some portfolios (such as credit) can show extreme loss variance over some interval of time. In this case, the expected loss (EL) is calculated by averaging the loss from the long-run good years and the short-run bad years. However, in bad years, the losses can rise to an unexpected level and even to extreme levels. Consequently, the banks are forced to increase the risk capital and include an expected loss in pricing their products to guard themselves against huge unexpected losses, which can cause insolvency and defaults.
VaR is a statistical measure that defines a particular level of loss in terms of its chances of occurrence, i.e., the confidence level of the analysis. In other words, VaR utilizes loss distribution relative to a portfolio or a position to approximate losses at a given level of confidence.
For example, suppose a position in an option has a one-day VaR of $1 million at the 99% confidence level. In that case, the risk analysis will show that there is only a 1 percent probability of a loss that is greater than $1 million on any given trading day.
The VaR measure works under normal market conditions and only over a short period, such as one trading day. Potentially, it is a poor and misleading measure of risk in abnormal markets, over more extended periods, or for illiquid portfolios. VaR also depends upon the control environment. Trading controls can be circumvented. This usually happens when back-office staff, business line managers, and even risk managers do not have a proper understanding of the critical significance of routine tasks, such as an independent check on volatility estimates, for the integrity of key risk measures.
Despite the significant role VaR plays in risk management, it stops short of telling us the amount or magnitude of the actual loss in the tail. What it tells us is the maximum value we stand to lose for a given confidence level. This drawback can be overcome by a measure known as an expected shortfall.
Expected shortfall (ES) is the expected loss given that the portfolio return already lies below the pre-specified worst-case quantile return, e.g., below the 5th percentile return. Put differently, the expected shortfall is the mean percent loss among the returns found below the q-quantile. It helps answer the question: If we experience a catastrophic event, what is the expected loss in our financial position?
The expected shortfall (ES) provides an estimate of the tail loss by averaging the VaRs for increasing confidence levels in the tail. It is also called the expected tail loss (ETL) or the conditional VaR.
The risk managers must subdivide the risk into discrete risk factors so that each factor and the interactions between these factors can be studied. An excellent example is the credit risk, which we have studied earlier, where credit risk was divided into the probability of default (PD), bank’s exposure at default (EAD), and severity of loss given default (LGD).
However, there is an obvious challenge of how granular risk should be, given the loss of data. Dividing the data into very small sub-factors is impractical since it is time-consuming and tiresome. Secondly, analytical resources might be limited. Moreover, the data might be limited in terms of quantity, quality, or descriptive ability.
The solution to this challenge is the emergence of machine learning. In machine learning and substantial cloud-based calculation, power can help in isolating risk granules into smaller details.
Tail risks are those that rarely occur. They can be explained as the extreme version of unexpected loss that is hard to find in the given data. They are usually revealed in time series data over long periods. The tail risk can be detected using statistical methods such as the Extreme Value Theory (EVT).
When the structure of a financial system changes, the risks increase. That is, events associated with large losses may increase as well as risk factor levels. Unless the structural problem is fixed or proper risk management is adopted, new losses relative to a risk type might occur, which changes the amount of tail risk, expected and unexpected losses.
Financial systems are run by intelligent human beings who can adapt to change in a personal and cunning manner. That is, those who are more experienced in risk management can play up their game by hiding their risk analysis from other participants for their own gain.
Having said this, many financial firms have employed three ways to control human agency and conflicts of interest:
These defense mechanisms do not always work due to industry innovations, which sometimes leave loopholes in the risk management sector. Moreover, sometimes traders and the industry leadership willingly alter the credibility of the risk management systems. That is why grasping the role of human agency, self-interest, and conflicts of interest is one of the cornerstones of risk management.
The risk manager should be able to identify the riskiest businesses and determine the aggregate risks of a firm. For instance, market risks are easily quantified and controlled by comparing the notional amount in each asset held. This, most of the time, is impractical since different stocks and industries have different volatilities.
Since the mushrooming of derivative markets in the 1970s, the measurement of market risk has become relatively achievable. This is because the value and the risk of the derivatives depend on the price of the underlying portfolio.
Derivative traders developed risk measures referred to as the Greeks. They include delta and theta. Greeks are still used up to date, but they cannot be added up, rendering them limited at the enterprise level.
Another measure of risk is VaR. VaR was a useful aggregation method up to the year before the crisis, but it involves too many assumptions. However, VaR is marred with shortcomings, but it remains essential to ask managers.
The disadvantages of these aggregate risk measurements have motivated the managers to come up with total risk measures to replace the traditional measures but, most of the time, fail to include critical dimensions of the risk and must be supplemented with other methods. Conclusively, understanding how risks are aggregated and the drawbacks and advantages that come with them, is an essential risk management building block.
Normally, the assumption of higher systematic risk is associated with higher returns from portfolios. However, the demanded returns from risky assets may not be apparent unless the asset’s market is efficient and transparent. For example, the bond prices, solely, may not imply the return demanded, taking additional risks. This can be the case because of liquidity and tax effects. A key objective of risk management is to make transparent potential risks for the firm and identify activities that may be detrimental to the firm in the long term.
For instance, a bank can include the cost of both the expected and unexpected costs by using the following formula for risk-adjusted return on capital (RAROC):
$$RAROC= \frac{\text{Reward}}{\text{Risk}}$$
Note the Reward can be After-Tax Risk-Adjusted Expected return, and the risk is described as the economic capital so that:
$$RAROC= \frac{\text{After-Tax Risk-Adjusted Expected return} }{\text{Economic capital}}$$
If the RAROC is higher than the cost of equity capital, then the portfolio is valuable to the investor. The cost of equity capital is the minimum return on equity capital required by the shareholders to compensate for the risk.
Apart from the banking industry, RAROC is applied across different industries and institutions, with the formula varying accordingly (but its purpose remains constant).
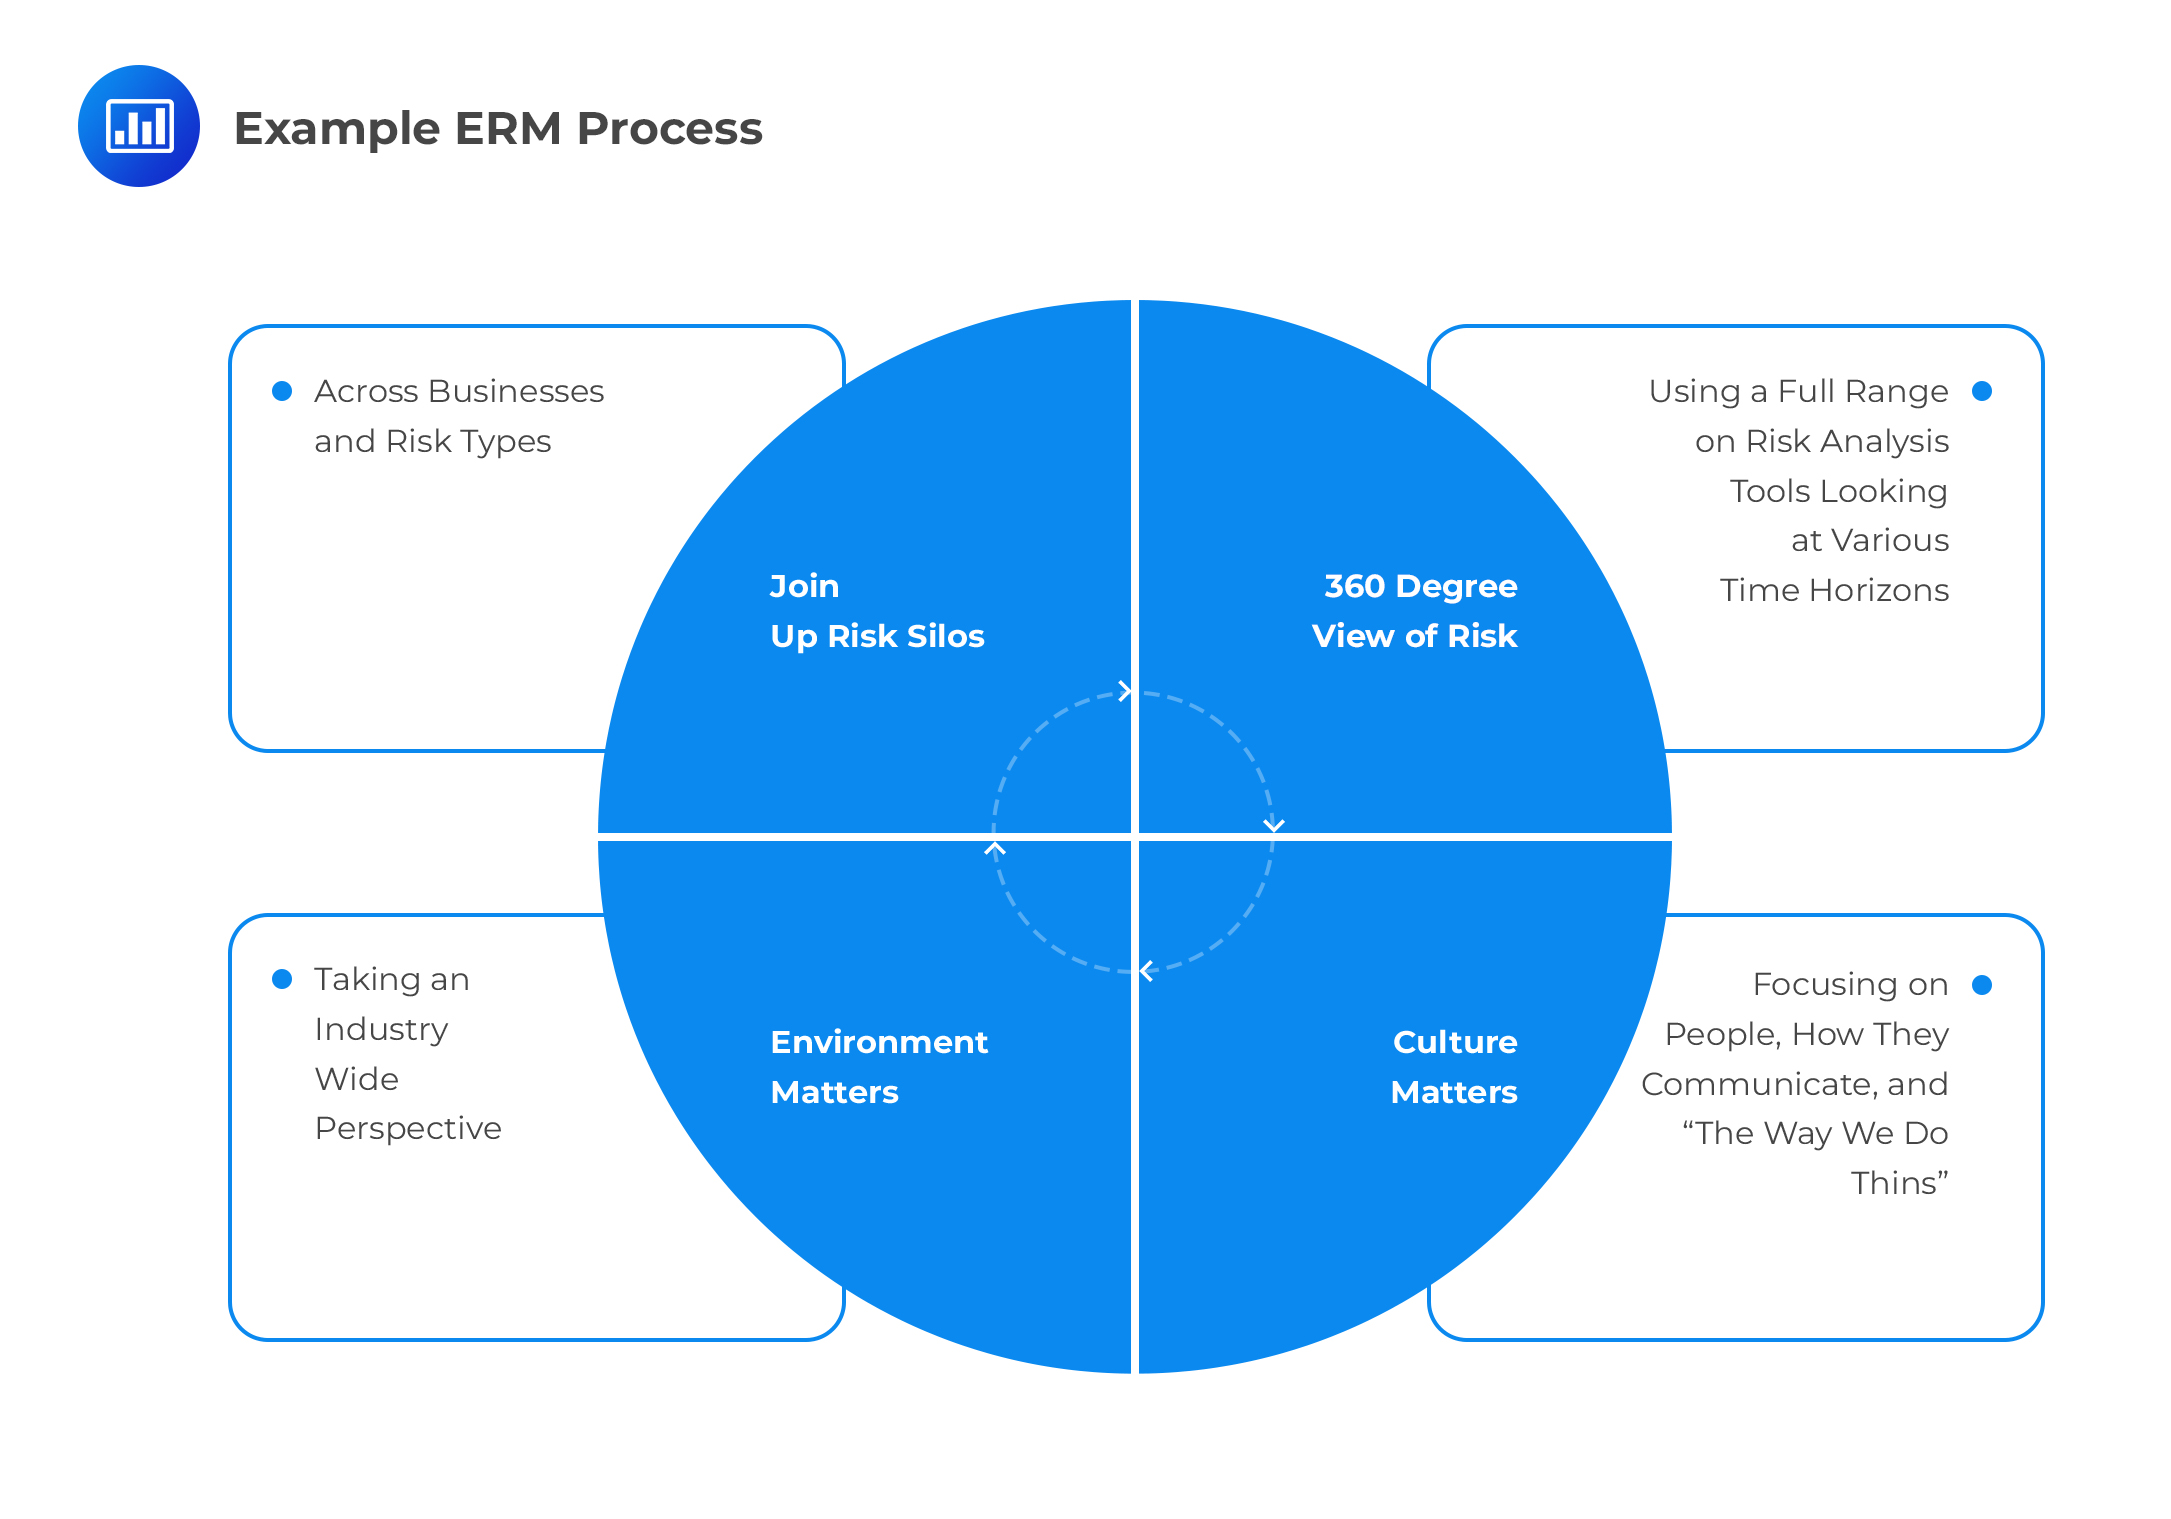
Enterprise management risk (ERM) is the process of planning, organizing, leading, and controlling the activities of an organization in order to minimize the effects of risk on an organization’s capital and earnings as a whole. ERM overcomes the challenge of “siloed” risk management, where each unit of an institution manages its own risk independently.
Since the financial crisis of 2007-2009, risk cannot be represented by a single number but rather:
More clearly, firms need to adopt a 360-degree view of risk by using different tools and appropriate levels of curiosity. Thus, ERM is not only about aggregating the risk across the risk types and business lines but also taking a comprehensive risk management process while taking into consideration the strategic decisions of a business. A simplified ERM is shown below:
Question
Which of the following statements correctly describes the relationship between expected loss (EL) and unexpected loss (UL)?
A. EL and UL are synonymous and both represent the average loss that can be expected in a given time frame.
B. EL represents the loss that is most likely to occur, while UL represents the standard deviation of the loss distribution.
C. EL represents the loss due to the default probability and exposure amount, while UL represents the loss due to changes in credit ratings.
D. EL is calculated based on historical averages, while UL is calculated based on an analysis of the worst-case scenarios.
Solution
The correct answer is B.
In the context of the given scenario, Expected Loss (EL) represents the loss that is most likely to occur based on historical data and analysis. It is a predictable and anticipated cost. Unexpected Loss (UL), on the other hand, represents the potential deviation from the expected loss that could occur due to unforeseen events or changes in market conditions. Essentially, UL represents the standard deviation of the loss distribution.
A is incorrect because EL and UL are not synonymous. EL represents the anticipated loss based on historical data, while UL represents the potential deviation from this expected loss.
C is incorrect because UL does not specifically represent the loss due to changes in credit ratings. It represents the potential deviation from the EL that could occur due to various unforeseen events or changes in market conditions.
D is incorrect because UL is not calculated solely based on an analysis of the worst-case scenarios. It represents the standard deviation of the loss distribution, which includes potential deviations in both directions from the expected loss.
Things to Remember
- Expected Loss (EL) is a calculable amount representing what an entity expects to lose in normal business operations, often calculated as EL = EAD × PD × LGD.
- EL calculations consider factors like the probability of risk, exposure to risk, and severity of loss if the risk event occurs.
- In retail and banking contexts, EL can be modeled and priced into costs, such as bad debt expense, or addressed by charging higher spreads for riskier borrowers.
- Unexpected Loss (UL) reflects potential losses exceeding average expected scenarios, posing challenges in prediction due to their unexpected nature.
- Correlation risk, such as simultaneous occurrence of default rate risk and recovery rate risk, can drive losses to unexpected levels, demonstrating the complexity of modeling UL.
- EL can be treated as a predictable expense or variable cost when modeled with confidence.
Offered by AnalystPrep


Get Ahead on Your Study Prep This Cyber Monday! Save 35% on all CFA® and FRM® Unlimited Packages. Use code CYBERMONDAY at checkout. Offer ends Dec 1st.