


Modeling and Hedging Non-Parallel Term ...
After completing this reading you should be able to: Describe principal components analysis... Read More

After completing this reading, you should be able to:
An insurance contract is an agreement between an insurer and a policyholder, where the latter receives protection against adverse events in exchange for premiums. Insurance takes two main forms: Life assurance and nonlife (property) insurance. (Since we cannot put a price/value tag on human life, the word “insurance” is replaced with assurance). Property insurance is renewed yearly, and the premiums payable may vary from year to year.
A term life assurance contract is a contract to pay the beneficiary a predetermined amount of benefit, also called the sum assured, in case the policyholder dies within the term of the contract. For example, if the contract starts today and remains in force for the next 10 years, the sum assured will only be payable if the policyholder dies within the next 10-year period. If the policyholder survives to the end of the term, the contract comes to an end without any form of compensation.
Under a whole life contract, the sum assured is payable when the policyholder dies, regardless of when that happens. It provides protection for the life of the policyholder. Premiums are paid throughout the life of the policyholder. Unlike in a term life contract (where there’s no certainty that the sum assured will be paid), the sum assured is certain to be paid at some point in the future, provided the policyholder continues to make the required premium payments up to the point of their death.
A variable life assurance policy is a type of whole life assurance with an investment component. A portion of the premium payable is invested in several sub-accounts available in the policy. For example, let’s say John buys a variable life assurance policy where he pays an annual premium amounting to $10,000. The contract could be designed in such a way that $5,000 goes toward the sum assured (death benefit), say, $1 million, and the other $5,000 is invested in various instruments. Thus, the total benefit received on the death of the policyholder will be the sum assured plus a variable amount generated from the investment account.
Just like variable life assurance, a universal life contract is a type of whole life assurance with an investment component. However, a universal contract gives the policyholder a lot more flexibility in terms of the premium payable. The premium can even be reduced to a pre-specified minimum without the policy lapsing. Lapsing occurs when a policyholder quits paying premiums resulting in the withdrawal of the policy. Reducing premiums will, however, reduce the expected benefits.
This contract incorporates the benefits of both universal and variable life assurance.
Under an endowment contract, the sum assured is payable either when the policyholder dies or at the end of the specified period, whichever comes first. There are many variants of endowment life contracts in the market today. Some may even have an investment component. Others may precondition payment of the sum assured on the survival of the policyholder to the end of the period.
A group life assurance contract covers multiple persons, usually employees in a company. The policy could be contributory, in which case the premium payable is shared between the employer and the employee. In other cases, it could be non-contributory, meaning that the employee is obliged to pay the full premium amount.
An annuity is a contract that requires the policyholder to pay a lump sum. In return, the policyholder receives a regular series of payments at specified points in the future. This regular stream of payments is called an annuity. The annuity starts at a particular date and lasts for the rest of the policyholder’s life. The annuity could start immediately after the lump sum has been paid. In other cases, it could start, say, 5 years after payment of the lump sum. Such a contract is called a deferred annuity. The insurance company funds the annuity by investing the lump sum in an investment vehicle of their choice, including secured bonds and mutual funds. An annuity helps the policyholder to defer the tax payable until they receive each scheduled annuity payment. The amount to which a policy holder’s funds grow in an annuity contract is called the accumulation value.
Funds to be invested are provided by life insurance policies and annuity contracts. The funds are mostly invested in bonds. Sometimes the maturity of the bonds can be made to match the maturity of the liabilities. Companies will prefer government bonds to corporate bonds to avoid credit risk, but the return on corporate bonds is usually higher.
For each age, a mortality table gives the probability of a person at that age dying before their next birthday. In other words, it gives the survivorship of people from a given population. The mortality rate among men is different (and usually higher) from that of women. Thus, mortality tables are constructed separately for men and women.
Insurance companies use mortality tables to price insurance products, assess pension plan obligations, and project future insured events. Here is some important information on how to read a mortality table:
The following is an extract from the mortality table developed by the U.S. Department of Social Security for 2015.
$$\text{Period Life Table, 2015} $$
$$\small{
\begin{array}{c|c|c|c|c|c|c}
{} & {} &\textbf{Male} & {} & {} &\textbf{Female} & {} \\ \hline
\textbf{Exact age} &\textbf{Probability of} &\textbf{Male number} &\textbf{Life} &\textbf{Probability} &\textbf{Female} &\textbf{Life} \\
{} &\textbf{death within} &\textbf{of lives} &\textbf{expectancy} &\textbf{of death} &\textbf{number of} &\textbf{expectancy} \\
{} &\textbf{1 year} & {} & {} &\textbf{within 1} &\textbf{lives} & {} \\
{} & {} & {} & {} &\textbf{year} & {} & {} \\ \hline
0 & 0.006383 & 100,000 & 76.15 & 0.005374 & 100,000 & 80.97 \\ \hline
1 & 0.000453 & 99,362 & 75.63 & 0.000353 & 99,463 & 80.41 \\ \hline
2 & 0.000282 & 99,317 & 74.67 & 0.000231 & 99,427 & 79.44 \\ \hline
3 & 0.000230 & 99,289 & 73.69 & 0.000165 & 99,405 & 78.45 \\ \hline
4 & 0.000169 & 99,266 & 72.71 & 0.000129 & 99,388 & 77.47 \\ \hline
5 & 0.000155 & 99,249 & 71.72 & 0.000116 & 99,375 & 76.48 \\ \hline
\dots & \dots & \dots & \dots & \dots & \dots & \dots \\ \hline
30 & 0.001626 & 97,393 & 47.75 & 0.000740 & 98,588 & 51.95 \\ \hline
31 & 0.001669 & 97,235 & 46.82 & 0.000792 & 98,515 & 50.99 \\ \hline
32 & 0.001712 & 97,072 & 45.90 & 0.000841 & 98,437 & 50.03 \\ \hline
33 & 0.001755 & 96,906 & 44.98 & 0.000886 & 98,354 & 49.07 \\ \hline
34 & 0.001800 & 96,736 & 44.06 & 0.000929 & 98,267 & 48.11 \\ \hline
35 & 0.001855 & 96,562 & 43.14 & 0.000977 & 98,175 & 47.16 \\
\end{array}}
$$
Source: https://www.ssa.gov/OACT/STATS/table4c6.html
Consider the row corresponding to age 3. The second column gives the probability of a male aged exactly 3 dying within the next year (0.000230). The third column gives the number of male lives out of a cohort of 100,000 lives that attain age 3 (99,289). Finally, the fourth column shows that a male aged 3 has a remaining life expectancy of 73.69 years. When interpreted, that means on average, 3-year-old males will live to age \(76.69\left( =73.69+3 \right) \).
We can interpret the rest of the data in a similar manner.
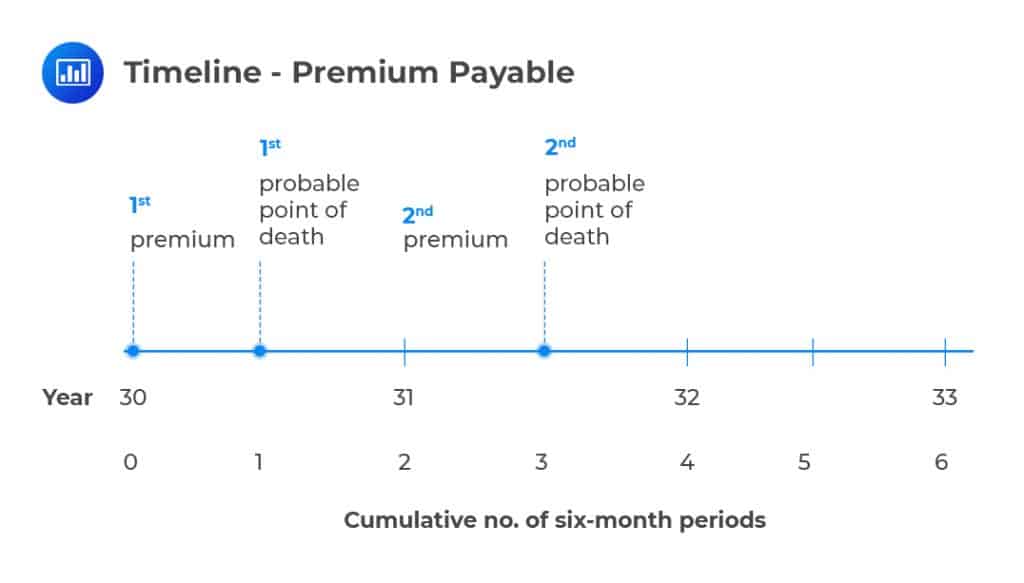
Robert Myer, aged 30, buys a 2-year term assurance contract with a sum assured of $100,000. Interest rates for all maturities are 6% per annum (with semiannual compounding), and premiums are paid annually in advance (at the beginning of the year). Calculate the break-even premium.
The present value of income (premiums payable) = present value of outgo (expected payouts) …………………. Equation 1
Working out the left side of equation 1,
Let the annual premium payable be \(X\). Since the first premium is paid immediately after the contract is signed, its present value is \(X\). The probability of the second premium payment being made at the beginning of the second year is the probability that the man does not die during the first year \(\left( = 1 – 0.001626 \right) \).
Hence,
$$\text{PV of income}=X+\frac { 0.998374X }{ { 1.03 }^{ 1 \times2} } =1.94106X $$
Working out the right side of equation 1,
The expected payout if Robert dies in the first year is \($162.60\left( =0.001626\times $100,000 \right) \). The expected payout if Robert dies in the second year is \($166.63\left[ =\left( 1–0.001626 \right) \times 0.001669\times $100,000 \right] \). We must discount these to time \(0\). In most cases, the assumption is that death occurs midway through the year, and the benefit is payable immediately on death. Thus, we discount the first expected payout for 6 months and the expected payout in year 2 for 18 months.
 Hence,
$$\text{PV of outgo}=\frac { 162.6 }{ 1.03^{0.5\times 2} } +\frac { 166.63 }{ { 1.03 }^{ 1.5\times 2 } } =$310.35 $$
Thus,
$$ 1.94106X=310.35 $$
$$ X=$159.89 $$
Property insurance provides protection against damage to property, while casualty insurance provides coverage for liabilities arising from damages incurred by others arising from the actions of the insured party.
Property and casualty insurance allows an insurer to increase premiums if the risk of the insured event increases.
The risks faced by a property and casualty insurance company include:
To insure against catastrophic risks, an insurance company may either reinsure itself or use CAT (Catastrophe) Bonds derivatives. CAT bonds are issued by insurance companies and pay a high interest rate.
Assume that two drivers, drivers A and B, have been placed in one risk category and given the same expected payout. It is highly unlikely that both drivers will make a claim arising from a road accident. Driver A’s claim may be due to a road accident, while driver B’s claim may be due to a different risk, say car burglary. These two drivers will receive
different settlements despite being placed in the same risk category, with similar expected payouts.
The loss ratio is the ratio of payouts made to premiums earned in a year. A ratio of 50% means that for every $1 of the premium received, there’s a payout of $0.50. The remaining $0.50 consists of profits and any other expenses. A high loss ratio indicates poor financial health. It implies that the insurer may not be collecting enough premiums to pay claims, expenses and still make a sizeable profit.
The expense ratio is the ratio of expenses to premiums earned in a year. It shows how efficient the insurer is in terms of cash management before factoring in claims and investment gains or losses. Expenses comprise ad fees, employee wages, commissions for sales agents, etc.
The combined ratio is the sum of the loss ratio and the expense ratio. For example, if the loss ratio is 75% and the expense ratio is 40%, the combined ratio is 115%. Suppose an insurer has a combined ratio of more than 100%. What does this imply? It means the insurer has had more losses plus expenses than earned premiums, i.e., it has lost money on its operations. But if the combined ratio is less than 100, it implies the insurer is profitable,i.e., it has more earned premiums than losses plus expenses.
A combined ratio after Dividends consists of the combined ratio and any dividends paid to the shareholders. Assuming dividends of 2% are paid in the above scenario, then the gross ratio will be 117%.
The presence of interests reduces the gross ratio to form the operating ratio. Suppose an interest of 5% was earned in the above scenario; the operating ratio would then be 112% (117%-5%).
In health insurance, premiums should only increase due to an increase in the cost of health and not due to increased risks to the policyholder that were absent at the onset of the policy.
Moral hazard describes the risk that once individuals sign up for an insurance contract, they will behave differently than they would without the insurance. In other words, they will have an incentive to take risks they would otherwise not dare take. For example, in the presence of deposit insurance, banks will have an incentive to take more risks because the risk of losing customers is minimal.
The moral hazard increases the expected payout of the insurer. Some of the strategies adopted to mitigate moral hazard include:
Adverse selection is the risk that a company may attract bad risks more than it attracts good risks. If the insurer sells a product at the same price to everyone, it might inadvertently attract more of the bad risks. For example, if smokers and non-smokers are charged the same premium for a whole life policy, the insurer will most likely attract more smokers.
Just like moral hazard, adverse selection increases the chances of claims overwhelming the insurer, something that can lead to insolvency.
The best way to mitigate the risk of adverse selection has much to do with making sure that the insurer gathers as much information about prospective policyholders as possible. That way, they will be more likely to unearth certain facts that will help them to price the policy appropriately. For example, insurers are normally very keen to dig into the health history of all prospective whole life policyholders. If the individual has a hereditary condition, for example, the premium payable will have to be adjusted upwards accordingly.
The mortality risk is the risk that people may die sooner than predicted. Mortality risk will negatively affect whole life policies as fewer premiums than anticipated will have been paid at the time of death. This has the potential to negatively impact insurance payouts because there will be more deaths than initially anticipated. On the other hand, increased mortality risk increases the profitability of annuity contracts because the policyholders end up receiving fewer scheduled payments than initially anticipated (most annuities lapse once the policyholder dies).
Longevity risk is the risk that a person will live longer than initially expected. Thanks to the rapid advancement in medical science and improved lifestyle among people. Increased longevity risk adversely affects annuity contracts because the sponsor ends up parting with more payments than initially anticipated. However, increased longevity will improve the profitability of life insurance contracts because the insureds will end up paying more and more premiums. (bear in mind that the benefit remains fixed all through).
Insurance companies hedge mortality risk through a combination of careful pricing and reinsurance, where they share the pooled risks with a third-party insurer. Longevity risk can be hedged using longevity derivatives. A typical derivative here is the longevity bond. Under this bond, a population is defined. The coupon payable as of a particular date is a function of the number of people still alive at that point.
In readiness for claims, insurance companies set aside funds generated from the premiums paid as well as from various investments. These funds are known as reserves.
The number one risk facing insurers is the risk that policy reserves are not sufficient to cover the forwarded claims. To mitigate this risk, actuaries tend to be fairly conservative when calculating the reserves needed.
Insurers also have to contend with the risk that their investments will perform poorly. Since most of such investments are in corporate bonds, an increase in default rates spells doom for insurers. This risk can be mitigated by diversifying investments over a range of industries or sectors in an economy.
Also, insurers are constantly faced with liquidity risks. Bonds can be quite illiquid, especially those offered via private placement. It may be impossible to quickly convert such bonds into cash in the face of an upsurge in claims.
Lastly, insurance companies face credit risk thanks to their transactions with banks and reinsurance companies.
In a defined benefit plan, the amount paid to the employee at retirement is specified by the plan. In addition, it’s the employer who sponsors the plan in its entirety. Typically, the benefit payable is a function of the years the employee has worked and their salary.
For example, the benefit may be equal to the average earnings of the employee in the final three years of employment multiplied by the number of years worked. The employee has little control over the funds until they are received at retirement. The employer bears investment risk – they have to ensure that there are sufficient funds to pay the employee at retirement.
In a defined contribution plan, both the employee and the employer contribute toward the plan, and the total amount is invested in a range of stable, secure investments, usually mutual funds and money market funds. The amount paid to the employee at retirement depends on the performance of the investment.
The amount to which the invested funds have grown can even be converted into an annuity. Since the employer has little control over the funds’ performance, defined contributions are considered low-risk to the employer.
In a defined benefit plan, all funds are pooled by the employer. Payments to retirees are made from the pool. In a defined contribution plan, however, each employee has their own account, and the pension payable is determined by the performance of that account.
Unlike banks, insurance companies have no global regulatory requirements. However, the European Union implemented Solvency 11 as its regulatory framework. It specifies a minimum capital requirement (MCR) and a solvency capital requirement (SCR). Capital should not fall below SCR. If capital falls below MCR, the insurance company may not be allowed to take up a new business, and its policies may be transferred to a different Insurance Company. Capital is calculated using both standardized and internal models.
In the United States, every state has its own regulators. However, the National Association of Insurance Commissioners provides a forum for insurance regulators to exchange ideas.
In contrast to the deposit insurance system for banks, there are no guaranteed funds to protect policyholders. If an insurance company becomes insolvent, other companies contribute to the fund.
Questions
Question 1
The following is an extract from the mortality table developed by the U.S. Department of Social Security for 2015.
$$ \text{Period Life Table, 2015} $$
$$\small{\begin{array}{c|c|c|c|c|c|c}
{} & {} &\textbf{Male} & {} & {} &\textbf{Female} & {} \\ \hline
\textbf{Exact age} &\textbf{Probability of} &\textbf{Male number} &\textbf{Life} &\textbf{Probability} &\textbf{Female} &\textbf{Life} \\
{} &\textbf{death within} &\textbf{of lives} &\textbf{expectancy} &\textbf{of death} &\textbf{number of} &\textbf{expectancy} \\
{} &\textbf{1 year} & {} & {} &\textbf{within 1} &\textbf{lives} & {} \\
{} & {} & {} & {} &\textbf{year} & {} & {} \\ \hline
30 & 0.001626 & 97,393 & 47.75 & 0.000740 & 98,588 & 51.95 \\ \hline
31 & 0.001669 & 97,235 & 46.82 & 0.000792 & 98,515 & 50.99 \\ \hline
32 & 0.001712 & 97,072 & 45.90 & 0.000841 & 98,437 & 50.03 \\ \hline
33 & 0.001755 & 96,906 & 44.98 & 0.000886 & 98,354 & 49.07 \\ \hline
34 & 0.001800 & 96,736 & 44.06 & 0.000929 & 98,267 & 48.11 \\ \hline
35 & 0.001855 & 96,562 & 43.14 & 0.000977 & 98,175 & 47.16 \\
\end{array}}$$Chris Huckabee, aged 33, buys a 2-year term assurance contract with a sum assured of $1,000,000. Interest rates for all maturities are 4% per annum (with semiannual compounding), and premiums are paid annually in advance (at the beginning of the year). The break-even premium is closest to:
- $1,742
- $3,400
- $1,650
- $1,755
The correct answer is A
Present value of income = present value of outgo …………………. Equation 1
Working out the left side of equation 1,
Let the annual premium payable be \(X\). Since the first premium is paid immediately the contract is signed, its present value is still \(X\). The probability of the second premium payment being made at the beginning of the second year is the probability that the man does not die during the first year \(\left( = 1 – 0.001755 \right) \).
Hence,
$$\text{PV of income}=X+\frac { 0.99825X }{ { 1.02 }^{ 2 } } =1.95949X $$
Working out the right side of equation 1,
The expected payout if the policyholder dies in the first year is: \($1,755\left( =0.001755\times $1,000,000 \right) \). The expected payout if they die in the second year is \($1,796.84\left[ =\left( 1–0.001755 \right) \times 0.0018\times $1,000,000 \right] \). We must discount these to time \(0\). Assuming that death occurs midway through the year, and the benefit is payable immediately on death, we should discount the first expected payout for 6 months and the expected payout in year 2 for 18 months.
Hence,
$$\text{PV of outgo}=\frac { 1,755 }{ 1.02 } +\frac { 1,796.84 }{ { 1.02 }^{ 3 } } =$3,413.80 $$
Thus,
$$ \begin{align*} 1.95949X&=3,413.80 \\ X&=$1,742.19 \\ \end{align*} $$
Question 2
Smart Insurance, a U.K. based casualty insurance firm, posted the following summary of selected key ratios:
$$
\begin{array}{l|c}
\text{Loss ratio} & 65\% \\ \hline
\text{Expense ratio} & 30\% \\ \hline
\text{Combined ratio} & C \\ \hline
\text{Dividends} & X \\ \hline
\text{Combined ratio after dividends} & Y \\ \hline
\text{Investment income} & Z \\ \hline
\text{Operating ratio} & O \\
\end{array}
$$C, X, Y, Z, and O are hidden values.
Which of the following statements is most likely INCORRECT?
- The expense ratio of 30% excludes losses from the sale of assets such as shares and bonds
- For each $1 in premium perceived, Smart Insurance pays out about $0.95 to its policyholders
- The combined ratio after dividends is equivalent to \(\left( C + X \right) \)
- The expense ratio of 30% includes advertising fees and commission paid to sales managers
The correct answer is B.
The loss ratio is the ratio of payouts made to premiums earned in a year. It represents the percentage of every dollar in premium that goes toward payment of claims. Since the ratio is 0.65, for every $1 in premium perceived, the insurer pays $0.65 to its policyholders.
Offered by AnalystPrep


Get Ahead on Your Study Prep This Cyber Monday! Save 35% on all CFA® and FRM® Unlimited Packages. Use code CYBERMONDAY at checkout. Offer ends Dec 1st.