


Assumptions of the Simple Linear Regre ...
Before we can draw conclusions, we need to make the following key assumptions.... Read More

Overfitting is a problem that arises when the machine learning algorithm fits the training data too well, making it unable to predict well using new data. Overfitting means training a model to such a degree of specificity to the training data that the model begins to incorporate noise coming from quirks or spurious correlations. Additionally, it mistakes randomness for patterns and relationships. It means that the fitted algorithm does not generalize well to new data.
The data set to which an ML model is applied is partitioned into three non-overlapping samples. A training set for training the model, validation sample used to validate and tune the model, and test sample for testing the model’s ability to predict well on new data. The training set is often quoted as being “in-sample,” whereas the validation and test samples are referred to as being “out-of-sample.”
Think of overfitting as tailoring a custom suit that fits only one person. On the other hand, underfitting is analogous to making a baggy suit that fits no one. Finally, robust fitting, the desired result, is similar to fashioning a universal suit that fits all similar people.
The concepts of underfitting, robust fitting, and overfitting, as shown in the following figure:
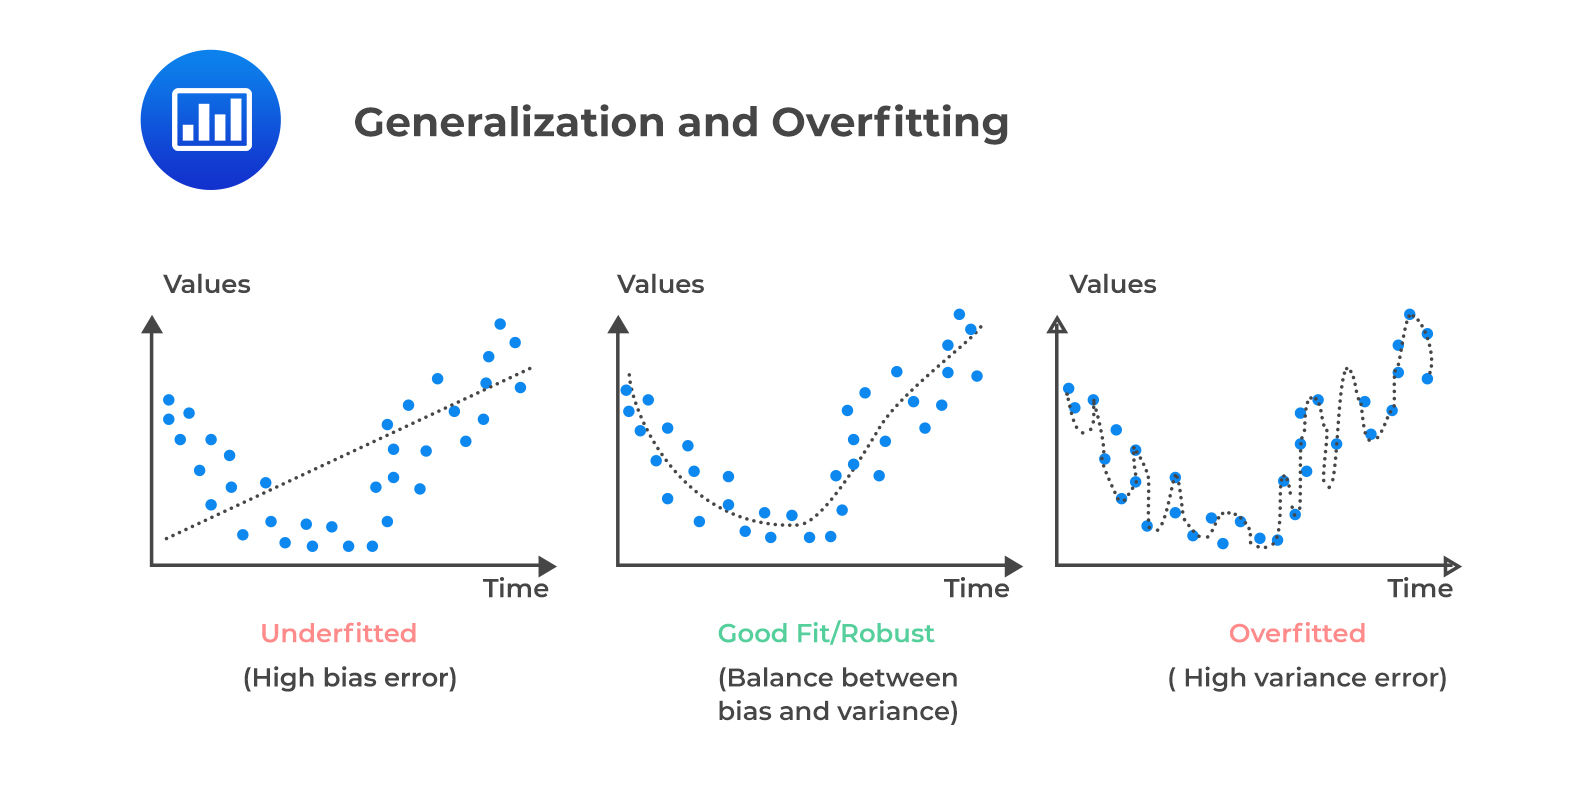 The graph on the left side represents a model which is too simple to explain the variance. This is because we can predict that the line fails to cover all the points in the graph, causing the underfitting of the data and thus has a high bias error.
In contrast, the graph on the right side shows forced fitting; i.e., it is too good to be true. It may look like a useful graph that covers all points; however, the predicted line into the graph incorporates noise and random fluctuations in the training data into its learned relationship. Such models most likely predict poor results due to the complexity. The model has a high variance error.
Lastly, the middle graph shows appropriate fitting as it has a pretty good predicted line. The line covers most of the points in the graph, and we can deduce that there is a balance between bias and variance.
Note that base error may arise as a result of the randomness of the data.
These three errors are components of the total out-of-sample error \((E_{out})\) which are from either the validation or test samples.
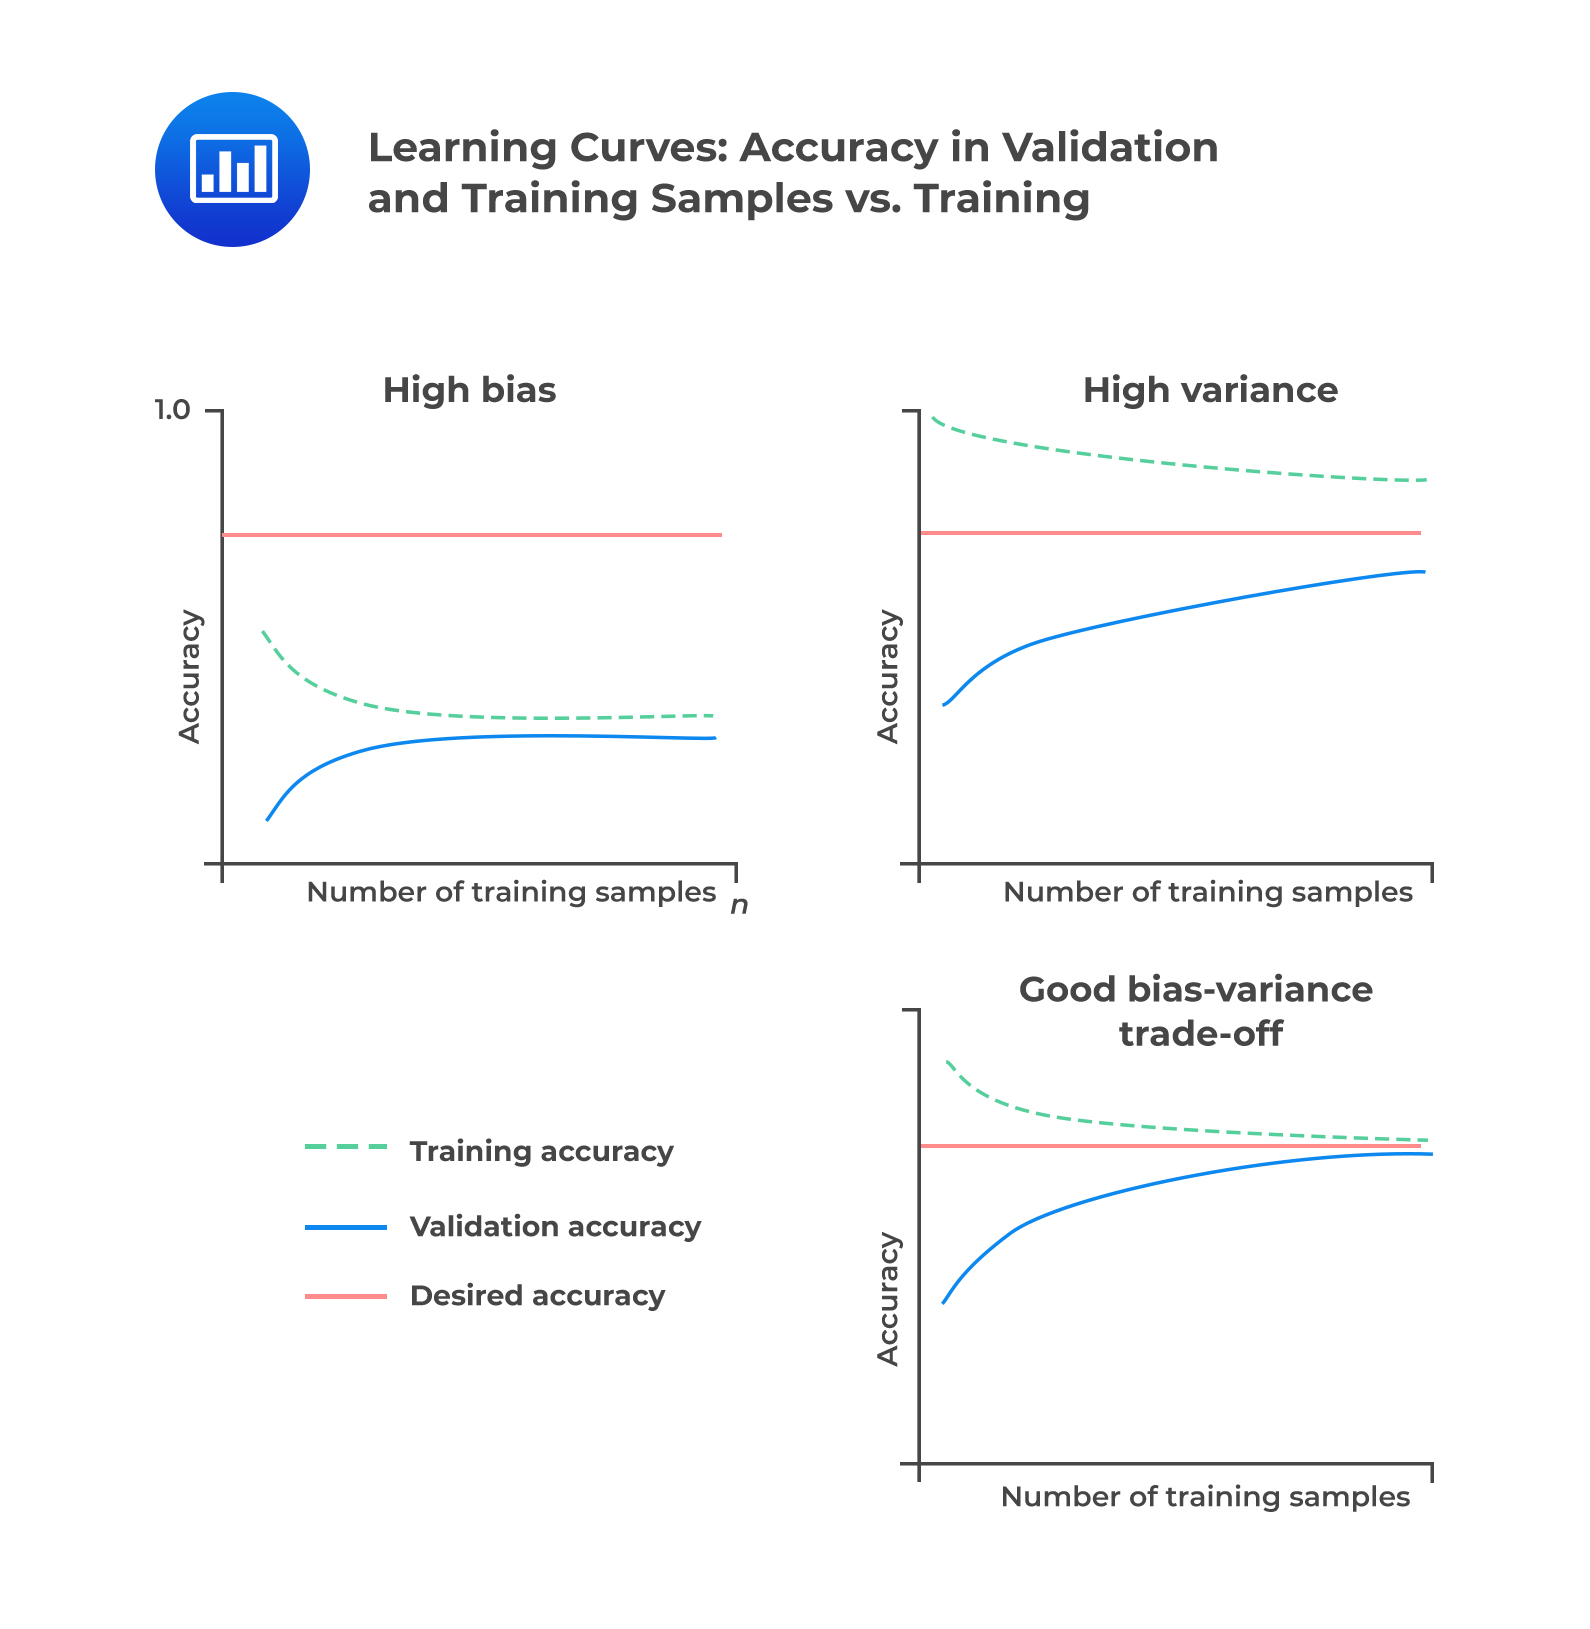
To solve overfitting and underfitting problems, we have to generalize our model. In other words, we need to solve the issue of bias and variance. A learning curve plots the accuracy rate in the out-of-sample, i.e., in the validation or test samples against the amount of data in the training sample. Therefore, it is useful for describing under and overfitting as a function of bias and variance errors.
In an underfitted model with high bias error, high error rates cause convergence below the desired accuracy rate. Adding training data in an underfitted model does not help as much. In an overfitted model with high variance error, the validation sample and training sample error rates fail to converge. Lastly, if the model is robust, out-of-sample accuracy increases as the training sample size increases. It implies that error rates experienced in the validation or test samples \((E_{out})\) and in training \((E_{in})\) sample converge toward each other and the desired error rate (or the base error).
We illustrate the above discussion in the following figure:
 When building models, data scientists try to minimize both bias and variance errors while selecting an algorithm with useful predictive or classifying power. Linear ML algorithms have a high bias and a low variance. Contrary, non-linear ML algorithms have low bias but a high variance. It is next to impossible to evade the relationship between bias and variance in ML as increasing the bias decreases the variance, and increasing the variance decreases bias.
Therefore, an optimal point of model complexity exists where the bias and variance error curves intersect, and the in and out-of-sample error rates are minimized. The fitting curve, which shows in- and out-of-sample error rates (\(E_{in}\) and \(E_{out}\)) on the y-axis plotted against model complexity on the x-axis is as shown in the following figure:
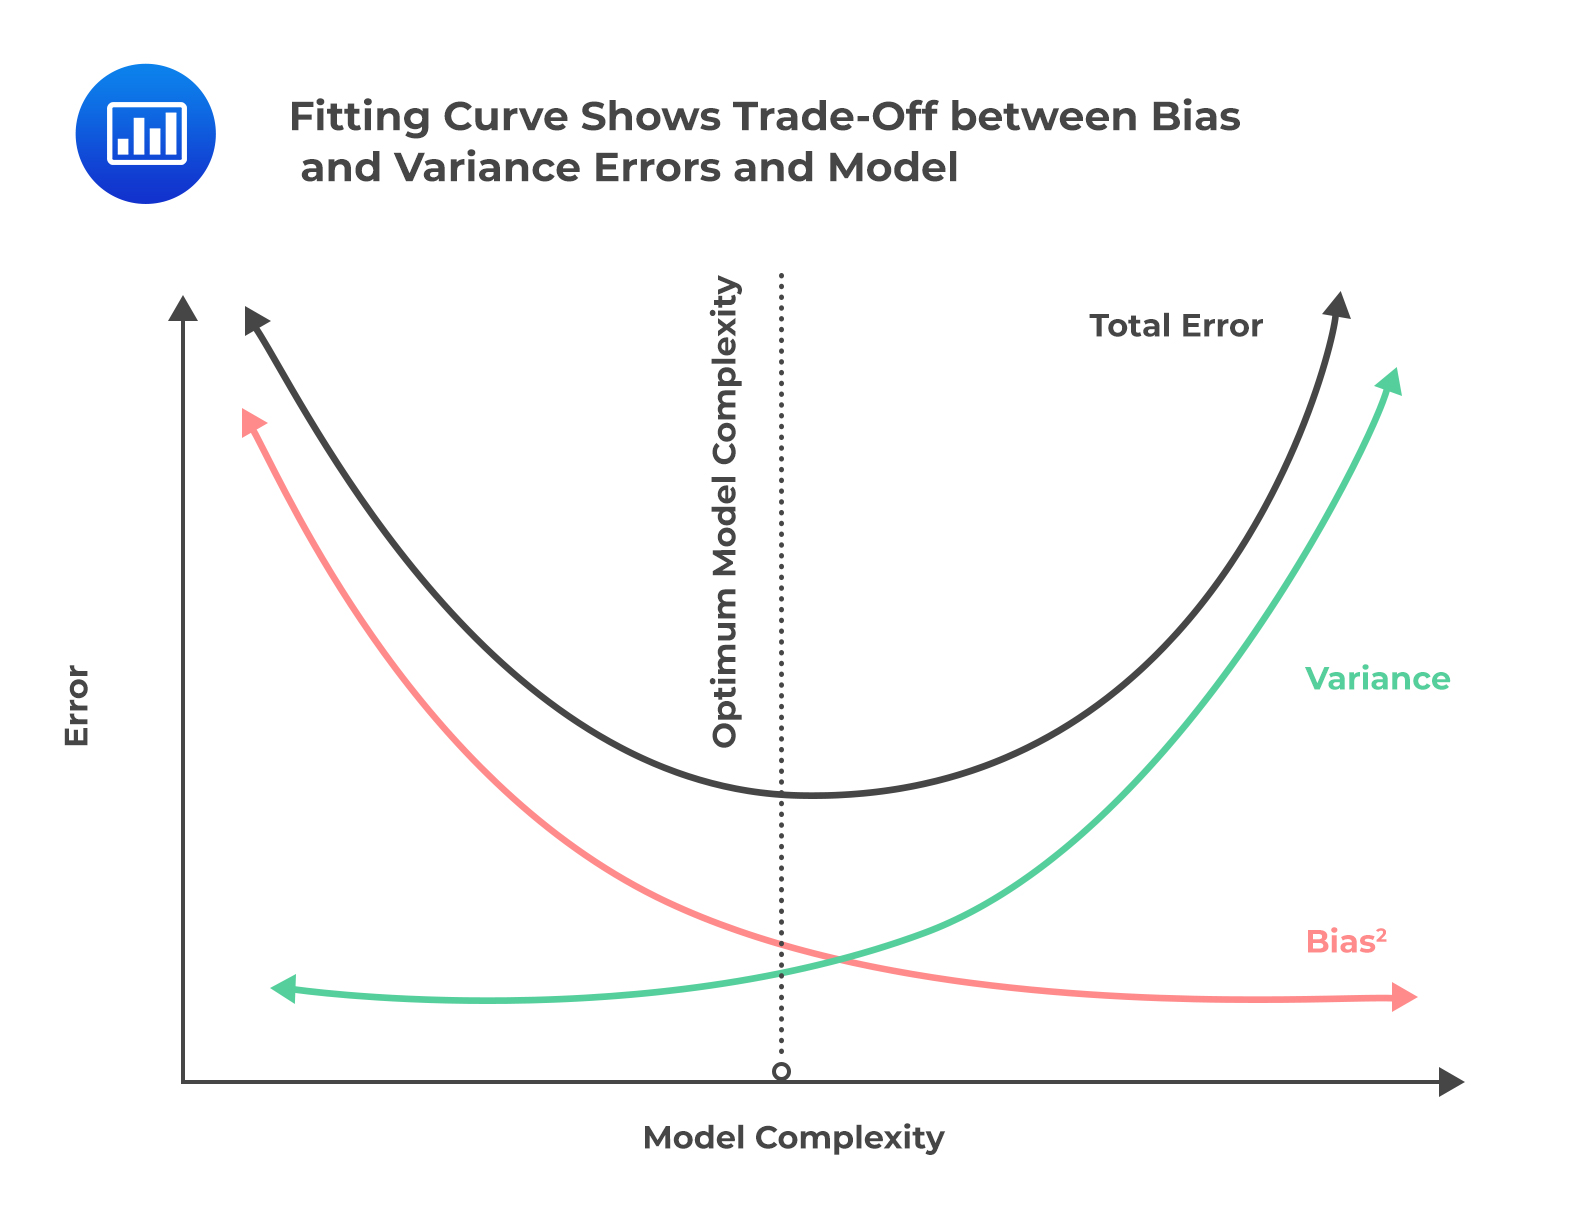 Finding the optimal point is a key to successful generalization and hence solves overfitting problems.
The two standard methods of reducing overfitting include: (1) preventing the algorithm from getting too complicated during selection and training and (2) proper data sampling through cross-validation.
The first strategy originates from “Occam’s razor,” the problem-solving principle that the simplest solution tends to be the correct one. In supervised machine learning, we obtain a simple solution by limiting the number of features and penalizing algorithms that are too complex by including only parameters that reduce out-of-sample error.
On the other hand, cross-validation comes from the principle of avoiding sampling bias. In supervised machine learning, sampling bias can be minimized through careful partitioning of the data set into three groups. These include:
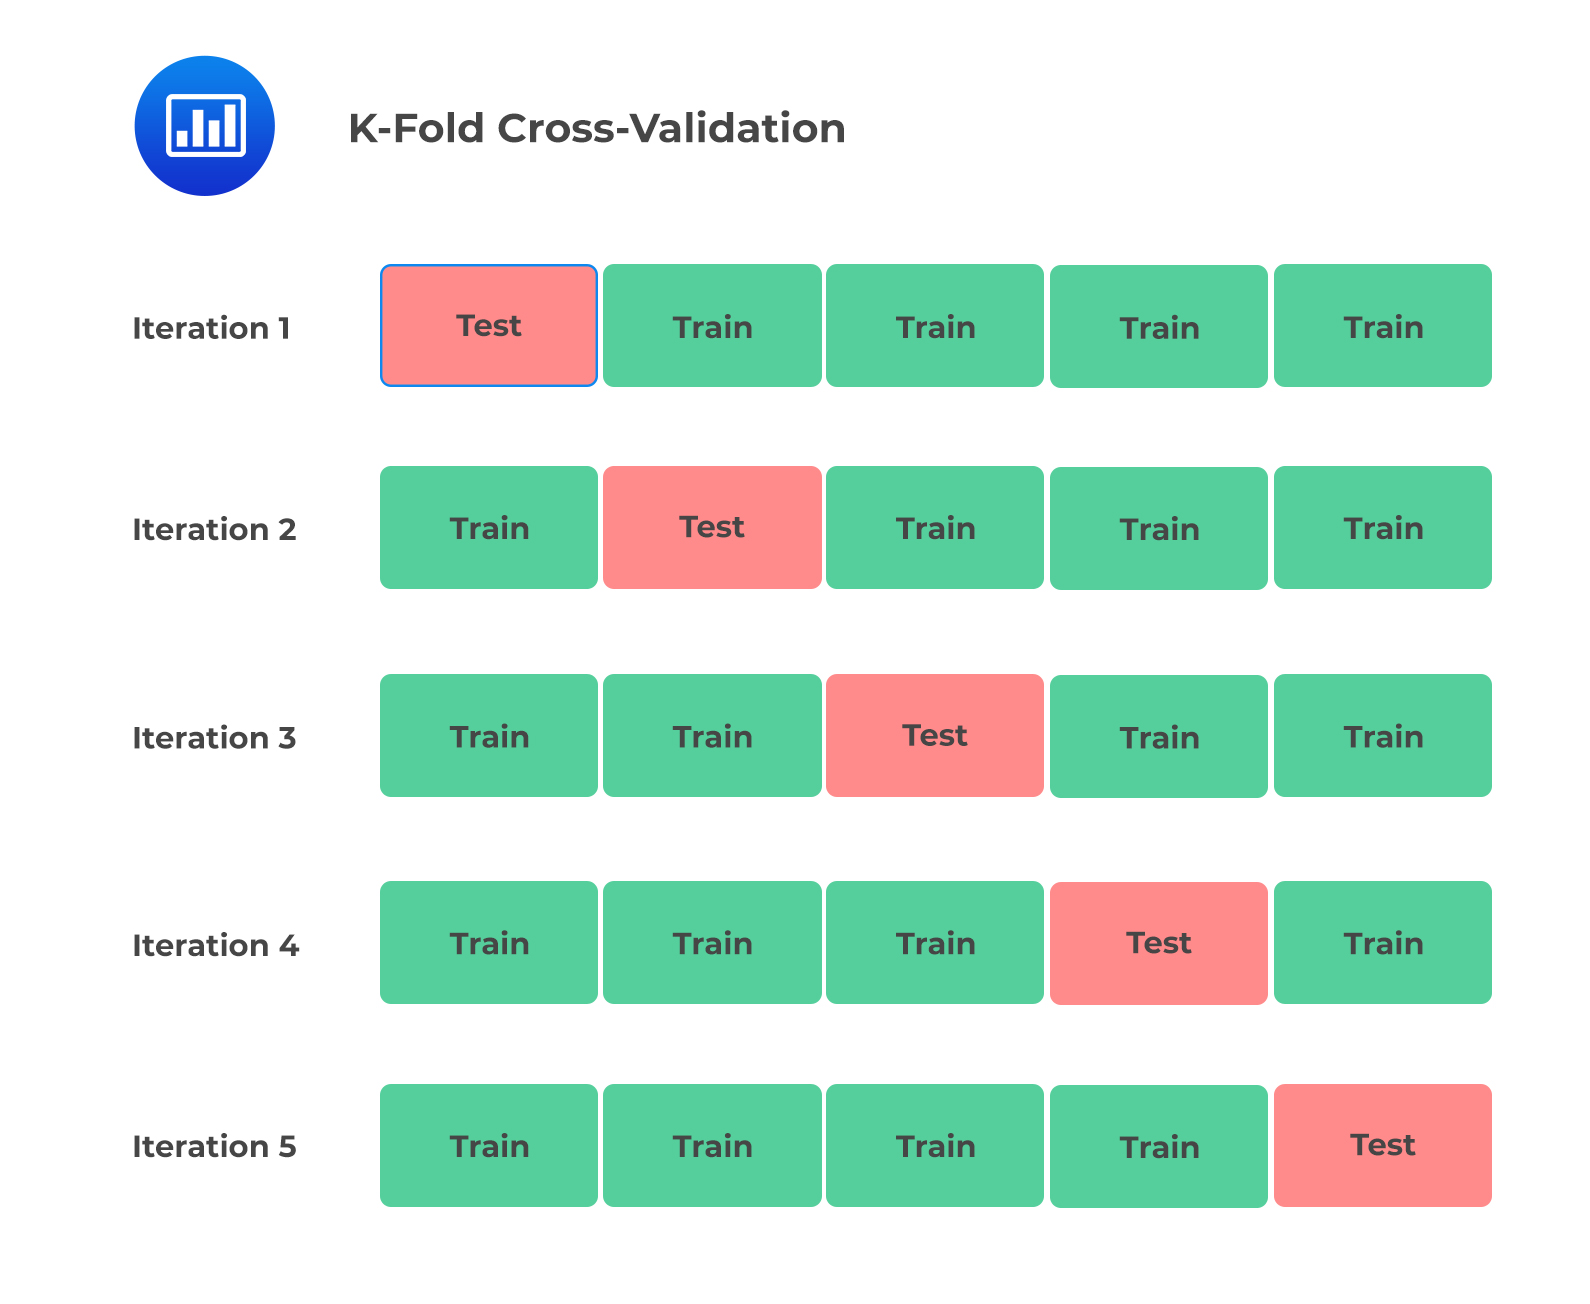
The problem of data samples not used to train the model, i.e., holdout samples, can be reduced further by using the k-fold cross-validation technique. K-fold cross-validation is where a given data set is split into k number of sections where each section is used as a testing set at some point. For example, if k=5, the data set is split into 5 sections/folds. In the first step, the first section is used to test the model, and the rest are used to train the model. This process is replicated until each fold of the 5 sections has been used as the testing set. The mean of the k validation errors is then taken as a reasonable estimate of the model’s out-of-sample error \((E_{out})\).
The following figure illustrates the 5-fold cross-validation:
 To summarize the last section, complexity reduction and cross-validation are the main methods used to reduce overfitting risk in model construction.
Question
A data scientist has been contracted by a significant investment company to classify all the companies listed on the Canadian Securities Exchange (CSE) into either profit-making or non-profit making categories. He gathers training, validating, and testing data on ML-based models. The data consists of 1,500 observations of the listed companies, each consisting of 30 features and the labeled target (profit-making or non-profit making).
The data scientist trains his model and observes that the trained model is good at correctly classifying. However, the model does not perform well using new data. Which of the following is most likely to have distorted his model?
- Underfitting and bias error.
- Overfitting and bias error.
- Overfitting and variance error.
Solution
The correct answer is C.
The model is overfitted. While it is good at correctly classifying using the training sample, it does not perform well using new data. Recall that an overfitted model has a high variance error.
A is incorrect. Underfitting means the model does not capture the relationships in the data.
C is incorrect. Algorithms with erroneous assumptions produce high bias with sparse approximation, causing underfitting and high in-sample error.
Reading 6: Machine Learning
LOS 6 (b) Describe overfitting and identify methods of addressing it
Offered by AnalystPrep


Get Ahead on Your Study Prep This Cyber Monday! Save 35% on all CFA® and FRM® Unlimited Packages. Use code CYBERMONDAY at checkout. Offer ends Dec 1st.