


ESG-Related Risks and Opportunities
Investors get a wider picture of industry and company analysis when integrating ESG... Read More

This reading will establish how interest rates and prices of bonds for different maturities are related.
The zero-coupon bond (discount bond) is the basic debt security that pays one unit of currency, e.g., $1, at maturity. The price \(P(T)\) of a discount bond, purchased today and maturing at time \(T\), given a constant interest rate, \({S}_{T}\) is given by:
$$ P\left(T\right)=\frac{1}{\left(1+S\left(T\right)\right)^T} $$
\(P(T)\) is also referred to as the discount factor.
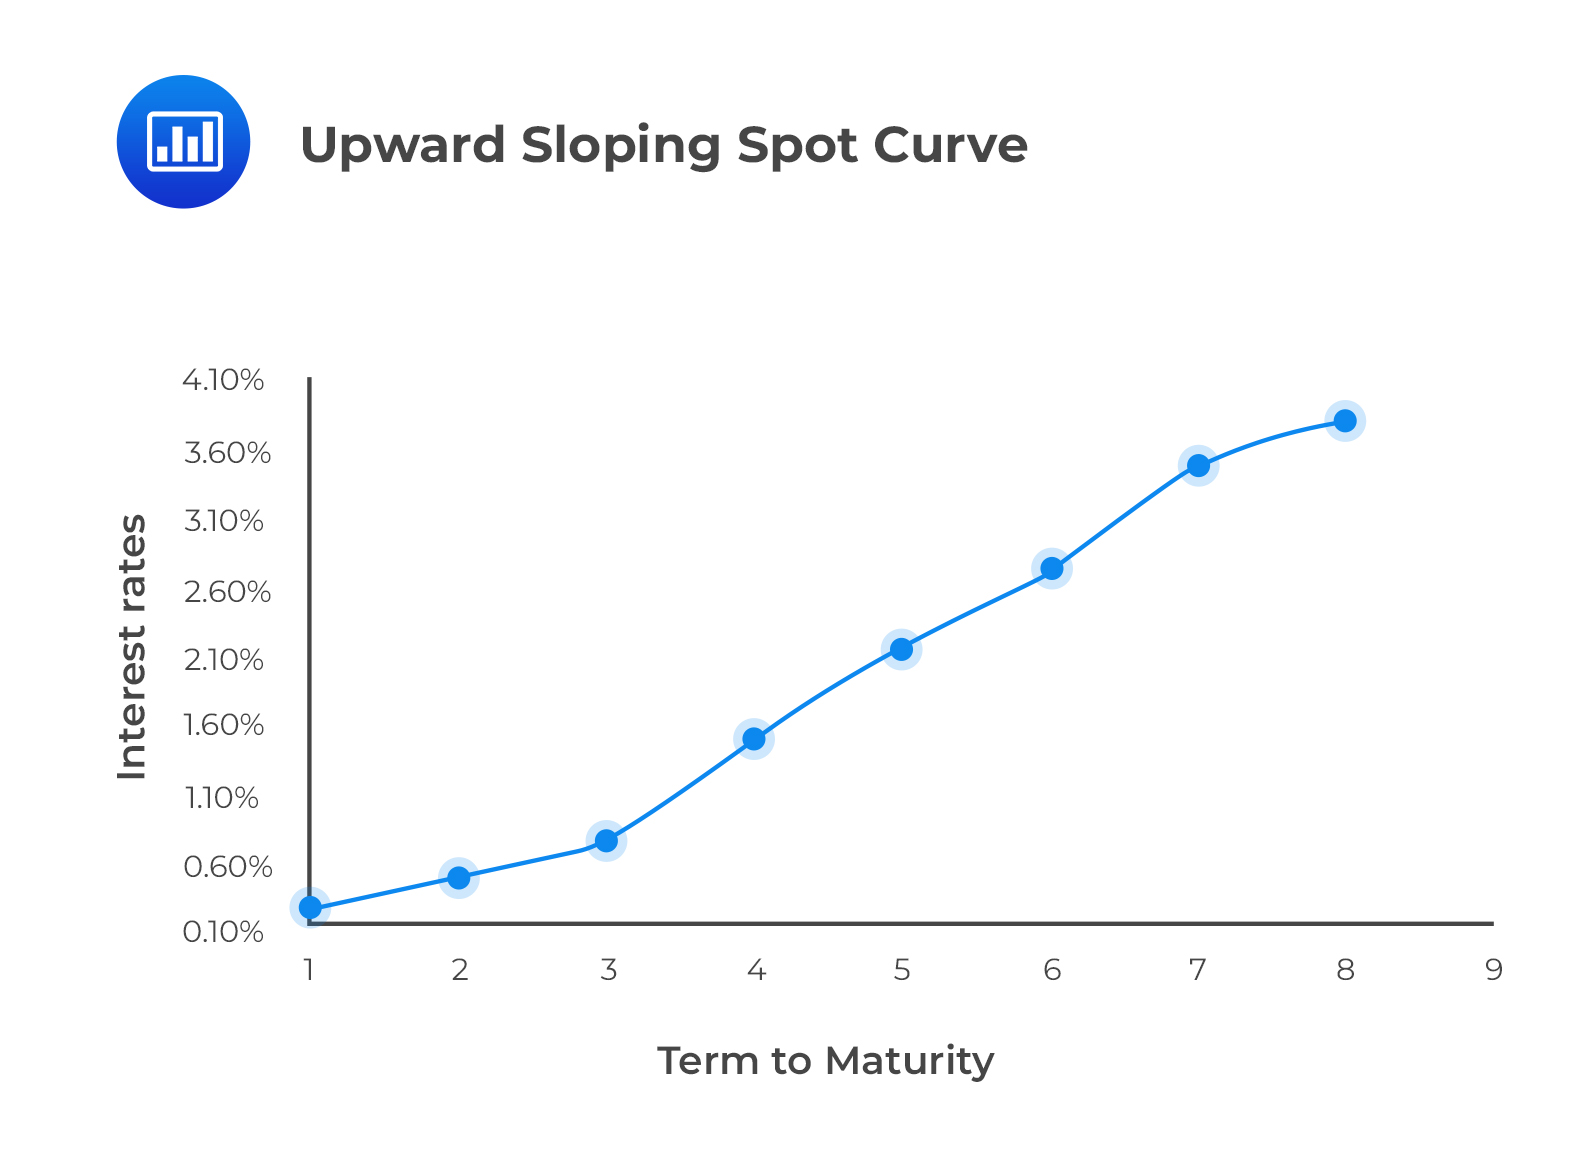
\(S(T)\) is known as the spot rate, defined as the yield to maturity of payment of a single unit of currency at maturity, \(T\).
A spot curve shows the relationship between the spot rates at different maturities. The following figure shows an upward sloping spot curve.
 Example: Spot Rates
Consider a two-year zero-coupon bond with a face value of $100. If the interest rate over the investment horizon is 10%, the price of the bond is closest to:
$$ P\left(T\right)=\frac{1}{\left(1+S\left(T\right)\right)^T} $$
The 10% interest rate is an example of a spot rate.
$$ \begin{align*} P\left(2\right) &=\frac{$100}{\left(1+0.10\right)^2} \\ P\left(2\right) &=$82.64 \end{align*} $$
The forward rate \(f(0, t, T)\) is the annualized interest rate payable on a loan, which is agreed upon today, starting at time \(t\), to be repaid at maturity \(T\).
In this case:
This can be shown in the following timeline.
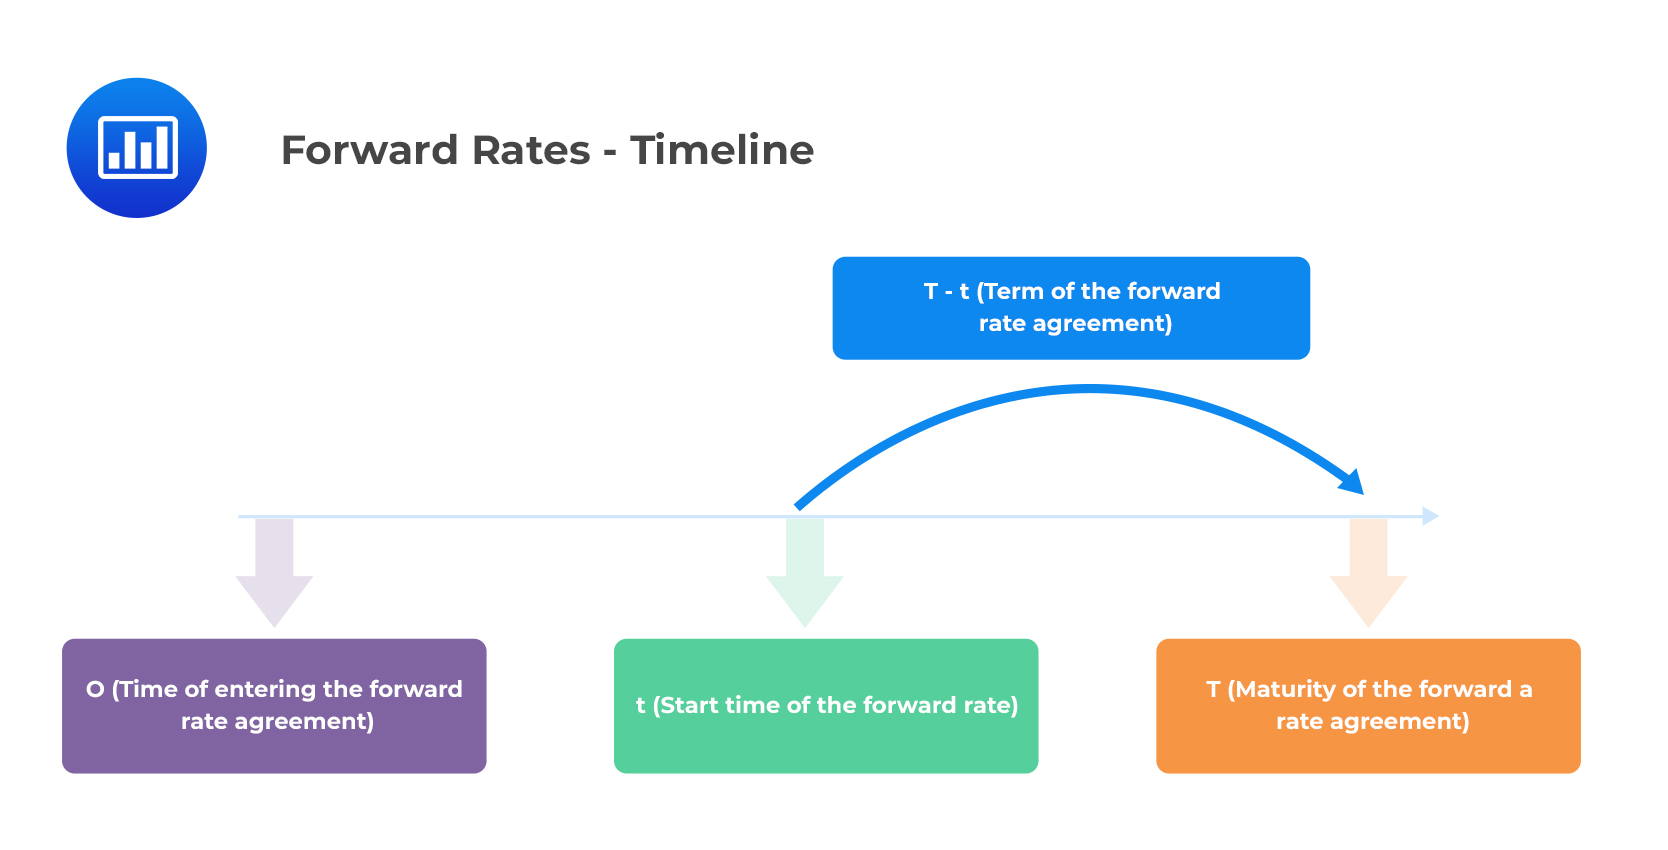 \(F(0,t,T)\) is the forward price (discount factor) of a zero-coupon bond, agreed upon at time 0, filled at time \(t\), and maturing at time \(T\). It is expressed mathematically as:
$$ F\left(0, t, T\right)=\frac{1}{\left[1+f\left(0,t,T\right)\right]^{T-t}} $$
This can also be written as:
$$ F\left(t,T-t\right)=\frac{1}{\left[1+f\left(t,T-t\right)\right]^{T-t}} $$
A forward curve is a graph showing the relationship between the forward rates and the related terms to maturity. The following figure illustrates both the forward curve and the spot curve.
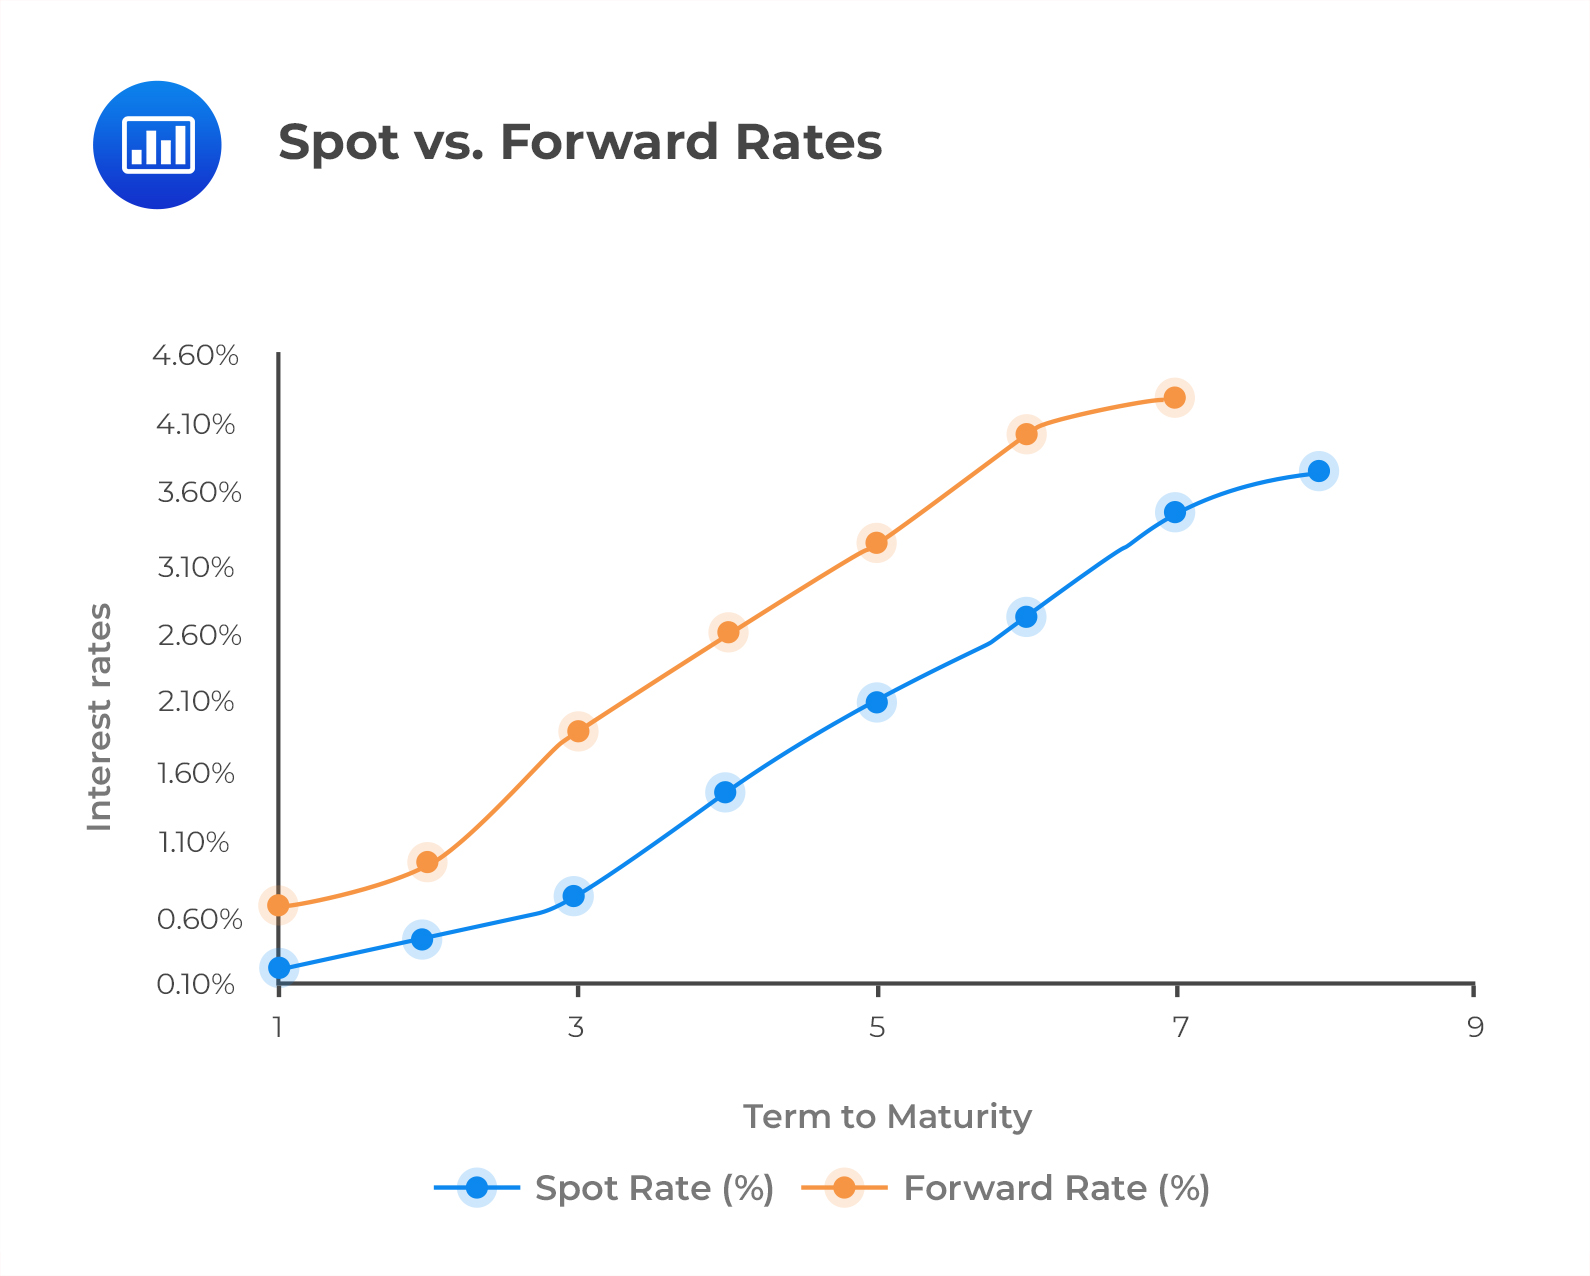 Notice that the forward curve lies above the spot curve for an upward sloping spot curve. Conversely, the forward curve will lie below the spot curve for a downward sloping spot curve. This will be discussed later in the forward rate model.
The yield to maturity (YTM) is the discount rate that equates the present value of future bond payments (includes coupons and the par value) to the bond’s market price.
In other words, YTM is the expected rate of return on a bond if:
If the spot rate curve of a coupon-paying bond is flat, the YTM will be the same as the spot rate. Also, note that the YTM of a zero-coupon bond is equal to the spot rate.
ABC Ltd. has issued a bond with a face value of $500, which carries an annual coupon of 10% and matures in 4 years. The spot rate curve is given in the following table.
$$ \begin{array}{c|c} \textbf{Year} & \textbf{Spot rate, S(t)} \\ \hline 1 & 10\% \\ \hline 2 & 12\% \\ \hline 3 & 14\% \\ \hline 4 & 16\% \end{array} $$
$$ \text{Coupon payment} = $500\times10\%=$50 $$
$$ \text{Price} =\frac{$50}{\left(1+0.10\right)^1}+\frac{$50}{\left(1+0.12\right)^2}+\frac{$50}{\left(1+0.14\right)^3}+\frac{$550}{\left(1+0.16\right)^4}=$422.82 $$
We can compute the YTM by solving for \(Y\) in the following equation:
$$ \begin{align*} 422.82 & =\frac{50}{\left(1+Y\right)^1}+\frac{50}{\left(1+Y\right)^2}+\frac{50}{\left(1+Y\right)^3}+\frac{550}{\left(1+Y\right)^4} \\ Y &=15.46\% \end{align*} $$
Using a financial calculator with the following inputs results in the same YTM:
The expected return is the return that a bondholder anticipates earning over the investment holding period. Generally, the YTM is not the same as the expected return.
The expected return will be equal to the YTM of a bond if and only if:
The YTM is a poor estimate of the expected return in cases where:
The realized return refers to the actual return earned on a bond during its holding period.
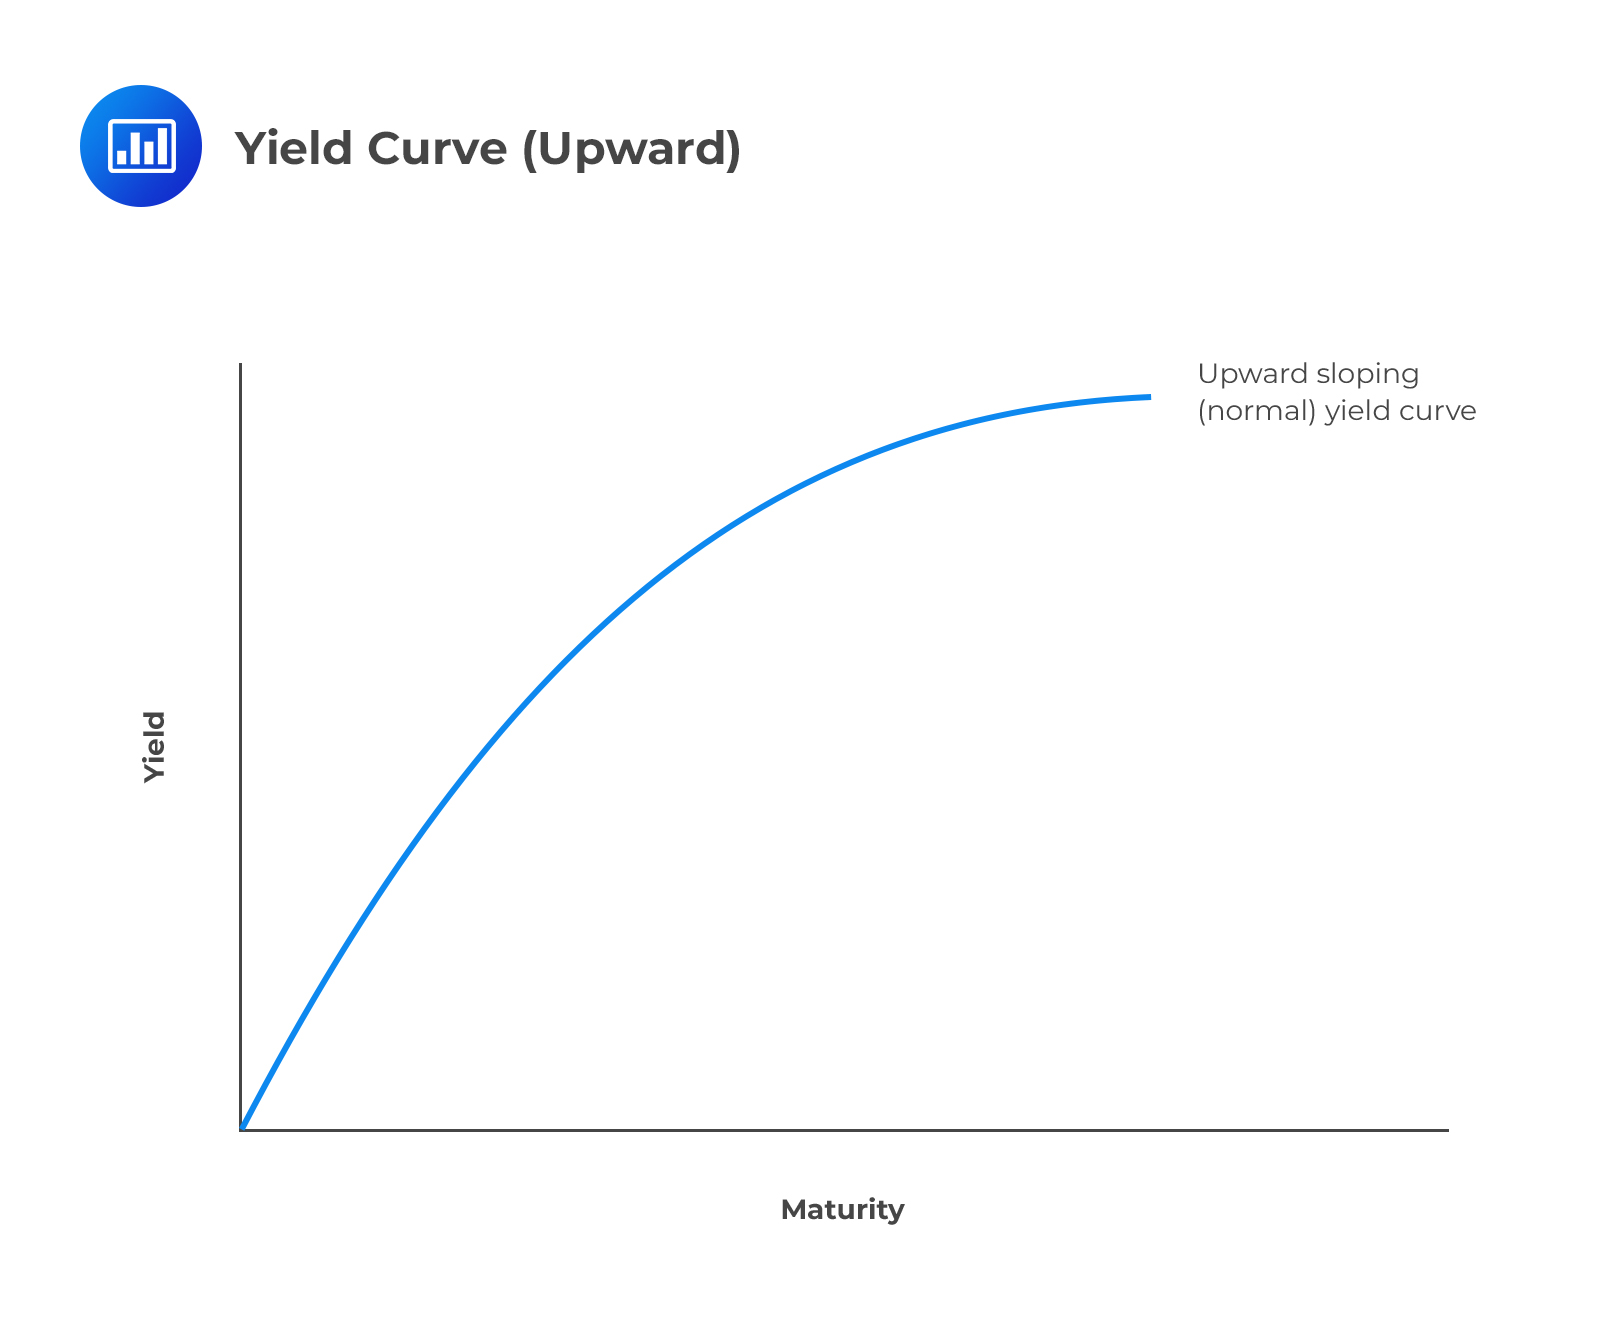
The yield curve is attained by plotting the spot rate \(S(T)\) against maturity, \(T\). It gives information on the term structure of interest rates.
The term structure of interest rates suggests that the yield curve is typically upward sloping. This means that a bond with a longer-term maturity has a higher yield relative to a shorter-term bond.
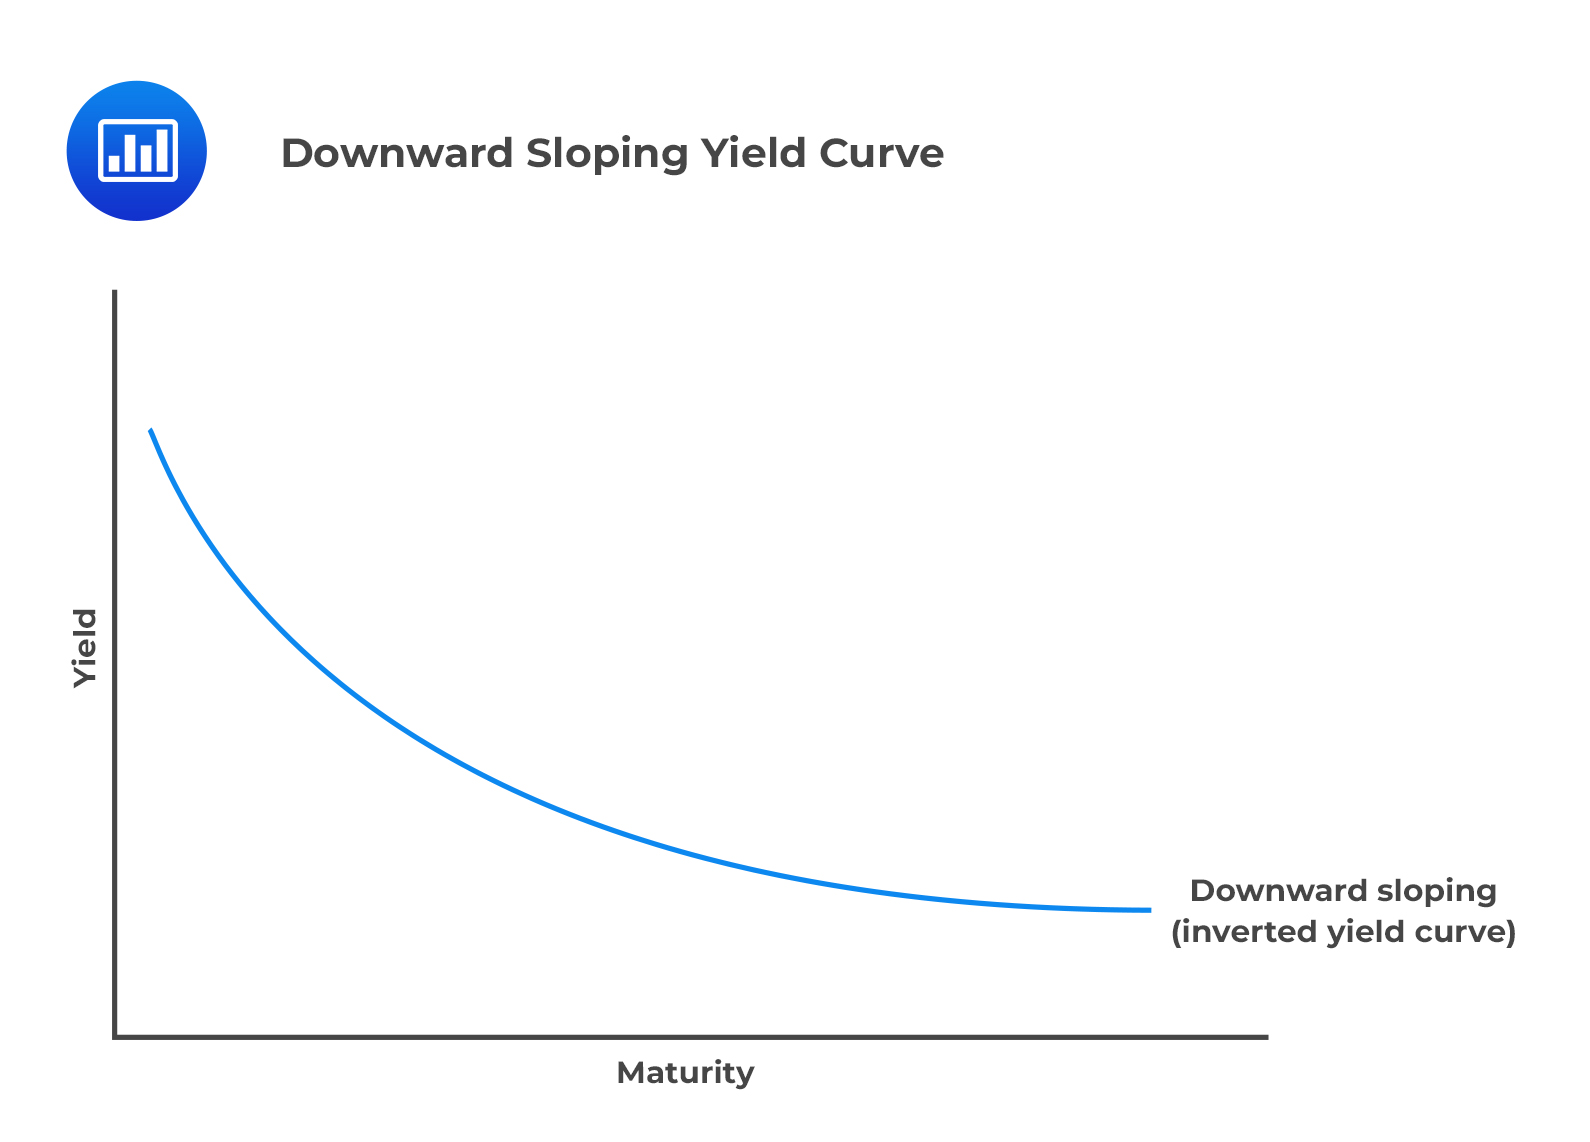
 Downward Sloping Yield Curve
In some cases, the yield curve can be downward sloping (inverted). This implies that the yield on short-term bonds is higher than the yield on longer-term bonds. This can be the case on occasions where the government policy has increased the current interest rates.
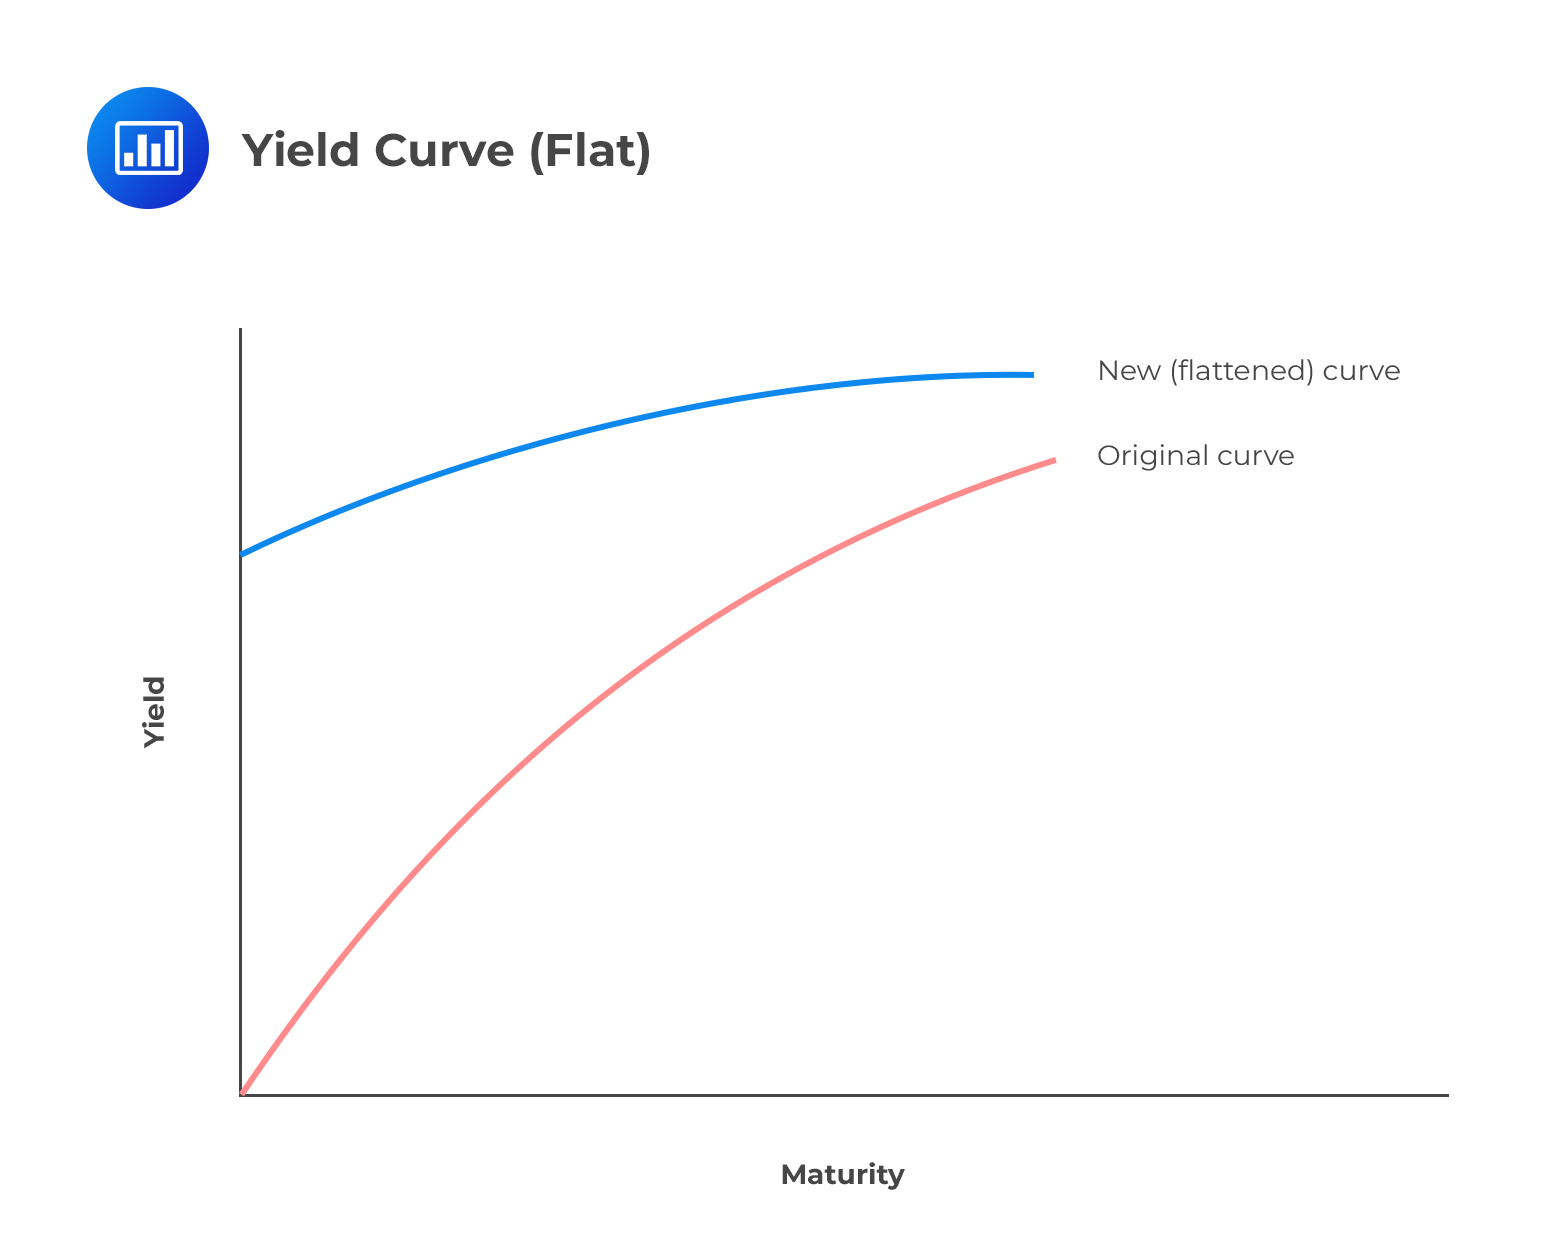
 Flattened Yield Curve
Finally, the yield curve can be flat. This implies that the yield on a long-term bond is equal to the yield on a short-term bond. This may be due to market participants expecting a decrease in inflation.
Question
Cream Trust bank has issued a zero-coupon bond with a face value of $50,000. The bond matures in 5 years. The yield to maturity of the bond given that the bond is priced at $34,029 is closest to:
- 8%.
- 9%.
- 47%.
Solution
The correct answer is A.
$$ \begin{align*} P\left(T\right)&=\frac{1}{\left(1+S\left(T\right)\right)^T} \\ \\ 34,029 &=\frac{50,000}{\left(1+S_5\right)^5} \\ \\ S_5 &=8\% \end{align*} $$
N/B: The YTM of a zero-coupon bond is equal to the spot rate.
Reading 28: The Term Structure and Interest Rate Dynamics
LOS 28 (a) Describe relationships among spot rates, forward rates, yield to maturity, expected and realized returns on bonds, and the shape of the yield curve.
Offered by AnalystPrep


Get Ahead on Your Study Prep This Cyber Monday! Save 35% on all CFA® and FRM® Unlimited Packages. Use code CYBERMONDAY at checkout. Offer ends Dec 1st.