Impact of Changes in the Components of ...
Changes in volume and prices primarily propel sales growth for a multinational corporation.... Read More
Hypothesis testing involves testing an assumption regarding a population parameter. A null hypothesis is a condition believed not to be true. We reject the null hypothesis in the presence of enough evidence against it and accept the alternative hypothesis.
Hypothesis testing is performed on the estimated slope coefficients to establish if the independent variables make a significant contribution to explaining the variation in the dependent variable.
The t-statistic for testing the significance of the individual coefficients in a multiple regression model is calculated using the formula:
$$t=\frac{\widehat{b_{j}}-b_{H0}}{S_{\widehat{b_{j}}}}$$
Where:
Note that the test statistic has \(n-k-1\) degrees of freedom, where \(k\) is the number of independent variables, and \(1\) is the intercept term.
A t-test tests the null hypothesis that the regression coefficient is equal to some hypothesized value against the alternative hypothesis that it is not.
\(H_0:b_j=v\) v.s \(H_{a}:b_{j}≠v\)
Where:
The following are the steps followed in hypothesis testing:
i. Formulate hypothesis.
ii. Determine the suitable test statistic.
$$t_{statistic}= \frac{\widehat{b_{j}}-b_{H0}}{S_{\widehat{b_{j}}}}$$
iii. Specify the significance level.
iv. Make the statistical decision.
Consider the following multiple regression results of the price of USDX versur inflation rate and real interest rate.
$$\small{\begin{array}{l|c}\hline\textbf{Regression Statistics}\\ \hline\text{Multiple R} & 0.8264\\ \hline\text{R Square} & 0.6830\\ \hline\text{Adjusted R Square} & 0.5924\\ \hline\text{Standard Error} & 5.3537\\ \hline\text{Observations} & 10\\ \hline\end{array}}$$
$$\small{\begin{array}{l|c|c|c|c}{}& \textbf{Coefficients} & \textbf{Standard Error} & \textbf{t-statistic} & \textbf{P-value}\\ \hline\text{Intercept} & 81 & 7.9659 & 10.1296 & 0.0000\\ \hline\text{Inflation rates} & -276 & 233.0748 & -1.1833 & 0.2753\\ \hline\text{Real interest Rates} & 902 & 279.6949 & 3.2266 & 0.0145\\ \end{array}}$$
Test the statistical significance of the independent variable real rate of interest at the 5% significance level.
We are testing the hypothesis:
\(H_{0}\): Real Interest Rate=0 versus \(H_{a}\): Real Interest Rate ≠ 0.
The t-statistic is determined as:
$$t=\frac{\widehat{b_{j}}-b_{H0}}{S_{\widehat{b_{j}}}}$$
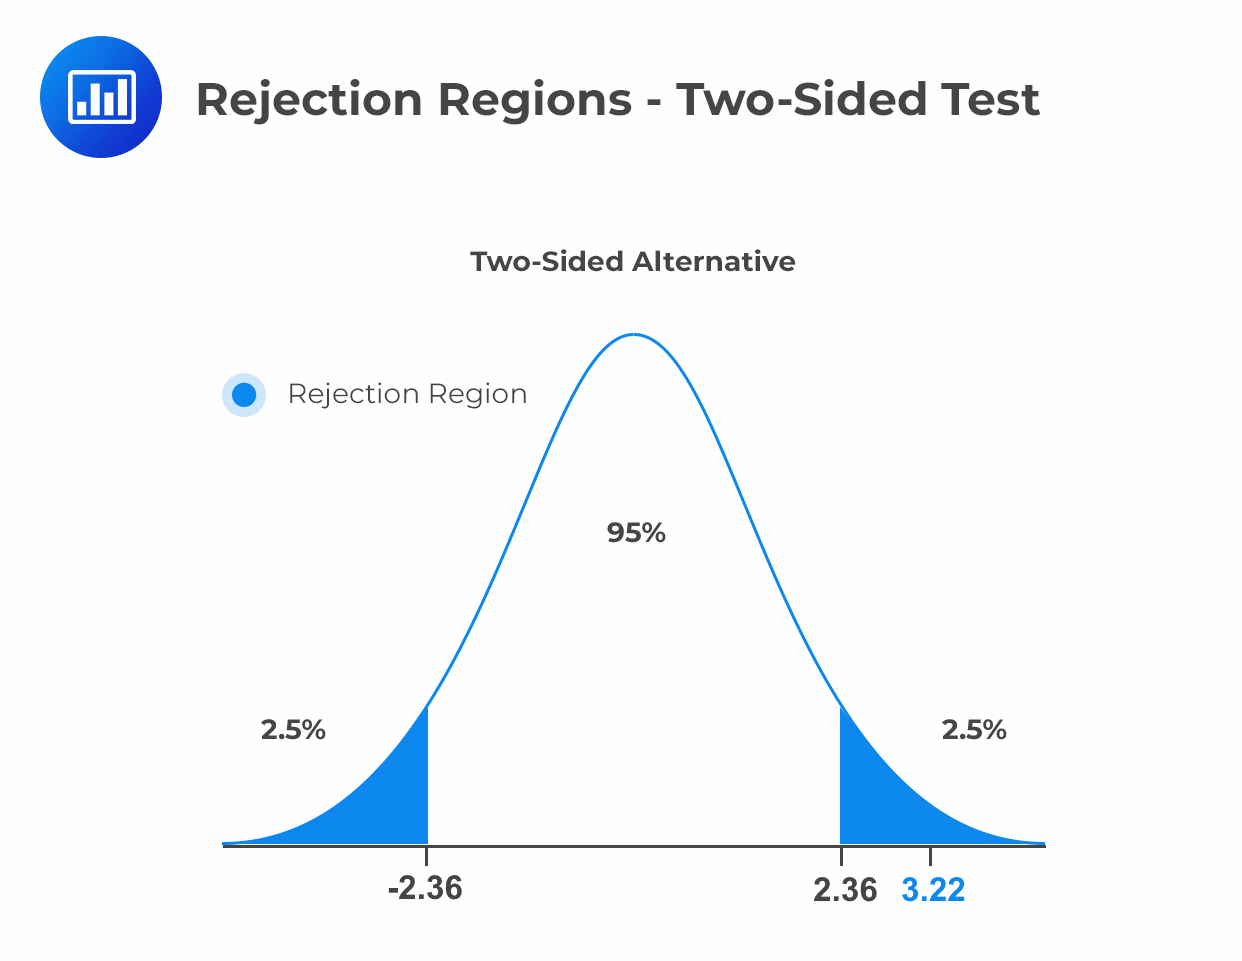
$$\begin{align*}t&=\frac{902-0}{279.6949}\\&=3.22\end{align*}$$
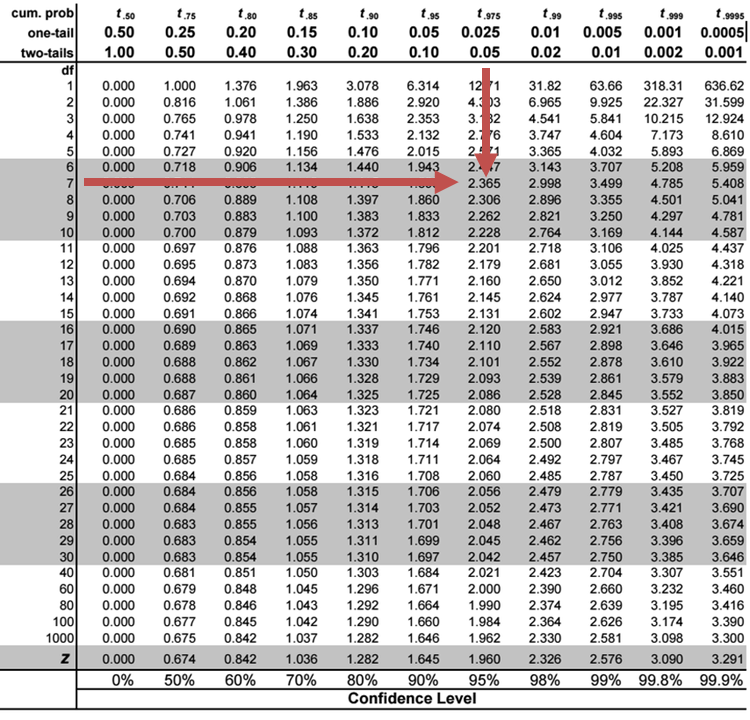
The 5% two-tailed critical t-value with \(10-2-1 = 7\) degrees of freedom is 2.3646.

Since the t-statistic, \(3.22\), is greater than the critical value, \(2.365\), we reject the null hypothesis and conclude that the real interest rate regression coefficient is statistically significantly different from zero at the 5% significance level.

Question
Consider the following multiple regression results of the return on capital (ROC) vs. performance measures (profit margin (%), sales and debt ratio).
$$\small{\begin{array}{|l|c|}\hline\textbf{Regression Statistics}\\ \hline\text{Multiple R} & 0.7906\\ \hline\text{R Square} & 0.6251\\ \hline\text{Adjusted R Square} & 0.5715\\ \hline\text{Standard Error} & 1.1963\\ \hline\text{Observations} & 25\\ \hline\end{array}}$$
$$\small{\begin{array}{l|c|c|c|c|c}{}& \textbf{Coefficients} & \textbf{Standard Error} & \textbf{t Stat} & \textbf{P-value} \\ \hline\text{Intercept} & 8.6531 & 0.9174 & 9.4323 & 0.0000 \\ \hline \text{Sales} & 0.0009 & 0.0005 & 1.7644 & 0.0922\\ \hline\text{Debt ratio} & 0.0229 & 0.0165 & 1.3880 & 0.1797 \\ \hline\text{Profit Margin%} & 0.2996 & 0.0564 & 5.3146 & 0.0000\\ \end{array}}$$
Adil Suleman, CFA, wants to test whether \(b_{o}\) is different from zero. Assuming a 5% significance level, the hypothesis used and the result of the hypothesis test are most likely:
$$\begin{array}{|l|l|l|} \hline
\text{A} & H_{0}:b_{0}= 0, vs. H_{a}: b_0≠0 & {\text{Fail to reject the null hypothesis and conclude that}\\ b_0 \text{ is equal to zero.}}\\ \hline
\text{B} & H_{0}:b_{0}= 0, vs. H_{a}: b_0=0 & {\text{Reject the null hypothesis and conclude that}\\ b_0 \text{ is equal to zero.}} \\ \hline
\text{C} & H_{0}:b_{0}= 0, vs. H_{a}: b_0≠0 & {\text{Reject the null hypothesis and conclude that}\\ b_0 \text{ is not equal to zero.}} \\ \hline
\end{array}$$Solution
The correct answer is C.
The hypothesis will be structured as:
\(H_0:b_0\), v.s. \(H_a: b_0 ≠0\)
\(\text{t-statistic}= 9.4323\)
This is a two-tailed test: The critical t-value with 23 degrees of freedom at the 5% significance level is ±2.069.
Notice that the t-stat is greater than the upper critical value. This prompts the rejection of the null hypothesis and conclusion that is significantly different from zero.
Reading 2: Multiple Regression
LOS 2 (c) Formulate a null and an alternative hypothesis about the population value of a regression coefficient, calculate the value of the test statistic, and determine whether to reject the null hypothesis at a given level of significance.
Get Ahead on Your Study Prep This Cyber Monday! Save 35% on all CFA® and FRM® Unlimited Packages. Use code CYBERMONDAY at checkout. Offer ends Dec 1st.