


Types of Electronic Traders
Electronic trading strategies are most effective because they act on information extremely fast.... Read More

CAMELS is a widely used approach to analyze a bank. In this context, a bank is an entity that primarily takes deposits and makes loans. “CAMELS” has six components which include: Capital adequacy, Asset quality, Management capabilities, Earnings sufficiency, Liquidity position, and Sensitivity to market risk.
An analyst using this approach to examine a bank undertakes analysis and assigns a numerical rating of 1 through 5 to each component. A rating of 1 is the best rating. It shows the best practices in risk management and performance and generating the least concern for regulators. In contrast, a rating of 5 is the worst rating. It shows the weakest performance and risk management practices. Besides, it generates the highest degree of regulatory concern. The analyst then constructs a composite rating for the entire bank from the component ratings.
Here are the components of the rating:
Capital adequacy is a vital requirement for banks to have adequate capital so that potential losses can be absorbed without making the bank become financially weak or insolvent. It represents the overall financial position of the bank. Capital adequacy is expressed in terms of the proportion of the bank’s assets funded with capital. Generally,
$$\text{Capital adequacy}=\frac{\text{Equity Capital}}{\text{Total assets}}$$
These assets are adjusted based on their risk, with riskier assets requiring a higher weighting. Cash has a risk weighting of zero, whereas corporate loans have a risk weighting of 100%. Loans on high volatility commercial real estate and loans that are 90 days past due have a weighting higher than 100%.
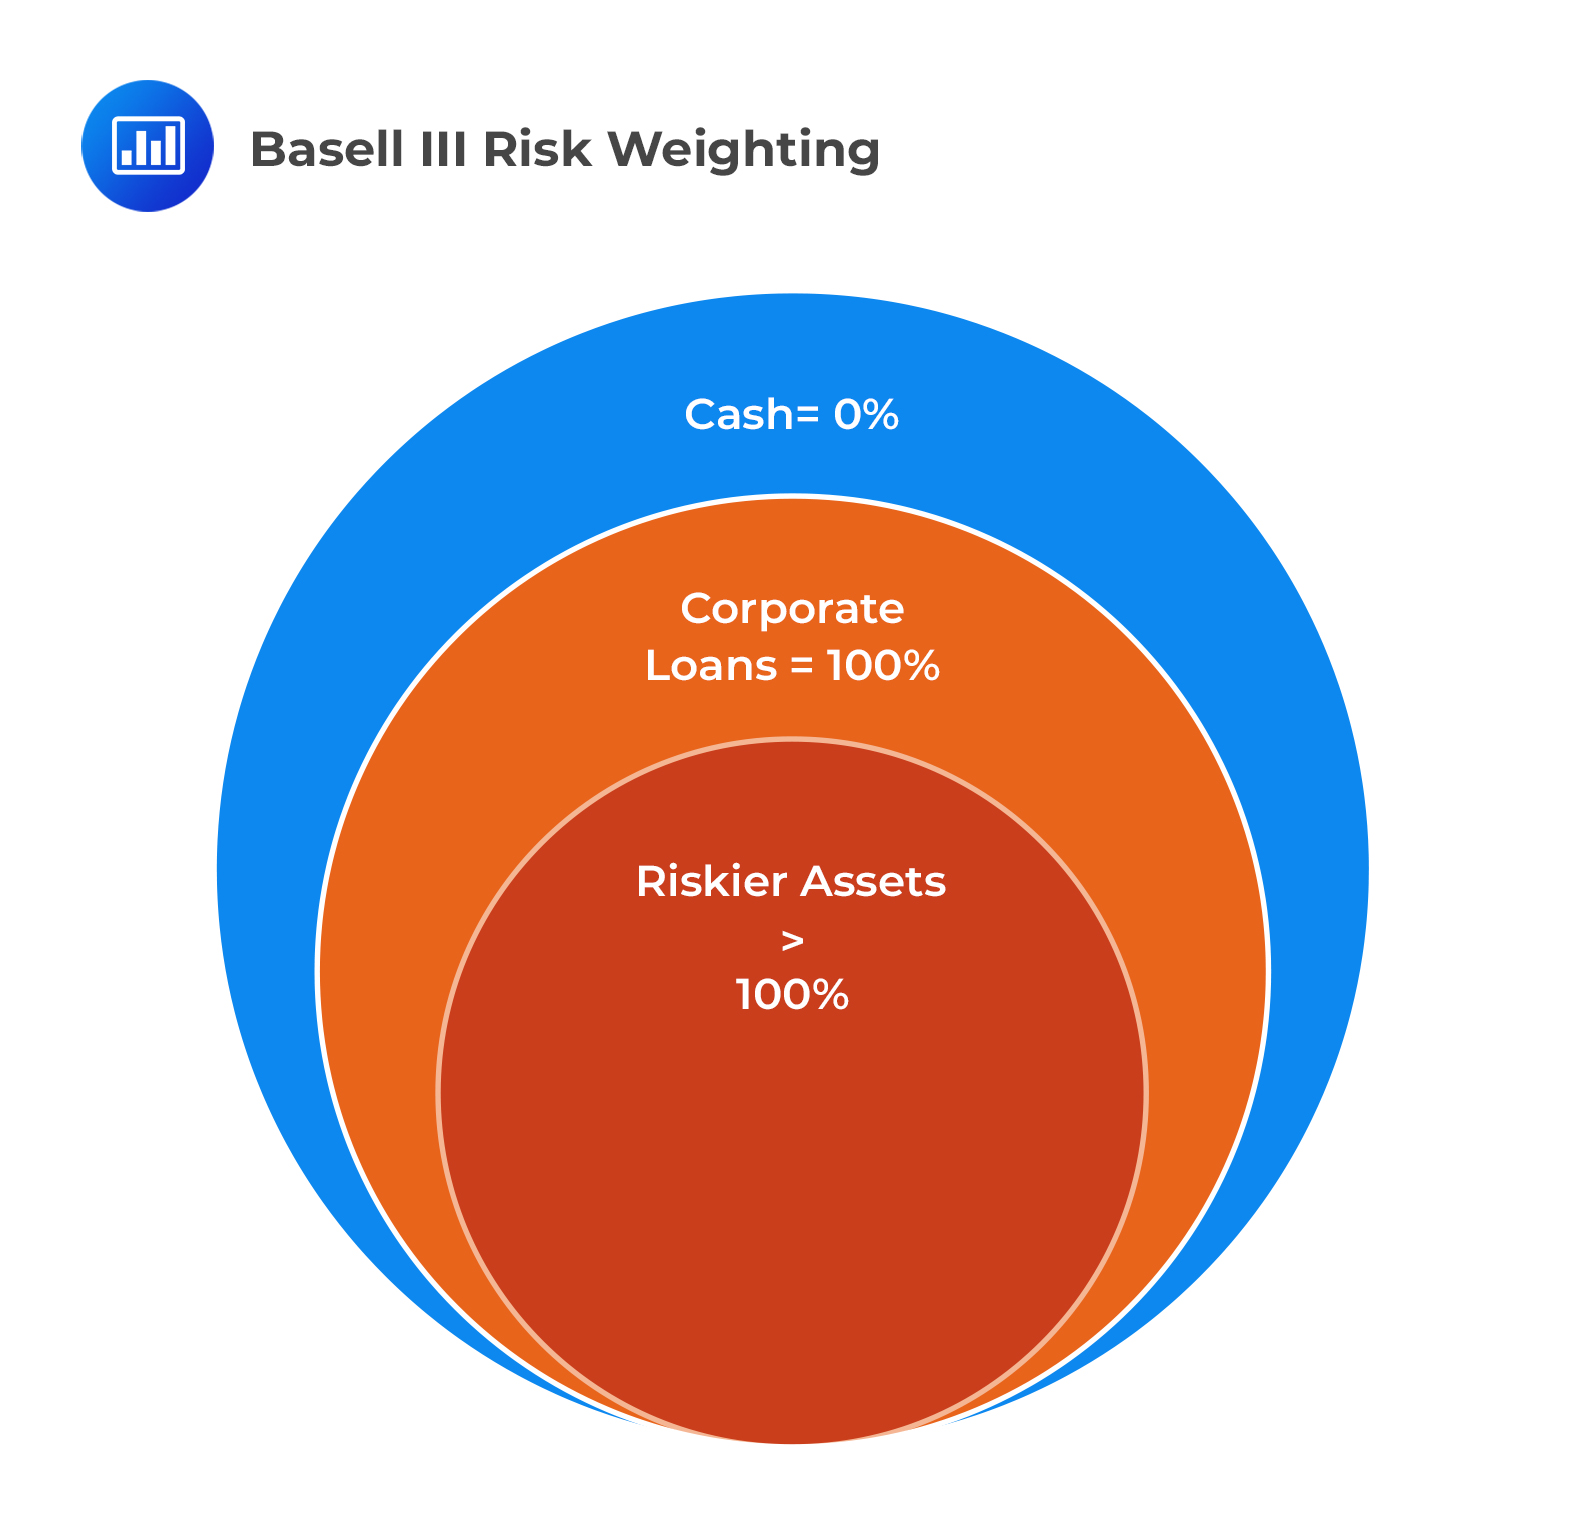 For example, a hypothetical bank has $15 million in cash, $1,500 million in performing loans and $20 million in non-performing loans. The bank’s risk-weighted assets (RWAs) are equal to \(($15 \text{ million}× 0) + ($1,500 \text{ million} ×100\%) + ($20 \text{ million} ×150\%) = $1,530 \text{ million}\). Off-balance-sheet exposures are assigned risk weights and included in the risk-weighted assets.
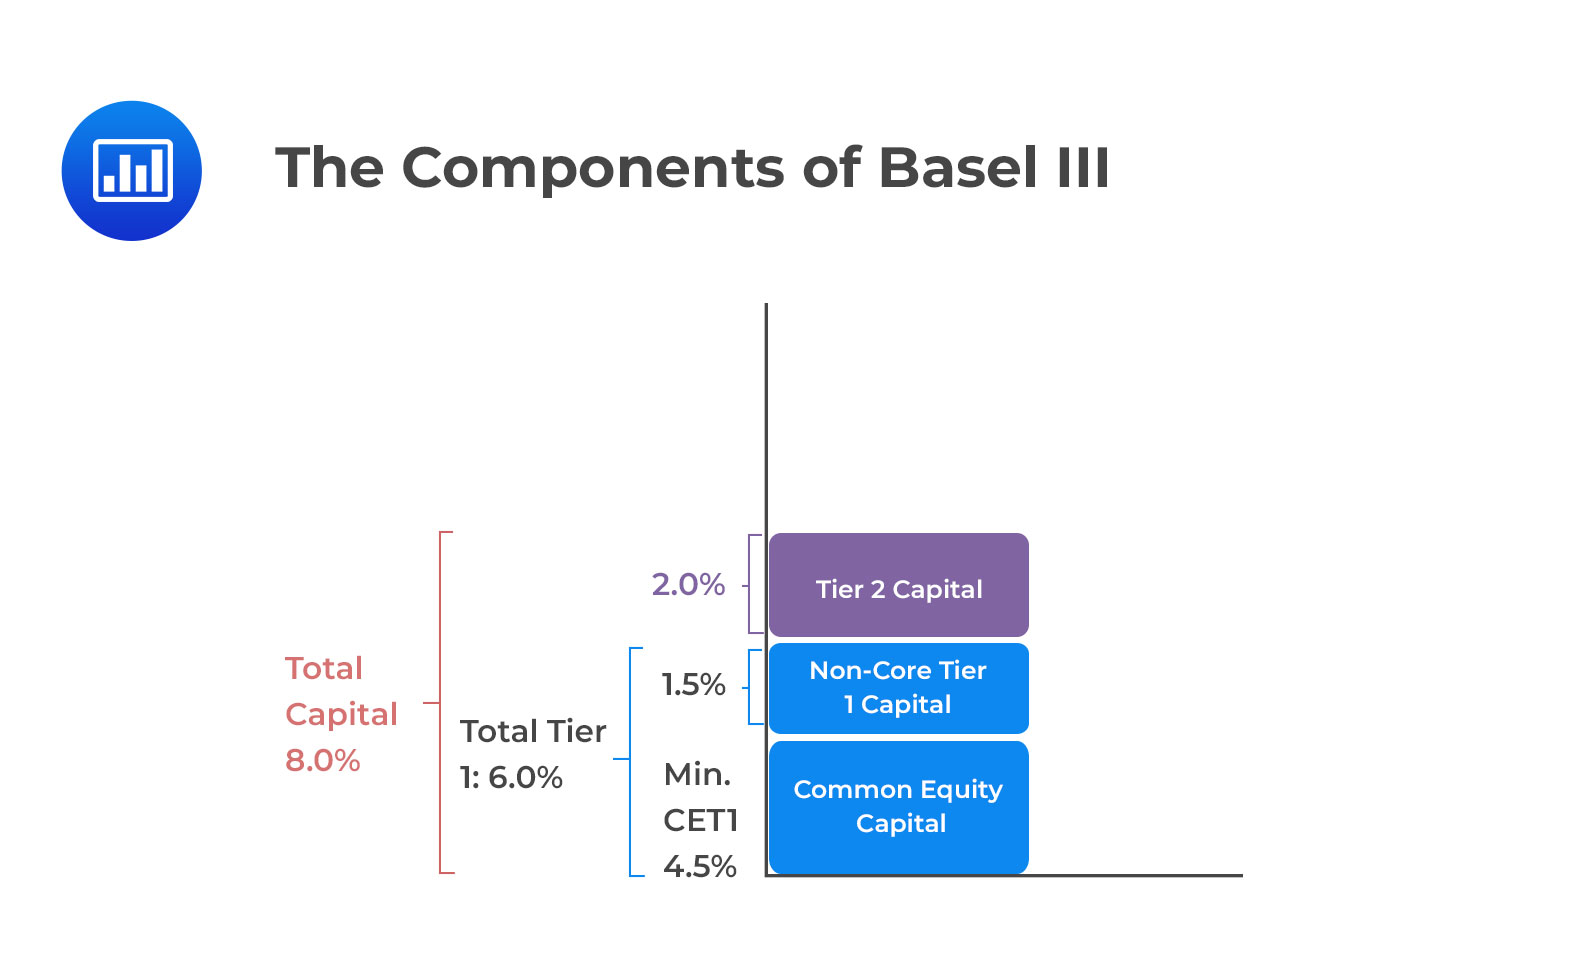
A bank’s capital is classified into hierarchical tiers, with the most vital tier as Common Equity Tier 1 Capital. This is the most loss-absorbing form of capital because it is permanent and places shareholders’ funds at risk of loss in the event of insolvency. It includes common stock, retained earnings, accumulated other comprehensive income and adjustments such as deduction of intangible assets, and deferred tax assets.
On the other hand, Tier 2 Capital includes instruments that are subordinate to depositors and general creditors of the bank. Also, these instruments have an original minimum maturity and meet specific other requirements. The minimum capital requirements outlined in Basel III are as follows:
 The capital adequacy of a bank is assessed through the following ratios:
This ratio ensures that banks can hold a reasonable amount of losses occurring during operations and to ascertain the bank’s loss-bearing capacity. Higher CRAR is indicative of stronger banks and more protection to investors. CRAR is computed by dividing Tier I and Tier II capital with Weighted Risk Assets.
The debt-equity ratio indicates the degree of a bank’s leverage. It expresses the proportion of debt and equity in the total fund structure of the bank. It is computed by dividing the total borrowings of the bank by shareholders’ equity. Shareholders’ equity, in this case, encompasses equity share capital and reserves, and surpluses. A higher ratio indicates that the depositors and creditors are less protected and vice versa.
This ratio reflects the risk associated with the bank’s investments. It is equal to the investment in government securities divided by the total investment of banks. Government securities are risk-free debt instruments, which means that they are the most secure. The higher the investment in government securities, the lower the risk, and vice versa.
You are provided with an excerpt from an annual report disclosure by hypothetical SBI Bank about its capital position. The excerpt shows the SBI Bank group’s capital ratios, amount of capital by tier, and risk-weighted assets by type.
$$ \textbf{Excerpt from Annual Report Disclosure of SBI Bank} $$
$$\begin{array}{l|r|r} \textbf{Capital Ratios} & \textbf{12/31/2019 (%)} & \textbf{12/31/2018 (%)}\\ \hline{\text{Common equity}\\ \text{tier 1 ratio}} & 15.7\% & 14.0\%\\ \hline\text{Tier 1 ratio} & 18.2\% & 16.0\%\\ \hline\text{Total capital ratio} & 22.2\% & 19.3\%\\ \end{array}$$
$$ \textbf{Total Regulatory Capital and Risk-Weighted Assets} $$
$$\small{\begin{array}{l|r|r} {}& \textbf{12/31/2019 } (\text{\$m}) & \textbf{12/31/2018 } (\text{\$m})\\ \hline\textbf{Regulatory Capital} &{} &{}\\ \hline \text{Common equity tier 1 capital} & 150,285 & 168426\\ \hline\text{Additional tier 1 capital} & 22,476 & 23,440\\ \hline\text{Tier 2 capital} & 36,580 & 38,270\\ \hline\text{Total regulatory capital} & 212,505 & 232,187\\ \hline\text{Risk-weighted assets} & 957,230 & 1,203,044\\ \end{array}}$$
$$ \textbf{Risk-Weighted Assets (RWAs) by Risk Types} $$
$$\small{\begin{array}{l|r|r} {}& \textbf{RWAs } (\textbf{\$bn}) & \textbf{Capital required* } (\textbf{\$bn})\\ \hline\text{Credit risk} & 685.80 & 62\\ \hline\text{Counterparty credit risk} & 92.100 & 8\\ \hline\text{Market risk} & 71.6 & 6\\ \hline\text{Operational risk} & 128.1 & 12\\ \hline\text{At 31 Dec 2019} & 977.60 & 87.98\\ \end{array}}$$
*Note: “Capital required” represents the pillar 1 capital charge at 9% of RWAs.
We will use the information above to answer the questions that follow:
The solution to 1: The capital ratios strengthened in 2019. SBI Bank’s Common Equity Tier 1 ratio increased from 14.0% of RWAs to 15.7% of RWAs. Its Tier 1 ratio also increased from 16.0% to 18.2%, and its Total Capital Ratio increased from 19.3% to 22.2%.
The solution to 2: SBI Bank’s total weighted assets dipped from $1,203,044 million in 2018 to $957,230 in 2019. This resulted in a change in its capital ratios in 2019.
The quality of assets is a significant aspect to assess the degree of the financial strength of a bank. Asset quality applies to the amount of existing and potential credit risk associated with the bank’s financial assets. Loans and investments in securities issued by other entities form the bank assets. The asset quality for loans, which are the significant bank assets, depends on the borrowers’ creditworthiness and the corresponding adequacy of adjustments for expected loan losses. Loans are measured at amortized cost and are reported on the balance sheet net of allowances for loan losses.
In contrast, the accounting treatment for investments in securities differs between IFRS and US GAAP. Under IFRS, financial assets are classified into three categories depending on the company’s business model for managing the asset and on the contractual cash flows of the asset. The three categories are: (1) measured at amortized cost (2) measured at fair value through other comprehensive income (FVOCI) and (3) measured at fair value through profit and loss (FVTPL).
On the other hand, US GAAP requires all equity investments to be measured at their fair value. Banks then recognize the changes in the fair value of these investments in net income. However, this does not apply to equity investments accounted for under the equity method or those resulting in the consolidation of the investee.
When determining the total amount of bank loans in the bank’s balance sheet, two line items are vital: loans and advances to banks and loans and advances to customers. Additionally, reverse repurchase agreements are a form of a collateralized loan made by a bank to a client. In a repurchase agreement, a bank client, who is the borrower, sells a financial asset to the bank, which is the lender and commits to repurchase the financial asset for a fixed price at a future date. The interest on borrowing is the difference between the selling price and the higher purchase price.
Note: The principal purpose of measuring the quality of the assets is to establish the composition of non-performing assets (NPAs) as a percentage of the total assets. The primary concern of all commercial banks is to keep the amount of non-performing loans as low as possible. This owes to the fact that high non-performing loans affect the profitability of the bank.
Typically;
$$\text{Asset quality}=\frac{\text{Non-performing loans}}{\text{Total loans}}$$
The following excerpt presents SBI Bank’s asset portion of the balance sheet, which is prepared according to IFRS.
$$ \textbf{Asset Composition as at 31 December} $$
$$\small{\begin{array}{l|r|r} \textbf{Assets} & \textbf{2019 } (\textbf{\$m}) & \textbf{2018 } (\textbf{\$m})\\ \hline\text{Cash and bank balances due from banks} & 46,670 & 44,716\\ \hline\text{Deposits with banks} & 425,137 & 386,605\\ \hline{\text{Federal funds sold and securities repurchased}\\ \text{under resale agreements}} & 219,265 & 250,810\\ \hline\text{Securities borrowed} & 125,955 & 117,252\\ \hline\text{Trading assets} & 402,687 & 392,973\\ \hline\text{Securities} & 270,801 & 309,902\\ \hline\text{Loans} & 951,540 & 885,608\\ \hline\text{Allowance for loan losses} & 7,239 & 7,067\\ \hline\text{Loans, net of allowance for loan losses} & 937,936 & 901,832\\ \hline\text{Accrued interest and accounts receivable} & 88,572 & 73,173\\ \hline\text{Buildings and equipment} & 35,002 & 34,974\\ \hline\text{Goodwill, MSRs, and other intangible assets} & 75,235 & 75,089\\ \hline\text{Other assets} & 135,613 & 132,919\\ \hline\textbf{Total assets} & \textbf{2,762,873} & \textbf{2,720,245}\\ \end{array}}$$
Notes: Cash and bank balances due from banks and deposits with banks are the bank’s most liquid assets. Federal funds sold and securities repurchased under repurchase agreements and securities borrowed are loans made against high-quality collateral.
Using the above information:
The calculation of each asset as a percentage of total assets is as follows:
$$ \textbf{Asset Composition as at 31 December} $$
$$\small{\begin{array}{l|r|r|r|r} \textbf{Assets} & \textbf{2019 } (\textbf{\$m}) & \textbf{2018 } (\textbf{\$m}) & \textbf{2019} & \textbf{2018}\\ \hline{\text{Cash and bank balances due from}\\ \text{banks}} & 46,670 & 44,716 & 1.70\% & 1.68\%\\ \hline\text{Deposits with banks} & 425,137 & 386,605 & 15.50\% & 14.48\%\\ \hline{\text{Federal funds sold and securities repurchased}\\ \text{under resale agreements}} & 219,265 & 250,810 & 8.00\% & 9.40\%\\ \hline\text{Securities borrowed} & 125,955 & 117,252 & 4.59\% & 4.39\%\\ \hline\text{Trading assets} & 402,687 & 392,973 & 14.69\% & 14.72\%\\ \text{Securities} & 270,801 & 309,902 & 9.88\% & 11.61\%\\ \hline\text{Loans} & 951,540 & 885,608 & 34.70\% & 33.18\%\\ \hline\text{Allowance for loan losses} & (34,447) & (34,619) & -1.26\% & -1.30\%\\ \hline\text{Loans, net of allowance for loan losses} & 917,093 & 850,989 & 33.45\% & 31.88\%\\ \hline\text{Accrued interest and accounts receivable} & 88,572 & 73,173 & 3.23\% & 2.74\%\\ \hline\text{Buildings and equipment} & 35,002 & 34,974 & 1.28\% & 1.31\%\\ \hline\text{Goodwill, MSRs, and other intangible assets} & 75,235 & 75,089 & 2.74\% & 2.81\%\\ \hline\text{Other assets} & 135,613 & 132,919 & 4.95\% & 4.98\%\\ \hline\textbf{Total assets} & \textbf{2,742,030} & \textbf{2,669,402} & \textbf{100.00%} & \textbf{100.00%}\\ \end{array}}$$
$$ \text{Liquid assets = Cash and bank balances + Bank deposits} $$
$$ \text{Liquid assets for 2019 = 1.70%+ 15.50% = 17.21%} $$
$$ \text{Liquid assets for 2018 = 1.68% + 14.48% = 16.16%} $$
Thus, the bank’s liquidity position increased from 2018 to 2019
$$ \text{Total Loans = Federal funds + Securities borrowed} $$
Loans (net of allowances) and including repurchase agreement loans and securities borrowed are:
$$ \text{For 2019: 8.00% + 4.59% = 12.59%} $$
$$ \text{For 2018: 9.40% + 4.39% = 13.79%} $$
On a relative basis, the bank’s lending activities decreased by 1.20% from 2018 to 2019.
$$ \text{Investments = Trading assets + Securities} $$
$$ \text{Investments for 2019 = 24.56%} $$
$$ \text{Investments for 2018 = 26.33%} $$
Investments seem to have declined by 1.77% on a relative basis from 2018 to 2019.
In the following example, we examine the asset quality from the credit quality perspective. As earlier mentioned, investment in securities often constitutes a significant amount of a bank’s assets, and those activities involve credit risk. Besides, a bank’s trading activities create exposure to counterparty credit risk. Further, other factors, such as liquidity, can also affect the value and marketability of a bank’s assets. Diversifying credit risk exposure across the entire asset base and among counterparties is an essential aspect of asset quality.
The following excerpt presents a hypothetical SBI Bank’s annual report disclosure about the credit quality of its financial instruments. It shows the distribution of financial instruments by credit quality.
$$ \textbf{Excerpt from Annual Report Disclosure of SBI Bank as at 31 December} $$
$$\small{\begin{array}{l|l|r|r} {}&{}&2019 (\text{ \$m})&2018 (\text{ \$m})\\ \hline\textbf{Neither past due nor impaired}&\text{Strong credit quality}&1,279,005&1,253,318\\{}& \text{Good credit quality}&273,000&290,434\\ {}&\text{Satisfactory credit quality}&203,092&232,275\\ {}&\text{Sub-standard credit quality}&20,011&20,116\\ \hline{}&\text{Past due but not impaired}&2,945&6,947\\ \hline{}&\text{Impared}&17,991&25,539\\ \hline{}&\text{Total gross amount}&1,796,044&1,828,629\\ \hline{}&\text{Impairment allowances}&(8,100)&(11,500)\\ \hline{}&\textbf{Total}&\textbf{1,787,944}&\textbf{1,817,129}\\ \end{array}}$$
Using the above information:
$$\small{\begin{array}{l|l|ll|r} {} & {}&{\textbf{Percentage of}\\ \textbf{the total gross}\\ \textbf{amount as at}\\ \textbf{31 December}} &{}& {\textbf{Percentage change}\\\textbf{in dollar amount}}\\ \hline{}&{} & 2019 & 2018 & {}\\ {\text{Neither past}\\ \text{due nor impaired}} & \text{Strong credit quality} & 71.21\% & 68.54\% & 2.05\%\\ {}& \text{Good credit quality} & 15.20\% & 15.88\% & -6.00\%\\ {}& \text{Satisfactory credit quality} & 11.31\% & 12.70\% & -12.56\%\\ {}& \text{Sub-standard credit quality} & 1.11\% & 1.10\% & -0.52\%\\ \hline{}& \text{Past due but not impaired} & 0.16\% & 0.38\% & -57.61\%\\ \hline\text{}& \text{Impaired} & 1.00\% & 1.40\% & -29.55\%\\ \hline{}& \text{Total gross amount} & 100.00\% & 100.00\% & -1.78\%\\ \hline{} & \text{Impairment allowances} & -0.45\% & -0.63\% & -29.57\%\\ \end{array}}$$
The proportion of assets invested in strong credit quality instruments improved. I.e. The percentage of total investment assets invested in strong credit quality instruments increased from 68.54% in 2018 to 71.21% in 2019 i.e .(\(\frac{$1,253,318}{$1,828,629} = 68.54\%\); \(\frac{$1,279,005}{$1,796,044} = 71.21\%\)).
Yes. Based on the excerpt, the change in SBI’s impairment allowances in 2019 reflects the change in the credit quality of financial instruments. In general, the expected amount of impairment allowances is linked to the amount of impaired assets. The 29.57% decrease in the amount of SBI’s impairment allowances in 2019 corresponds to the 29.55% decrease in impaired assets. The amount of impairment allowances as a percentage of the impaired assets was 45.03% in 2018 (i.e., \(\frac{$11,500}{$25,539}\) \(= 45.03\%\)) and 45.02% in 2019 (i.e., \(\frac{$8,100}{$17,991}\) \(= 45.02\%\) for 2019), which is relatively stagnant.
Management capability is another crucial constituent of the CAMELS model that guarantees the growth and endurance of a bank. Active management involves identifying and exploiting appropriate profit opportunities while managing risk. These risks may include credit risk, market risk, operating risk, legal risks, and other risks. Indicators of management effectiveness include internal sound controls, transparent management communication, and financial reporting quality. The following ratios are required to assess management efficiency:
This ratio indicates the efficiency of the bank’s management in the utilization of the deposits (including receivables) available into advances with maximum returns. Savings deposits, demand deposits, term deposits, and deposits of other banks are included in total deposits. The higher the ratio, the better it is, and vice versa.
This ratio indicates the efficiency and productivity of the bank’s human resources. It is calculated by dividing the total business by the total number of employees. A higher ratio is a good indication and vice versa.
This ratio reflects the association between interest income and total advances issued by the bank. Higher return on advances results in more returns earned on advances. A higher ratio of return on advances indicates higher productivity and profitability of funds and vice versa.
All companies’ earnings should be of high quality and upward trading. Earnings are considered high quality if they are adequate, i.e., providing a rate of return above the cost of capital as well as sustainable. Also, earnings should ideally be derived from recurring sources.
Banks use estimates in valuing investment securities that must be measured at fair value. Estimates used in the valuation of these securities may lead to biased earnings. Both IFRS and US GAAP use the concept of a fair value hierarchy based on the types of inputs used in determining the fair value of financial assets and liabilities. There are three “levels” of the fair value hierarchy:
Level 1 inputs are the quoted prices of identical financial assets or liabilities in the active markets. In determining the fair value of financial assets and liabilities, level 2 inputs are vital. They include quoted prices for identical financial assets in the active and inactive markets and observable data. Observable data include interest rates, yield curves, credit spreads, and implied volatility. Finally, level 3 inputs are unobservable and hence subjective. For example, fair value may be derived from models like an option-pricing model which employs an unobservable and subjective estimate of the instrument’s market volatility. It can also be based on estimated future cash flows discounted at an estimated discount rate.
In practice, banks usually use the fair value hierarchy to label their assets. For example, level 2 securities are those whose value was determined using level 2 inputs. Besides, they can use the hierarchy to label their valuation methodology. For example, level 2 methodology is defined as one that uses level 2 inputs.
Similar to other companies, the quality of a bank’s earnings is affected by other subjective estimates like goodwill impairment, recognition of deferred tax assets, and recognition of contingent liabilities.
Concerning a bank’s sustainability, it is crucial to examine the composition of the bank’s earnings. For a typical bank, significant sources of earnings are (1) net interest income (2) service income, and (3) trading income. Trading income is typically the most volatile. Therefore, a higher proportion of net interest income and service income is typically more sustainable than trading income. Furthermore, lower volatility within net interest income is desirable: Highly volatile net interest income could indicate excessive interest rate risk exposure.
The following information is obtained for the evaluation of SBI Bank’s sources of income.
$$ \textbf{Three-Year Summary of SBI’s Total Operating Income} $$
$$\begin{array}{l|r|r|r} {}& \textbf{2019} & \textbf{2018} & \textbf{2017}\\ \hline\text{Net interest income} & \$29,926 & \$32,844 & \$35,018\\ \hline\text{Net interest income} & \$12,464 & \$14,392 & \$15,644\\ \hline\text{Net trading income} & \$7,452 & \$6,723 & \$4,760\\ \hline\text{Net income expense from financial securities} & -\$1,466 & \$2,732 & \$3,673\\ \hline\text{Financial instruments gains less losses} & \$1,662 & \$2,345 & \$1,612\\ \hline \text{Dividend income} & \$122 & \$150 & \$338\\ \hline\text{Net insurance premium income} & \$11,178 & \$11,582 & \$13,148\\ \hline\text{Other operating income expense} & (\$742) & \$1,284 & \$1,360\\ \hline\text{Total operating income} & \$60,596 & \$72,052 & \$75,553\\ \end{array}$$
Based on the above information:
$$ \textbf{Three-Year Summary of SBI’s Total Operating Income} $$
$$\begin{array}{l|r|r|r} {}& \textbf{2019} & \textbf{2018} & \textbf{2017}\\ \hline\text{Net interest income} & 49.4\% & 45.6\% & 46.3\%\\ \hline\text{Net interest income} & 20.6\% & 20.0\% & 20.7\%\\ \hline\text{Net trading income} & 12.3\% & 9.3\% & 6.3\%\\ \hline\text{Fair value net income/(expense) from financial} & -2.4\% & 3.8\% & 4.9\%\\ \hline\text{Gains less losses from financial investments} & 2.7\% & 3.3\% & 2.1\%\\ \hline\text{Dividend income} & 0.2\% & 0.2\% & 0.4\%\\ \hline\text{Net insurance premium income} & 18.4\% & 16.1\% & 17.4\%\\ \hline\text{Other operating income/(expense)} & -1.2\% & 1.8\% & 1.8\%\\ \hline\text{Total operating income} & 100.0\% & 100.0\% & 100.0\%\\ \end{array}$$
The solution to 1: The net interest income forms SBI’s primary source of operating income. In 2019, 49.4% (\(\frac{$29,926}{$60,596}=49.4\%\)) of total operating income was earned from net interest income in 2019.
The solution to 2: SBI Bank earned 12.3% = \((\frac{$7,452}{$60,586})\) of total operating income from trading activities.
The solution to 3: The operating income for SBI Bank declined each year, from 2017 to 2019. The composition of operating income was relatively constant from 2017 to 2019, with an average of around 47% from net interest income and 20% from fee income.
As previously mentioned, banks have systemic importance. Deposits constitute the primary component of a bank’s current liabilities. In most banks, deposits are insured by the government insurers up to a certain amount; thus, liquidity is a crucial focus of regulators. This is in that the failure of a bank to fulfill its liability obligations can lead to the collapse of the entire economy.
The Basel III framework introduced two minimum liquidity standards after the sudden illiquidity accompanying the financial crisis of 2008, which include:
The liquidity coverage ratio is expressed as the minimum percentage of a bank’s expected cash outflows that must be held in highly liquid assets. It is computed as:
$$\text{LCR}=\frac{\text{Highly liquid assets}}{\text{Expected cash outflows}}$$
Highly liquid assets are those that are immediately convertible into cash, while expected cash flows are the estimated one-month liquidity needs in a stress scenario. A lower LCR implies higher liquidity risk and vice versa. The standard recommends a minimum LCR of 100%.
NSFR is expressed as the minimum percentage of a bank’s required stable funding that should be extracted from available stable funding. It is calculated as:
$$\text{NSFR}=\frac{\text{Available stable funding}}{\text{Required stable funding}}$$
It measures the liquidity of funding sources relative to the liquidity needs of the assets. Available stable funding (ASF) is a function of the composition and maturity distribution of a bank’s funding sources (i.e., capital, deposits, and other liabilities), whereas required stable funding is a function of the composition and maturity distribution of the bank’s asset base. Available stable funding is determined based on an ASF factor that is assigned to each funding source, as shown in the table that follows:
$$\small{\begin{array}{l|l} \textbf{ASF Factor} & \textbf{Funding Component}\\ \hline{100\%} & \text{Regulatory capital minus Tier 2 instruments maturing in less than a year.}\\ {}& \text{Other capital instruments and liabilities with a maturity greater than or equal to one year.}\\ \hline 95\% & {\text{Stable demand deposits and term deposits with a maturity of less than one}\\ \text{year from retail and small business customers.}}\\ \hline 90\% & {\text{Less stable demand deposits and term deposits with maturity less than}\\ \text{one year from retail and small business customers.}}\\ \hline 50\% & {\text{Funding from non-financial corporates with maturity of less than a year,}\\ \text{operational deposits, funding from sovereigns, public sector entities with}\\ \text{less than one-year maturity, multilateral and national development banks.}}\\
\hline0\% & \text{All other liabilities.}\\ \end{array}}$$
NSFR relates the liquidity needs of a bank’s assets to the liquidity provided by the bank’s liabilities (i.e., funding sources). Longer-dated liabilities are considered more stable and hence suitable to fund assets with longer maturities (e.g., long-term loans). Moreover, deposits from retail and small business clients are considered more stable than deposits from corporate clients. A lower NSFR implies a higher liquidity risk and vice versa. Finally, the standards recommend a minimum NSFR of 100%.
Basel III also recommends other liquidity monitoring metrics, which include the concentration of funding and maturity mismatch. Relatively concentrated funding indicates a bank’s reliance on relatively few funding sources. This poses a problem when the sources withdraw funding, resulting in increased liquidity risk for the bank.
Maturity mismatch occurs when the asset maturities differ significantly from the maturity of the liabilities (funding sources). The higher the mismatch, the higher the liquidity risk for the bank. For example, sometimes banks try to maximize the spread between lending and borrowing rates by borrowing at low, short-term rates and lending at higher, longer-term rates. This mismatch in assets and liabilities exposes the bank to liquidity risk if it is unable to roll over its borrowings at reasonable rates. The higher the maturity mismatch between assets/liabilities, the higher the liquidity risk.
The following excerpt displays the following liquidity metrics for SBI Bank’s principal operating entities, individual liquidity coverage ratio (LCR) and net stable funding ratio (NSFR). Assume that all the Group’s principal operating entities were within the LCR risk tolerance level established by the Board as of 31 December 2019. Also, On 31 December 2019, the Group’s principal operating entities were within the NSFR risk tolerance level established by the Board. Finally, all principal operating entities were within the risk tolerance levels set for depositor concentration and term funding maturity concentration. These risk tolerances were established by the SBI’s Board as at 31 December 2019.
$$ \textbf{SBI Bank Liquidity Disclosure: Operating Entities’ Liquidity Measures} $$
$$\small{\begin{array}{l|rr|r} {}& \textbf{LCR}&{} & \textbf{NSFR}\\ \hline {}& \text{Dec-19} & \text{Dec-18} & \text{Dec-19}\\ \hline{}& \% & \% & \%\\ \hline\text{State Bank of India (Canada) (SBICAN)} & 144 & 128 & 137\\ \hline\text{State Bank of India (California) (SBICAL)} & 206 & 171 & 178\\ \hline\text{SBI (Mauritius) LTD (SBIML)} & 175 & 210 & 133\\ \hline\text{Nepal SBI Bank Limited (NSBL)} & 151 & 137 & 141\\ \hline\text{Bank SBI Botswana Ltd (BSBIBL)} & 143 & 148 & 141\\ \hline\text{Bank SBI Indonesia (BSBII)} & 239 & 220 & 183\\ \hline\text{Bank of Bhutan Limited (BoBL)} & 163 & 163 & 160\\ \hline\text{Commercial Indo Bank LLC (CCIBL)} & 274 & 204 & 70\\ \end{array}}$$
Based on the information above:
The solution to 1: Commercial Indo Bank LLC (CCIBL) had the highest level of liquid assets relative to its liquidity needs in a stress scenario. As of 31 December 2019, it had the highest LCR of 274% as compared to other SBI operating entities.
The solution to 2: Based on the above information, Bank SBI Indonesia (BSBII) had the most stable funding relative to its required need for stable funding. Its 2019 NSFR of 183% is higher than that of any of the other SBI entities.
The solution to 3: Commercial Indo Bank LLC (CCIBL) is the furthest away from achieving the Basel III standard of NSFR greater than 100%. Its NSFR of 70% is the lowest relative to any of the other SBI entities. However, the example does not provide sufficient information to confirm the reason.)
Interest rate risk is the key market risk that impacts a bank’s earnings. A bank’s interest rate risk is the result of differences in maturity, rates, and repricing frequency between the bank’s assets and its liabilities. The differences in rates, maturity, and repricing frequency between the bank’s assets and liabilities expose the bank to interest rate risk. An increase in interest rates would increase the bank’s net interest income. This would occur because banks have more assets than liabilities. However, in reality, the terms of a bank’s assets and liabilities differ.
Banks adjust their balance sheets following opportunities presented in the market at any given time. For example, central banks reduced the short-term interest rates following the 2008 financial crisis allowing banks to borrow at lower rates. Various banks increased their duration risk to exploit this interest rate scenario.
The effect of a change in the shape of the yield curve is different from bank to bank, depending on the differences in the composition of their assets and liabilities. Banks usually disclose exposure to a wide variety of market and nonmarket risks in the MD&A section of their annual reports.
The value at risk (VaR) is another tool that banks use to measure and monitor market risk. VaR is a way to estimate the amount of potential loss based on simulations that incorporate historical pricing information.
The following excerpt shows SBI’s annual sensitivity analysis.
$$ \textbf{Net Interest Sensitivity (Audited)} $$
$$\small{\begin{array}{l|r|r|r|r|r|r} {}& {\text{Indian rupee}\\ \text{bloc}} & {\text{Canadian dollar}\\ \text{bloc}} & {\text{Rest of America’s}\\ \text{bloc}} & \text{Indonesian rupiah} & {\text{Nepalese rupee}\\ \text{bloc}} & \text{Total}\\ \hline {}& (\text{\$m}) & (\text{\$m}) & (\text{\$m}) & (\text{\$m}) & (\text{\$m}) & {\text{(\$m)}}\\ \hline\text{Change in 2019 net}\\ \text{interest income arising}\\ \text{from a shift}\\ \text{in yield curves of:} &{} &{} &{} &{} &{} &{}\\ \hline \text{+25 basis points at}\\ \text{the beginning of}\\ \text{each quarter} & 806 & 98 & 705 & 532 & 263 & 2404\\ \hline \text{-25 basis points at}\\ \text{the start of each}\\ \text{quarter} & -1194 & -92 & -998 & -544 & 60 & -2768\\ \end{array}}$$
From the above excerpt, SBI’s planned net interest income would decrease by $2,768 million if the yield curves shifted downward by 25 basis points at the beginning of each quarter.
Based on the above information, a decrease in interest rates would significantly decrease the bank’s earnings. Why would central banks lower interest rates so significantly following the financial crisis to prop up the financial sector?
An interest rate sensitivity table is a fixed presentation and thus assumes that the relation between the structure of assets and liabilities in place at the time would remain stationary. Following the financial crisis, the central banks’ actions reduced interest rates at which banks could borrow (effectively, to near zero). In contrast, the rates that banks were able to charge their loan customers were—while still low—far higher than their borrowing costs. Further, the central banks’ actions were not intended solely to prop up banks’ earnings but also to provide liquidity and stimulus to the overall economy.
Previously, we mentioned that an analyst using the CAMELS approach to examine a bank undertakes analysis and assigns a numerical rating of 1 through 5 to each component. A rating of 1 is the best rating. It shows the best practices in risk management and performance and generating the least concern for regulators. In contrast, a rating of 5 is the worst rating. It shows the weakest performance and risk management practices and generating the highest degree of regulatory concern.
The CAMELS approach is prone to indeterminacy, subjectivity, and inconsistency. There are situations where the analysis of the bank accounting records cannot determine the appropriate score to assign, for example, an average or below-average score. It is relatively easy to spot the good and bad indicators, not so the in-betweens. This is a problem of indeterminacy. However, when the bank analyst is forced to make a judgment, this is exposed to subjectivity. Besides, different analysts have differing levels of expectations and perspectives. In conclusion, the CAMELS approach has failed to recognize weaknesses in banks before a crisis.
Question
Michael Johnson is an investment analyst at Capital Group. His manager has tasked him to review vital performance ratios for XYZ Bank, a bank in which Capital Group has invested. The ratios are presented in the following exhibit:
$$ \textbf{Exhibit 1: Key Performance ratios for XYZ Bank} $$
$$\begin{array}{l|r|r|r} {}& \textbf{2019} & \textbf{2018} & \textbf{2017}\\ \hline\text{Common equity Tier 1 capital ratio} & 7.40\% & 8.20\% & 8.80\%\\ \hline\text{Tier 1 capital ratio} & 8.20\% & 9.30\% & 10.10\%\\ \hline\text{Total capital ratio} & 11.60\% & 11.50\% & 11.60\%\\ \hline\text{Liquidity coverage ratio} & 112.80\% & 110.60\% & 108.30\%\\ \hline\text{Net stable funding ratio} & 104.10\% & 102.40\% & 101.90\%\\ \hline\text{Total trading VaR (all market factors)} & \$20 & \$22 & \$24\\ \hline\text{Total trading and credit portfolio VaR} & \$24 & \$27 & \$30\\ \end{array}$$
Based on Exhibit 1, Johnson should conclude that over the past three years, XYZ Bank’s:
A. Sensitivity to market risk has improved.
B. Capital adequacy has improved.
C. Liquidity position has declined.
Solution
The correct answer is A.
There has been a declining trend in the two value at risk (VaR) measures over the past three years. We can conclude that XYZ Bank’s sensitivity has improved, or its exposure to market risk has declined over the period.
B is incorrect. The declining trend in the three capital adequacy measures—common equity Tier 1 capital ratio, Tier 1 capital ratio, and total capital ratio—indicate a decline in XYZ Bank’s capital adequacy. This trend suggests that XYZ Bank is using less Tier 1 capital, and more Tier 2 capital, which indicates an overall decline in capital adequacy.
C is incorrect. The liquidity coverage ratio and the net stable funding ratio have increased over the past three years, suggesting an improvement in XYZ Bank’s liquidity position.
Reading 14: Analysis of Financial Institutions
LOS 14 (c) Explain the CAMELS (capital adequacy, asset quality, management, earnings, liquidity, and sensitivity) approach to analyzing a bank, including key ratios and its limitations.
Strengthen your CFA Level II risk management preparation with realistic exam-style practice. Master banking supervision concepts before test day.
Offered by AnalystPrep


Get Ahead on Your Study Prep This Cyber Monday! Save 35% on all CFA® and FRM® Unlimited Packages. Use code CYBERMONDAY at checkout. Offer ends Dec 1st.