


Intraday Liquidity Risk Management
After completing this reading, you should be able to: Identify and explain the... Read More

After completing this reading, you should be able to:
According to the Basel Committee, retail banking is characterized by the following:
Retail banks receive deposits from customers and then create a pool of funds that are lent to consumers and small businesses. Loans take various forms, including:
The main risk associated with retail banking is credit risk. This is the risk that a borrower will default on debt.
Other than credit risk, retail banking has the following risks:
Retail banking is exposed to credit risk that has very different dynamics compared to the credit risk of commercial and investment banking businesses.
To begin with, retail credit exposure comes in bite-sized pieces. The implication of this is that a single customer’s default does not trigger a financial loss big enough to threaten a bank. Commercial and investment banking exposures can be large and expensive. Consequently, a single corporate borrower’s default can subject the business to significant financial turmoil.
Besides, retail customers tend to be financially independent with little economic ties. Indeed, the financial fortunes of a retail customer can be very different from those of other customers. In contrast, corporate and commercial business contains concentrated exposures, with corporations having significant economic/industrial/geographical ties.
For this reason, retail banks are able to come up with more reliable estimates of the percentage loss of a portfolio whose default they “anticipate.” Note that default events trigger loss. Being in a position to reliably estimate the expected loss has two implications:
By contrast, the expected loss from corporate lending is much more difficult to model and is often a highly fluctuating amount.
Retail portfolios also tend to have easily noticeable warning signals that can be used to predict a rise in defaults. For example, a customer embroiled in some kind of financial strain might fail to make a minimum payment on his credit card. Once such a warning signal is received, a bank is able to take preemptive action to reduce credit risk. In such instances, a bank can:
It is much more difficult to notice warning signs in commercial credit portfolios. By the time a problem becomes obvious, it is often too late to do much about it.
Since retail credit risk is relatively predictable, retail banks are required to set aside a relatively small amount of risk capital compared to their commercial counterparts. However, retail credit risk has a dark side.
An unforeseen systematic event may influence the behavior of credits in a bank’s retail portfolio, triggering large-scale losses that exceed the expected levels. The dark side of retail credit risk can be traced down to four causes:
Over the years, a series of measures have been taken in an attempt to reduce retail credit risk and protect banks from crumbling as a result of a large number of defaults. One of these is the Dodd-Frank Act.
The Dodd-Frank Act was a massive piece of U.S. legislation passed in 2010. It was tailored to restore stability in the financial system and avert a repeat of the events that led to the 2007/09 financial crisis. The act targeted banks, mortgage lenders, and credit rating agencies. It sets out several provisions. In particular, it gives the Financial Stability Oversight Council:
The Dodd-Frank act led to the establishment of the Consumer Financial Protection Bureau (CFPB) to further help deal with the dark side of retail credit risk. The Consumer Financial Protection Act (CFPA) (established under CFPB) requires banks to evaluate qualified mortgages and the ability to pay. If a mortgage is labeled a “qualified mortgage” (QM), then a creditor can assume that the borrower has met this requirement.
A qualified mortgage must have several features:
Loan originators making ability-to-pay determinations must consider eight underwriting factors:
A credit scoring model uses statistical techniques to convert information about a credit applicant or an existing account holder into numbers. The numbers are then combined (usually added) to form a score. The higher the score, the higher the probability of repayment by the borrower and the lower the overall risk.
Credit scoring is important in several ways:
The distinction of credit scoring models is their ability to consistently weight and treat the information items they extract from applications and/or credit bureau reports. In credit industry parlance, the term “item” refers to a “characteristic,” such as the questions on a credit application or the entries in a credit bureau report. Each characteristic attracts an entry or rather an answer given by an applicant. This answer is called an attribute. The following are a few examples:
$$ \begin{array}{c|c} \textbf{Characteristic} & \textbf{Attribute} \\ \hline \text{Number of years at residence} & \text{3 years} \\ \hline \text{Annual income} & $ \text{30,000} \\ \hline \text{Years in previous job} & \text{2 years} \\ \hline \text{Purpose of loan} & \text{Home purchase} \\ \end{array} $$
Some of the statistical techniques used to weight the information in a credit report include mathematical programming, linear or logistic regression, or classification trees, and genetic algorithms.
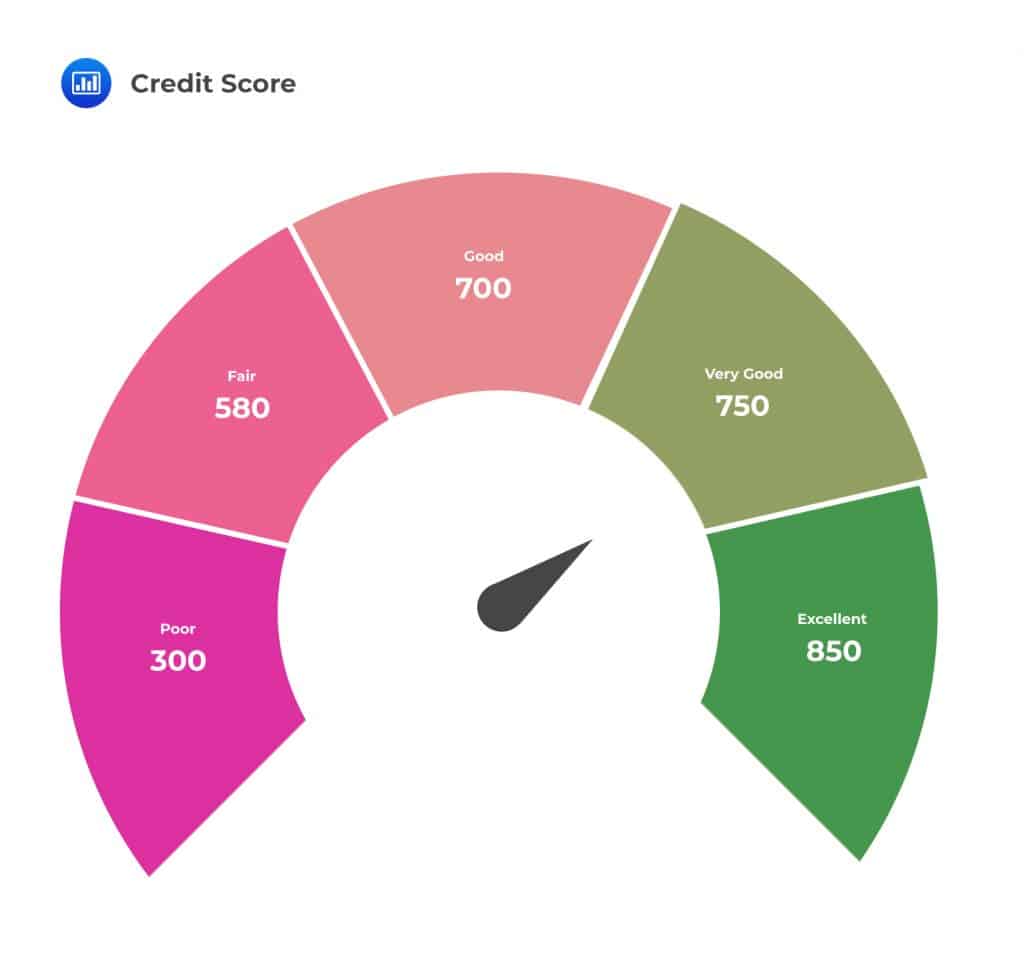
Credit bureau scores are developed by credit bureaus. They are often known as FICO scores because the method adopted to produce them was crafted by the Fair Isaac Corporation. They take 5 different types of borrower information into account: payment history, types of credit used, length of credit history, new credit accounts, and current level of indebtedness.
FICO (formerly the Fair Isaac Corporation) is a well-established analytics software company that provides credit data to both consumers and businesses. FICO scores range between 300 and 850, with scores above 650 considered “good”. A score of 579 or less often makes it difficult for a borrower to obtain financing. In the United States and Canada, bureau scores are maintained and supplied by companies such as Equifax and TransUnion.
 Credit bureau models are preferred by most banks because they are cost-friendly, easy to install, and provide a broad overview of an applicant’s creditworthiness.
As the name suggests, pooled models gather credit data from a wide range of lenders with similar credit portfolios. For example, credit card data from multiple banks may be combined to develop a revolving credit pooled model.
Compared to credit bureau models, pooled models are more costly to develop and implement. However, they come with more flexibility and can be “trained” on a specific market segment, such as revolving credit. It is, nevertheless, imperative to note that they are not as costly or flexible as custom models.
A custom model is developed by a lender using data gathered from its own credit application pool. They are tailored to screen for a specific application profile for a specific lender’s product. In fact, some banks have carved a reputation for developing models in certain credit segments. A robust custom model can give a bank an edge when selecting customers.
In general, 5 different credit files exist for every individual with a credit history:
During the credit evaluation process, credit originators scrutinize several key variables. These are:
$$ \text{DTI}=\cfrac { \text{monthly debt payments} }{ \text{monthly income} } $$
By looking at the DTI, a lender is able to tell whether the credit applicant has room for another loan.
Mortgage products also differ according to the type of information a lender demands before approval:
Credit-scoring models developed in the early days didn’t consider the actual probability of default assigned to a credit applicant. Instead, the models ranked applicants in relation to their relative risk. The goal among lenders was not to come up with an absolute measure of default probability. Rather, they aimed at choosing an appropriate cutoff score. All applicants with a credit score, at least as much as the cutoff score, were accepted, based on subjective criteria.
The figure below illustrates the distribution of “good” and “bad” accounts by credit score.
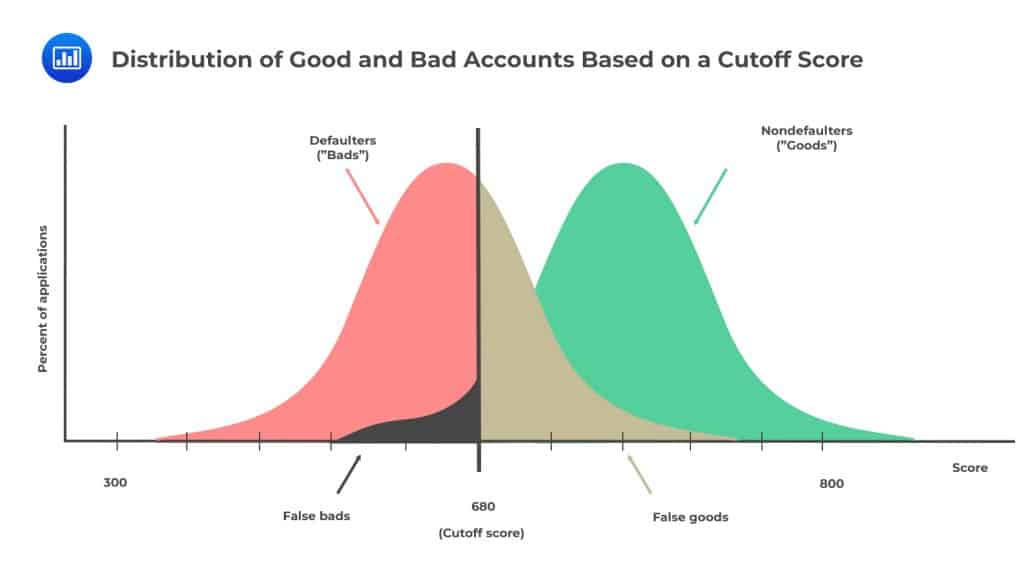 In this case, the cutoff score has been set at 680, implying that only applications scoring that value, or higher, would be accepted. The firm would avoid lending money to the body of bad customers to the left of the vertical line. However, such a decision would lock out the smaller body of good accounts to the left of the line (false bads). If the cutoff were to be moved further to the right, the lender would be successful in cutting off an even higher fraction of bad accounts, but the fraction of false bads would also go up. In such a scenario, the lender may succeed in reducing the default rate but struggle to increase the business volume over time, unless the scoring system is relaxed a bit.
Once a lender has established the cutoff score, it can comfortably determine, based on its actual experience, the loss rate and profitability of the retail product. In order to optimize the profit margin, product by product over time, the bank can adjust the cutoff score.
Thanks to a relatively bigger customer base, retail banking has an edge over wholesale banking when it comes to the accumulation of product data to assess the performance of a scoring model. Most lenders tend to update their statistics on loss rates and profitability on a quarterly basis.
The Basel Accord mandates banks to cluster their portfolios into subgroups that share similar loss attributes and calibrate score bands that are indicative of different levels of risk. The PD and LGD must be estimated for each subgroup. The implied PD is a function of the historical loss rate and the LGD. For example, a PD of 5% would be attached to a portfolio that has a loss rate of 3% and a recovery rate of 40% (PD = 3%/60%).
Lenders use a credit scoring model to help them predict – with reasonable accuracy – which applications will be good or bad in the future. To achieve this, a scorecard must be able to differentiate between “good” and “bad” by assigning high scores to good credits and low scores to poor ones. A good model minimizes the overlapping area of the distribution of the good and bad credits, as we saw above in The Distribution of Good and Bad Accounts Based on a Cutoff Score.
For this reason, it is important to come up with tools that can be used to measure the performance of a scorecard. The most popular tools today are the cumulative accuracy profile (CAP) and the accuracy ratio.
The figure below illustrates how the CAP works.
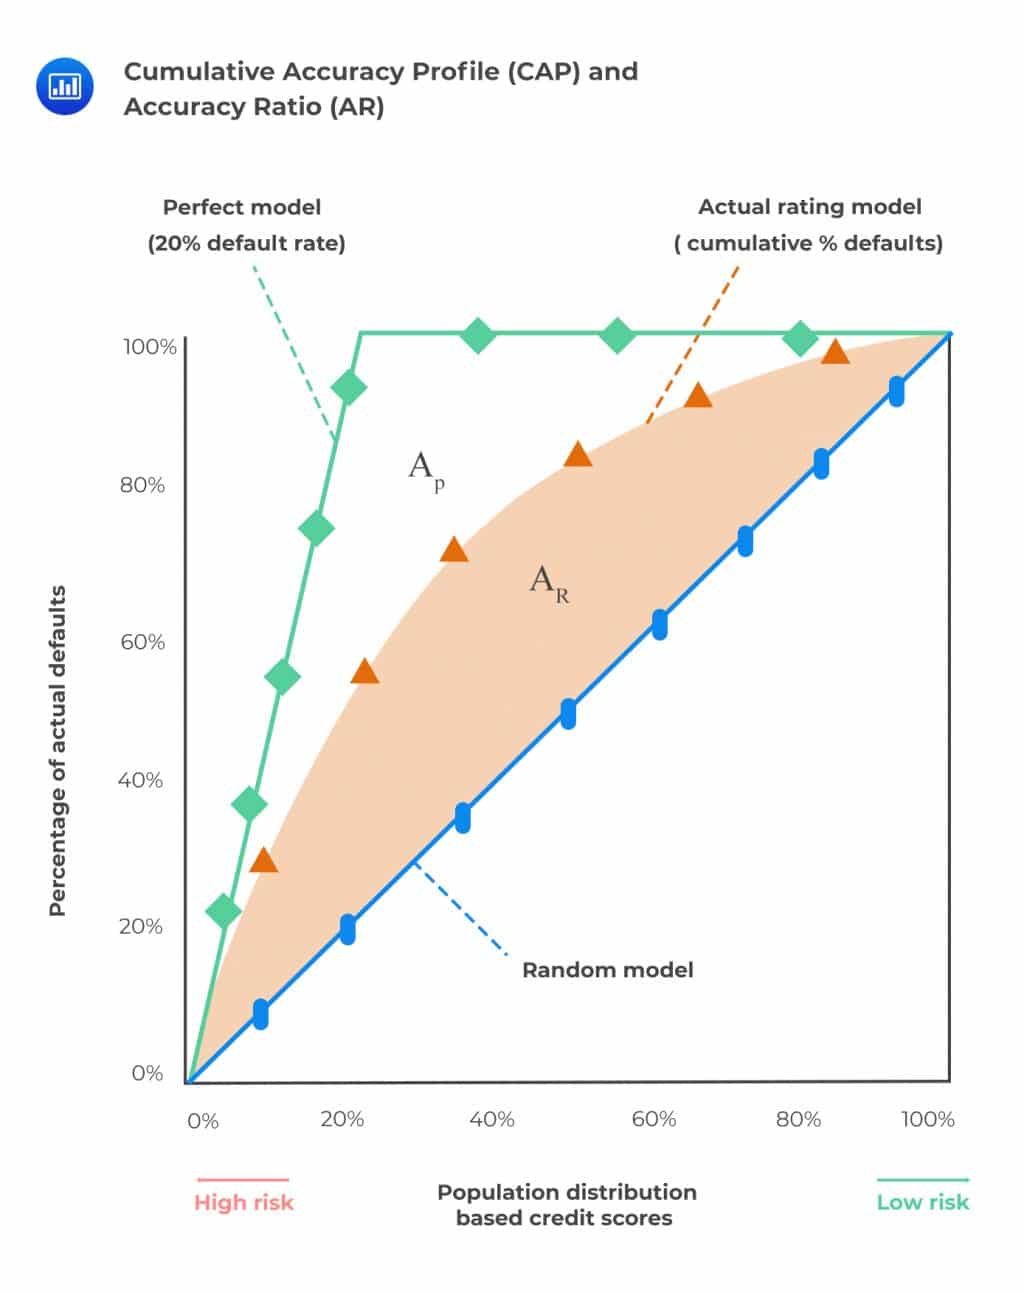 The horizontal axis shows the percentiles of the predicted default scores in the data set. The vertical axis, on the other hand, shows the actual defaults in percentage terms obtained from the bank’s records.
For illustration purposes, let’s assume that according to the bank’s scoring model, 20 percent of the accounts will default in the next 12 months. If the model were perfect, the actual number of defaults recorded over that time period would correspond to the second decile of the score distribution – the perfect model line in the figure.
On the other hand, the model can also be totally uninformative such that it cannot differentiate between good and bad credit. In that case, we would expect to capture a proportional fraction (e.g. 20% of the defaulters with about 20% of the observations or 10% of the defaulters with about 10% of the observations). This would yield a CAP curve along the 45-degree line, i.e., the “Random Model” curve.
The observed cumulative default line represents the actual defaults observed by the bank. A lender would aim to develop a model whose results are relatively close to the perfect model line.
The area under the perfect model is denoted \({\text{A}}_{\text{P}}\), while the area under the actual (current) rating model is denoted \({\text{A}}_{\text{R}}\).
The accuracy ratio, \(\text{AR} = \frac {\text{AR}}{\text{AP}}\). It is the ratio of the performance improvement of the current model over the random model to the performance improvement of the perfect model over the random model. The closer this ratio is to 1, the more accurate the model is.
$$ \text{AR}=\cfrac { \text{area between current model and diagonal} }{ \text{area between perfect model and diagonal} } =\cfrac { { \text{A} }_{ \text{R} } }{ { \text{A} }_{ \text{P} } } $$
A scoring model should be updated regularly to reflect changes in the underlying population of credits as well as changes in the products being offered.
In the credit market, it is all about the complex interplay between risk and reward. On the one hand, banks can concentrate more on default probability and offer their products to highly creditworthy individuals. The problem with such a policy is that the bank limits its profitability. For example, credit cards issued to creditworthy customers may end up not being used at all. Such customers may also be able to extract favorable (less profitable) credit terms from the lender.
On the other hand, a profit-driven bank will target individuals with a higher probability of default risk because these individuals are prepared for a higher rate of interest and, therefore, the bank will make more money from every contract. What’s more, a person with an unstable income stream is more likely to use a credit card, for example. But with such a policy comes the risk that the customer may be unable to pay loaned funds, leading to losses for the bank. For this reason, lending institutions have to find a way to balance profitability and risk.
Leading banks are continually exploring ways to make profits and at the same time keep an eye on risk. Notably, banks have been moving away from default-oriented credit scoring. Instead, they have been warming up to:
By extensively analyzing customer data, lenders can select credit limits, interest margins, and other product features that maximize profitability. They can also leave room for adjustments with respect to risk, operating, and marketing parameters once they have established a (business) relationship with the customer.
Beyond credit bureau scores, a bank can evaluate several other scorecards to make a decision regarding a new application, or an existing one, and also assess profitability:
Most banks have developed a customer relationship cycle that spells out the steps to take – from wooing customers, screening them for approval, and continually managing accounts while at the same time growing the business.
The customer relationship cycle can be split into three stages: marketing initiatives, the screening process, and the account management stage.
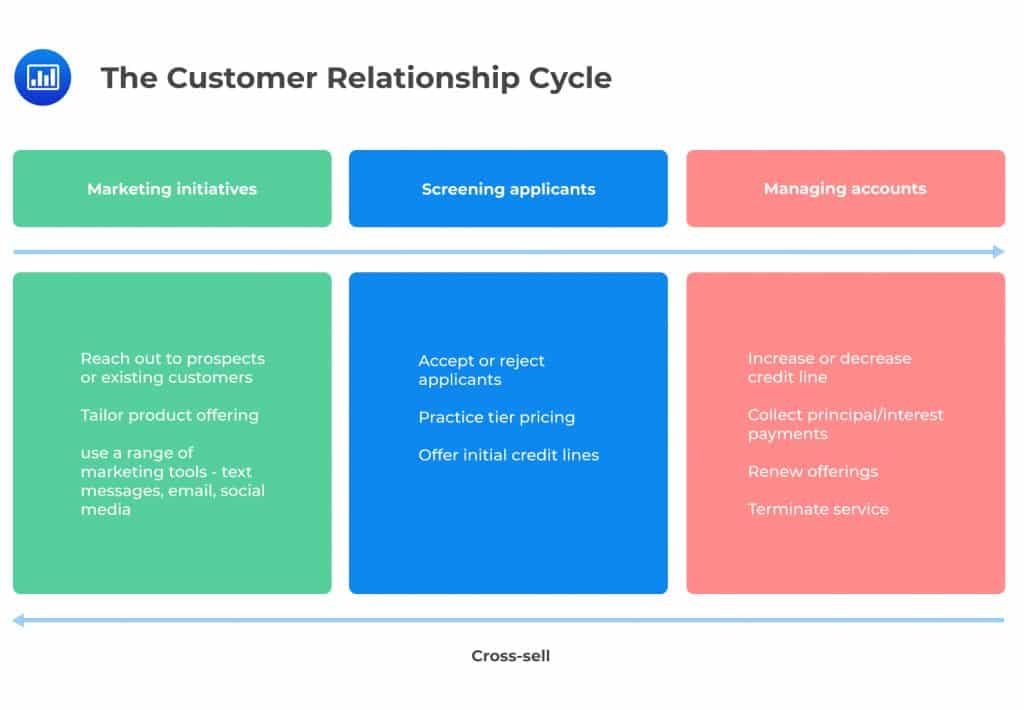 Marketing initiatives have much to do with tactics a bank uses to either sell a product to new customers or expand the consumption range for existing customers. A bank continually explores ways to offer tailor-made products that take the specific needs of a customer into account. For tailor-made products to do well, a bank must invest in detailed marketing studies that analyze the most likely response of various client segments.
The screening process requires banks to decide which applications to accept or reject based on credit scores. A bank has to decide whether to offer the initial credit line that takes a customer’s level of risk into account or not.
In the account management stage, a bank makes a series of decisions based on observed past behavior and activity. The bank can modify a credit line, renew it, or terminate services. The bank also explores whether cross-selling is possible. For example, the bank may extend a mortgage to a client who’s been operating a checking/savings account for a while.
Most banks have realized that a “one price fits all” policy has no place in the modern competitive credit market because it leads to adverse selection. This refers to a situation where a bank inadvertently attracts bad risks to whom a product is attractive while keeping good risks away.
As such, banks have resorted to risk-based pricing (RBP) where different customers are charged different prices based on their associated risks. RBP is still a budding practice in the financial retail sector. However, it has been practiced more frequently in some business lines, such as credit cards, home mortgages, and auto loan lines. Risk-based pricing has several benefits:
Practice Question
FICO Scores, or the credit scores most lenders use to determine your credit risk, most likely come from:
A. A wide range of lenders having credit portfolios that are related.
B. Outside vendors.
C. A credit bureau.
D. A custom model.
The correct answer is C.
FICO Scores are the credit scores most lenders use to determine your credit risk. You have FICO Scores from each of the three credit bureaus—Experian, Equifax, and TransUnion. Each score is based on information about you that a credit bureau keeps in their file. They are generic scores with low costs and are easy to install.
A is incorrect. While lenders do use FICO Scores to assess credit risk, the scores themselves are not a result of credit portfolios from a range of lenders. FICO Scores are calculated by credit bureaus based on the credit information they collect, not directly by lenders.
B is incorrect. Although FICO Scores may be utilized by outside vendors in various services, the scores are not originally created by these vendors. FICO Scores are calculated by the major credit bureaus using proprietary models developed by Fair Isaac Corporation.
D is incorrect. FICO Scores are not custom models tailored by individual lenders. They are standardized and widely used credit scores created by Fair Isaac Corporation (hence the name FICO) and provided by credit bureaus. Custom models may be developed by lenders for their own specific needs, but these are separate from FICO Scores.
Offered by AnalystPrep


Get Ahead on Your Study Prep This Cyber Monday! Save 35% on all CFA® and FRM® Unlimited Packages. Use code CYBERMONDAY at checkout. Offer ends Dec 1st.