


Theories of Growth
There are three growth theories based on the per capita growth in an... Read More

Sentiment analysis refers to the analysis of opinions or emotions from text data. In other words, it refers to how positive, negative, or neutral a particular phrase or statement is regarding a “target.” Such sentiment can provide critical predictive power for forecasting stock price movements for companies.
Here, we delve into a financial forecasting project to examine how effectively text data sentiments, from financial and economic news sources, can be classified. This project uses sentences from a text file Sentences_50Agree labeled as positive, neutral, or negative sentiment class.
The following table shows a sample data table corpus made up of 6 sentences from the Sentences_50Agree text file. A corpus is a collection of text data in any form, including lists, matrix, or data table forms.
$$\small{\begin{array}{l|l} \textbf{Sentence}&\textbf{Sentiment}\\ \hline\text{Cramo slipped to a pretax loss of EUR 6.7 million from a pretax profit of EUR 58.9 million.}&\text{Negative}\\ \hline\text{Profit before taxes decreased to EUR 31.6 mn from EUR 50.0 mn the year before.}&\text{Negative}\\ \hline\text{Also, construction expenses have gone up in Russia.}&\text{Negative}\\ \hline{\text{Finnish Bore that is owned by the Rettig family, has grown recently}\\ \text{through the acquisition of smaller shipping companies.}}&\text{Positive}\\ \hline{\text{The plan is estimated to generate some EUR 5 million (USD 6.5 m) in}\\ \text{cost savings on an annual basis.}}&\text{Positive}\\ \hline\text{Earnings per share EPS are seen at EUR 0.56}&\text{Positive}\\ \end{array}}$$
Whenever the data is obtained from different sources, it is gathered in raw format, which is not feasible for analysis. The first step of converting the raw data into a proper format is data cleansing.
Text preparation entails removing, or incorporating appropriate substitutions for, possible extraneous information present in the text. In this case, we will eliminate punctuations, numbers, and white spaces that are not necessary for model training as follows:
Step1: Remove HTML tags.
There are no HTML tags present in this sample.
Step 2: Remove punctuations.
Percentage and dollar symbols are substituted with word annotations to retain their importance in the textual data. Further, periods, semi-colons, and commas are removed. Regex is commonly applied to remove or replace punctuations.
Step3: Remove numbers.
Numbers present in the text should be removed as they do not have significant use for sentiment analysis. It is crucial to note that sentiment analysis seeks to understand the context in which the numbers are used. Additionally, before removing numbers, abbreviations representing orders of magnitude, such as million (commonly represented by “m,” “mln,” or “mn”), billion, or trillion, should be replaced with the complete word.
Step 4: Remove white spaces
Extra spaces such as tabs, line breaks, and new lines should be identified and removed to keep the text intact and clean. The stripWhitespace function in R can be utilized to can be used to eliminate unnecessary white spaces from the text
The cleansed data is free of punctuations and numbers, with useful substitutions, as shown in the table below:
$$\small{\begin{array}{l|l} \textbf{Sentence}&\textbf{Sentiment}\\ \hline\text{Cramo slipped to a pretax loss of a EUR million from a pretax profit of EUR million}&\text{Negative}\\ \hline\text{Profit before taxes decreased to EUR million from EUR million the year before}&\text{Negative}\\ \hline\text{Also, construction expenses have gone up in Russia}&\text{Negative}\\ \hline{\text{Finnish Bore that is owned by the Rettig family has grown recently}\\ \text{through the acquisition of smaller shipping companies}}&\text{Positive}\\ \hline{\text{The plan is estimated to generate some EUR million USD million in cost}\\ \text{savings on an annual basis}}&\text{Positive}\\ \hline\text{Earnings per share EPS are seen at EUR}&\text{Positive}\\ \end{array}}$$
After textual data is cleansed, it should be normalized. The normalization process in text processing entails the following:
Step 1: Lowercasing the alphabet aids the computer to process identical words appropriately. For example, “AND,” “And,” and “and”).
Step 2: Stop words such as “the,” “for,” and “are,” usually are removed to reduce the number of tokens involved in the training set for ML training purposes. However, some stop words such as not, more, very, and few are not eliminated as they carry significant meaning in the financial texts that are useful for sentiment prediction.
Step 3: Stemming a process of linguistic normalization, which reduces words to their word root word. For example, connection, connected, connecting word reduce to a common word “connect.”
Step 4: Lemmatization is identical to stemming except that it removes endings only if the base form is present in a dictionary. Lemmatization is much more costly and advanced relative to stemming.
Step 5: Tokenization is the process of breaking down a text paragraph into smaller chunks, such as words. A token is a single entity that is a building block for a sentence or a paragraph.
Exploratory data analysis (EDA) performed on text data provides insights on word distribution in the text. These word counts can be used to examine words that are most commonly and least commonly present in the texts, i.e., outliers.
The graph below is a frequency distribution of the sample tokens before stop words are eliminated.
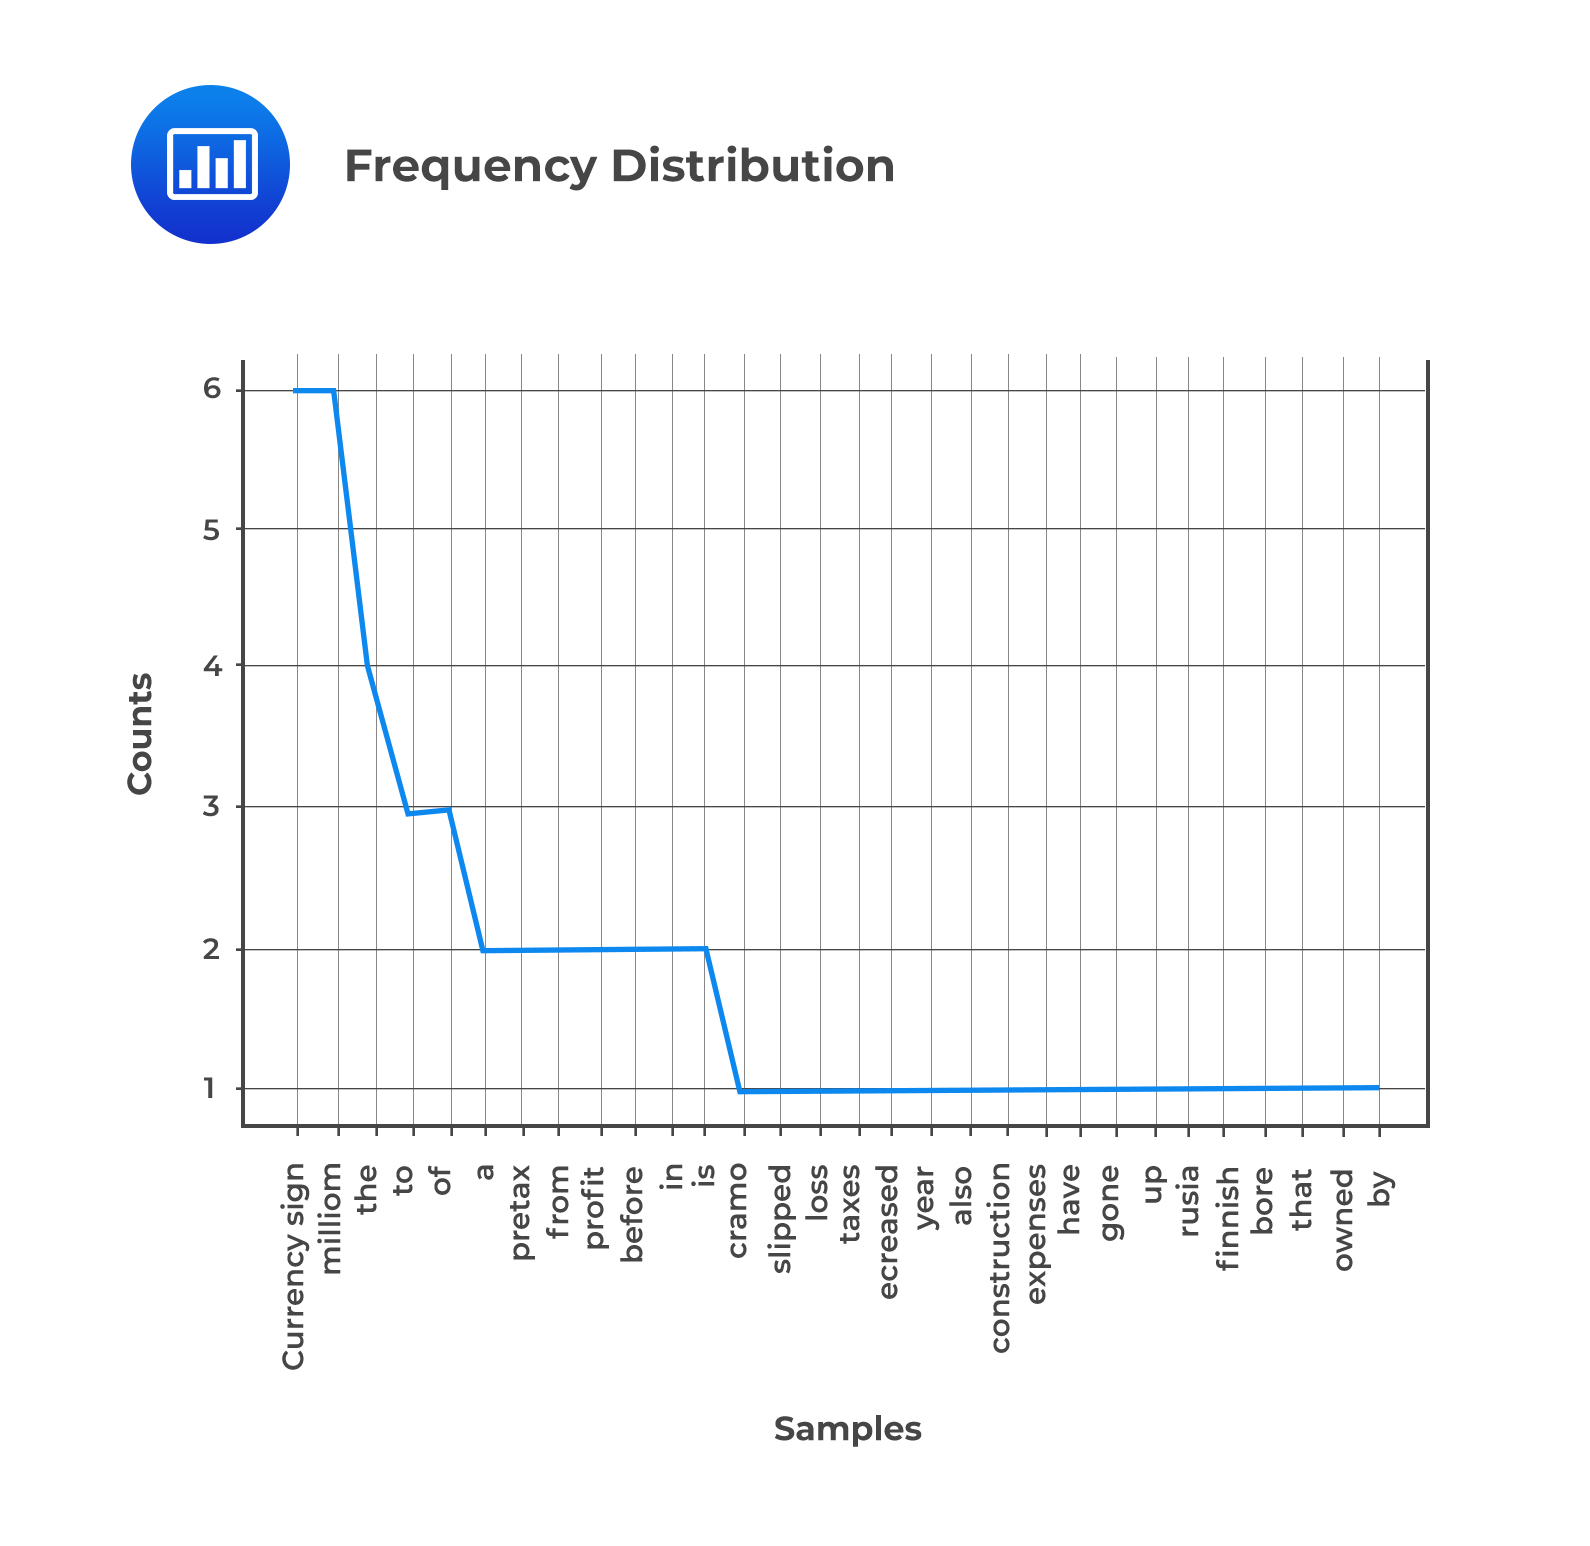 From the figure, we observe that “currencysign,” and “million” are the most repeated words due to the financial nature of the data.
A word cloud is a data visualization approach used for representing text data. Word clouds can be made to visualize the most informative words and their term frequency (TF) values. Varying font sizes can show the most commonly occurring words. Further, color is used to add more dimensions, such as frequency and length of words.
The feature selection process will eliminate common words and highlight useful words for better model training.
Question
Which of the following visualizations is most likely to be appropriate in the exploratory data analysis step if our objective is to create a visualization that shows the most informative words in the dataset based on their term frequency (TF) values?
A. Scatter plot.
B. Word cloud.
C. Document term matrix.
Solution
The correct answer is B.
A word cloud is a common visualization when working with text data as it can be made to visualize the most informative words and their TF values. Varying font sizes can show the most commonly occurring words in the dataset, and the color is used to add more dimensions, such as frequency and length of words.
A is incorrect. A scatter plot is a two-dimensional chart that can be employed to summarize and approximately measure relationships between two or more features.
C is incorrect. A document term matrix (DTM) is a matrix where each row belongs to a text file, and each column represents a token. The number of rows is equivalent to the number of text files in a sample text dataset. The number of columns is equal to the number of tokens from the BOW built using all the text files in the same token is present in each document. A DTM is not a visualization tool.
Reading 7: Big Data Projects
LOS 7 (e) Describe preparing, wrangling, and exploring text-based data for financial forecasting
Offered by AnalystPrep


Get Ahead on Your Study Prep This Cyber Monday! Save 35% on all CFA® and FRM® Unlimited Packages. Use code CYBERMONDAY at checkout. Offer ends Dec 1st.