


Determine the sum of independent rando ...
The Sum of Independent Random Variables Given \(X\) and \(Y\) are independent random... Read More

While it's crucial to grasp basic probability concepts, actuarial problems often require a deeper dive into complex scenarios where events are interdependent. This leads us to the concept of conditional probability.
Conditional probability is the probability of an event occurring, given that another event has already happened. This “condition” provides us with new information that can change the original probability of the event. For instance, consider the probability of someone buying life insurance. Knowing that the person has a high-risk profession, like being a stunt person, could drastically alter the probability they'll buy life insurance compared to a random individual.
For any two events, \(A\), and \(B\), the conditional probability of \(A\) given \(B\) is defined as follows:
$$ P\left(A\middle| B\right)=\frac{P\left(A\cap B\right)}{P\left(B\right)} $$
The conditional probability rule can also be rewritten as a multiplication rule:
$$ P\left(A\cap B\right)=P\left(A\middle| B\right)\times P\left(B\right) $$
Consider a standard deck of 52 playing cards. If you draw one card, what is the probability that it is a king, given that it is a face card?
Solution
There are four kings in a standard deck, so \(P(A) =\frac { 4}{52 }= \frac {1}{13}\)
There are 12 face cards in a standard deck (4 each of Jacks, Queens, and Kings), so \(P(B) =\frac {12}{52} = \frac {3}{13} \)
Both the card being a king and a face card means it's just a king, so \(P\left(A\cap B\right)=P\left(A\right) =\frac {1}{13} \)
Using the conditional probability formula:
$$ P\left(A\middle| B\right)= \frac{\frac{1}{13}}{\frac{3}{13}}=\frac{1}{3}
$$
In a particular city, it rains 40% of the days. On rainy days, 75% of the city's residents carry umbrellas. On days without rain, only 10% of residents carry umbrellas. If you spot a random resident carrying an umbrella, what is the probability that it's raining?
Solution
Step 1: Define the events
Step 2: Calculate the required probabilities
Step 3: Calculate the joint probabilities
$$ P(A \cap B) = P(A) \times P\left(B\middle| A \right) = 0.40 \times 0.75 = 0.30 $$
\( P(A^\prime \cap B) = P(A^\prime) \times P\left(B\middle|A^\prime \right) = 0.60 \times 0.10 = 0.06, \text{ since } P(A^\prime) = 1 – P(A) = 0.60 \)
Step 4: Use the law of total probability to find \(P(B)\)
$$ P(B) = P(A \cap B) + P(A^\prime \cap B) = 0.30 + 0.06 = 0.36 $$
Step 5: Use the conditional probability formula
$$ P\left(A\middle| B\right)= \frac{0.3}{0.36}=\frac{5}{6} $$
If you spot a random resident carrying an umbrella, the probability that it's raining is \(\frac {5}{6}\) or approximately 83.33%.
A medical clinic offers a screening test for a particular disease. The disease is rare and only affects 2% of the population. If a person has the disease, the test will correctly identify them as positive 98% of the time. However, if a person doesn't have the disease, the test will still incorrectly identify them as positive 5% of the time (false positive). If a person is tested and gets a positive result, what is the probability they actually have the disease?
Solution
Step 1: Define the events
Step 2: Calculate the required probabilities
Step 3: Calculate the joint probabilities
$$ P(D \cap T) = P(D) \times P\left(T\middle| D \right) = 0.02 \times 0.98 = 0.0196 $$
\(P(D^\prime \cap T) = P(D^\prime) \times P\left(T\middle| D^\prime \right) = 0.98 \times 0.05 = 0.049, \text{ since } P(D^\prime) = 1 – P(D) = 0.98 \)
Step 4: Use the law of total probability to find \(p(t)\)
$$ P(T) = P(D \cap T) + P(D^\prime \cap T) = 0.0196 + 0.049 = 0.0686 $$
Step 5: Use the conditional probability formula
$$ P\left(D\middle| T\right)= \frac{0.0196}{0.0686}=0.2857 $$
If a person is tested and receives a positive result, the probability they actually have the disease is approximately 28.57%.
The Probability Mass Function (PMF) describes the distribution for discrete variables, while the Probability Density Function (PDF) does so for continuous variables. However, we might want to update these probabilities when we have extra information. That's where conditional probability comes into play, refining our view of a variable's behavior given certain conditions.
Given two discrete random variables, \(X\) and \(Y\),
$$ P\left(X=x\middle| Y=y\right)=\frac{P\left(X=x\cap Y=y\right)}{P\left(Y=y\right)} $$
For continuous random variables \(X\) and \(Y\), the conditional PDF of \(X\) given \(Y = y\) (denoted as \(f_{\left(X\middle| Y\right)}\left(x\middle| y\right))\) is given by:
$$ f_{\left(X\middle| Y\right)}\left(x\middle| y\right)=\frac{f_{\left(X\middle| Y\right)}\left(x,y\right)}{f_Y\left(y\right)} $$
Consider a discrete random variable \(X\) that can take on the values 0, 1, or 2. The PMF of \(X\), denoted \(f_X\left(x\right)\), is given by:
$$ \left\{\begin{matrix} 0.2 & \text{if } x=0 \\ 0.5 & \text{if } x=1 \\ 0.3 & \text{if } x=2 \\ 0 & \text{otherwise} \end{matrix}\right. $$
Calculate the conditional probability \(P \left(X=1\middle| X \gt 0 \right)\), which is the probability that \(X\) equals 1 given that \(X\) is greater than 0.
Solution
First, we need to determine the probability that \(X\) is greater than 0. This is:
$$ P(X \gt 0) = f_X\left(1\right) + f_X\left(2\right) = 0.5 + 0.3 = 0.8 $$
Next, we can determine the conditional probability using the formula:
$$ P\left(X=1\middle| X \gt 0\right)=\frac{P\left(X=1\cap X \gt 0\right)}{P\left(X \gt 0\right)} $$
Since \(X = 1\) is a subset of \(X \gt 0, P\left(X=1\cap X \gt 0\right)=P\left(X=1\right)=0.5\)
Thus,
$$ P\left(X=1\middle| X \gt 0\right)=\frac{0.5}{0.8}=0.625 $$
So, given that \(X\) is greater than 0, there is a 62.5% chance that \(X\) equals 1.
Consider a discrete random variable \(Y\), which can take on the values 1,2,1,2, or 33. The PMF of \(Y\), denoted \(f_Yy\), is defined as:
$$ \left\{\begin{matrix} 0.1 & \text{ if } y=1 \\ 0.4 & \text{if } y=2 \\ 0.5 & \text{if } y=3 \\ 0 & \text{otherwise} \end{matrix}\right. $$
Let's calculate the conditional probability \(P\left(Y = 2 \middle|Y \le 2\right)\), which represents the probability that \(Y\) is 2 given that \(Y\) is less than or equal to 2.
Solution
Firstly, the probability that \(Y\) is less than or equal to 2 is \(0.1 + 0.4 = 0.5\) (since these are the possible values of \(Y\))
Using the formula for conditional probability:
$$ P\left(Y=2\middle| Y\le2\right)=\frac{P\left(Y=2\cap Y\le2\right)}{P\left(Y\le2\right)} $$
Given that \(Y = 2\) is a subset of \(Y \le 3, P\left(Y=2\cap Y\le2\right) = P(Y = 2) = 0.4\)
Thus,
$$ P\left(Y=2\middle| Y\le2\right)=\frac{0.4}{0.5}=0.8 $$
So, given that \(Y\) is less than or equal to 2, there is an 80% chance that \(Y\) is 2.
Consider two continuous random variables \(X\) and \(Y\) with joint probability density function (pdf) given by:
$$ \left\{\begin{matrix} 2xy & \text{if } 0 \le x \le 1 \text{ and } 0\le y \le 1 \\ 0 & \text{otherwise} \end{matrix}\right. $$
This pdf represents the likelihood that \(X\) and \(Y\) take on specific values simultaneously.
Calculate the conditional probability \(P \left(X \gt 0.5\middle| Y = 0.8\right)\), i.e., the probability that \(X\) is greater than 0.5 given that \(Y\) equals 0.8.
Solution
To find the conditional probability, we need to find the marginal pdf of \(Y\), denoted \(f_Y\left(y\right)\), and then use it to determine the conditional pdf \(f_{XY}\left(x\middle| y\right)\).
Step 1: Find the marginal pdf of \(Y\):
$$ f_Y\left(y\right)=\int_{0}^{1}{f_{X,Y}\left(x,y\right)dx} $$
Substituting in the given \(f_{XY}\left(x,y\right)\)
$$ f_Y\left(y\right)=\int_{0}^{1}{2xydx=yx^2|_0^1=y} $$
Step 2: Use the marginal pdf to determine the conditional pdf:
$$ f_{\left(X\middle| Y\right)}\left(x\middle|0.8\right)=\frac{f_{XY}\left(x,0.8\right)}{f_Y\left(0.8\right)}=\frac{2x\left(0.8\right)}{0.8}=2x $$
Step 3: Compute the conditional probability:
$$ P\left(X \gt 0.5\middle| Y=0.8\right)=\int_{0.5}^{1}{2xdx=x^2|_{0.5}^1=1-0.25=0.75} $$
Therefore, given that \(Y = 0.8\), there is a 75% chance that \(X\) is greater than 0.5.
Given the following probability density function of a continuous random variable:
$$ f\left(x\right)= \left\{\begin{matrix} x^2+\frac{2}{3}, & 0 \lt x \lt 1 \\ 0, & \text{otherwise} \end{matrix}\right. $$
Calculate \(P \left(X\lt \frac{3}{4}\mid X\gt \frac{1}{2}\right) \)
Solution
Using the fact that:
$$ \begin{align*}
P\left(A\mid B\right) & =\frac{P\left(A\cap B\right)}{P\left(B\right)} \\
\Rightarrow P\left(X \lt \frac{3}{4}\mid X\gt \frac{1}{2}\right) & = \frac{P(X\lt \frac{3}{4}\cap X \gt \frac{1}{2}}{P\left(X\gt \frac{1}{2}\right)} \\
& =\frac{P\left(\frac{1}{2} \lt X \lt \frac{3}{4}\right)}{P\left(X\gt \frac{1}{2}\right)} \end{align*} $$
Now,
$$ \begin{align*}
P\left(\frac{1}{2} \lt X \lt \frac{3}{4}\right) & =\int_{\frac{1}{2}}^{\frac{3}{4}}\left(x^2+\frac{2}{3}\right)dx=\left[\frac{x^3}{3}+\frac{2}{3}x\right]_{x=\frac{1}{2}}^{x=\frac{3}{4}}=0.265625 \\
P\left(X \gt \frac{1}{2}\right) & =\int_{\frac{1}{2}}^{1}\left(x^2+\frac{2}{3}\right)dx=\left[\frac{x^3}{3}+\frac{2}{3}x\right]_{x=\frac{1}{2}}^{x=1}=\frac{5}{8} \\
\Rightarrow P \left(X \gt \frac{3}{4}\mid X \gt \frac{1}{2}\right) & =\frac{0.265625}{\frac{5}{8}}=0.425 \end{align*} $$
A healthcare provider issues insurance policies for its clients. The annual claim, \(W\), of a policyholder in any given year is described by:
$$ W = 80,000Z $$
where \(Z\) is a random variable with the following density function:
$$ \left\{\begin{matrix}
m(1-Z)^3 & \text{for } 0\lt z \lt 1 \\ 0, & \text{otherwise} \end{matrix}\right. $$
Here, \(m\) is a constant.
Find the conditional probability that \(W\) exceeds 32,000, given that \(W\) exceeds 8,000.
Solution
Step 1: Determine the value of \(m\)
The total area under \(g(z)\) must equal 1 for all values of \(z\). Therefore:
$$ \begin{align*}
\int_{0}^{1}{m\left(1-z\right)^3dz}&=1 \\
\Longrightarrow-\frac{1}{4}{m\left(1-z\right)}^4|_0^1 & =1 \\
\Longrightarrow-\frac{1}{4}m\left(1-1\right)^4+\frac{1}{4}m & =1 \end{align*} $$
From the above, we get \(m = 4\)
Step 2: Calculate the probabilities
We need:
$$ \begin{align*} P\left(W \gt 8,000\right) & =P\left(80,000Z \gt 8,000\right)=P\left(Z \gt 0.1\right) \\
P\left(W \gt 32,000\right) &=P\left(80,000Z \gt 32,000\right)=P\left(Z \gt 0.4\right) \end{align*} $$
Evaluating the integrals:
For \(P(Z \gt 0.1)\):
$$ \int_{0.1}^{1}{4\left(1-z\right)^3dz=-\left(1-z\right)^4|_{0.1}^1=0.6561} $$
For \(P(Z \gt 0.4)\):
$$ \int_{0.1}^{1}{4\left(1-z\right)^3dz=-\left(1-z\right)^4|_{0.4}^1=0.1296} $$
Step 3: Calculate the Conditional Probability
$$ P\left(W \gt 32,000\middle| W \gt 8,000\right)=\frac{P\left(W \gt 32,000\right)}{P\left(W \gt 8,000\right)}=\frac{0.1296}{0.6561}=0.1976 $$
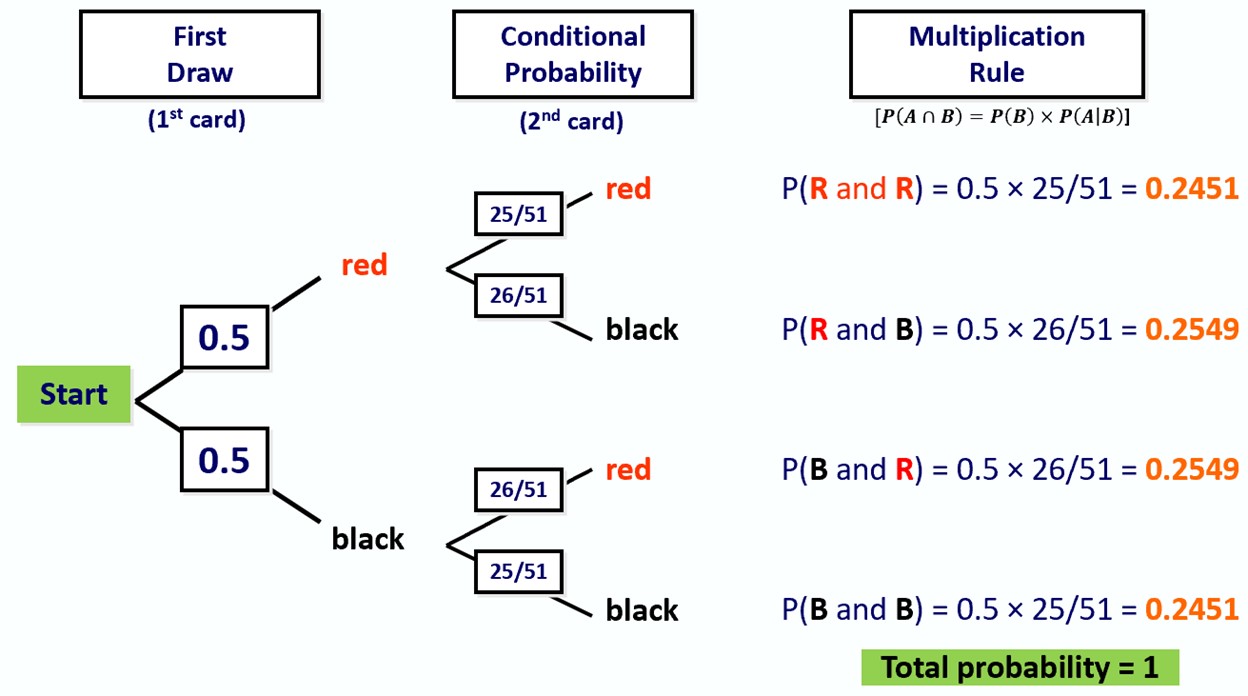
A tree diagram is a graphical representation used to showcase all the possible outcomes of an event. It starts with a single node that branches out to represent multiple scenarios. Each branch represents a different outcome and can further branch out based on subsequent outcomes.
How to Construct a Tree Diagram:
The real power of tree diagrams shines when dealing with conditional probabilities. Each branch's probability is the product of the likelihood of the event given the preceding events.
For example, consider drawing cards from a deck. If you draw one card, the tree's first set of branches represents the likelihood of drawing each type. If you then draw a second card without replacement, the probabilities change, and this change can be represented as sub-branches with adjusted probabilities based on the first draw's outcome.
Suppose you want to determine the probability that you first draw a red card (either heart or diamond) from a standard deck of 52 cards and then, without replacing it, draw a black card (either club or spade).
Step 1: Identify events
Step 2: Draw initial branch
Step 3: Add secondary branches
Step 4: Label the branches with probabilities
Step 5: Finding the desired probability
For example, the probability of drawing a red card first and then a black card is the product of the probabilities along the respective branches:
\(P(R \text{ and } B) = P(R) \times P\left(B\middle|R \right) = 0.5 \times \frac {26}{51} \approx 25.49\% \)
Question
A private medical research institute examines the medical records of 1,200 individuals who participated in a study. Among these individuals, 320 were diagnosed with diabetes. Additionally, 480 participants had at least one parent who had diabetes. Among the 480 participants with diabetic parents, 240 were diagnosed with diabetes themselves.
Calculate the probability that a randomly selected individual from this group has diabetes, given that neither of their parents had diabetes.
- 0.011
- 0.095
- 0.125
- 0.025
- 0.055
Solution
The answer is A.
Let's define the events:
\(A\) = Individual has diabetes.
\(B\) = Neither parent had diabetes.
From the given information:
$$ P\left(A\right)=\frac{320}{1200} $$
We are asked to find the probability that an individual has diabetes, given that neither of their parents had diabetes, i.e.,
$$ P \left(A \middle| B \right)=\frac{P\left(A \cap B\right)}{P\left(B\right)} $$
Now, we can first find \(P\left(A \cap B\right)\), which is the probability that an individual has diabetes and neither of their parents had diabetes.
$$ P\left(A\cap B\right)=\frac{320-240}{1200}=\frac{80}{1200} $$
Now, let's calculate the values:
$$ \begin{align*} P\left(B\right) & =\frac{1200 – 480}{1200}=\frac{720}{1200} \\
\Rightarrow P\left(A \middle| B \right)&=\frac{\frac{80}{1200}}{\frac{720}{120}}=0.0111 \end{align*} $$
Learning Outcome
Topic 2. b: Univariate Random Variables – Calculate conditional probabilities
Offered by AnalystPrep


Get Ahead on Your Study Prep This Cyber Monday! Save 35% on all CFA® and FRM® Unlimited Packages. Use code CYBERMONDAY at checkout. Offer ends Dec 1st.