


Probability Generating Functions and M ...
Probability Generating Function The probability generating function of a discrete random variable is... Read More

The mean (average) gives an idea of the “typical” value in a dataset. However, in many scenarios, especially in financial markets, simply knowing the mean isn't sufficient. Investors want to know not just the expected return (mean) but also how much variability or risk is associated with an investment. This is where variance comes in.
The variance also comes with a few advantages over the range of a set of data. As discussed previously, range calculates the difference between the maximum and minimum values in a data set. But it comes with two key limitations:
The variance resolves such problems in several ways:
Given a discrete random variable with mean \(\mu_X\) and probability function \(P\left(X=x_i\right)=p(x_i)\), the variance is calculated as follows:
$$ Var\left(X\right)=\sigma_X^2=\sum_{x_i}{\left(x_i-u_X\right)^2p\left(x_i\right)} $$
Given a data set of \(n\) equally likely outcomes, the formula above changes as follows:
$$ \sigma_X^2=\frac{1}{n}\sum_{i=1}^{n}\left(x_i-\mu_X\right)^2 $$
But for practical purposes, you can easily calculate the variance as follows:
$$ \begin{align*}
Var\left[X\right] & =E\left[X^2\right]-\left(E\left[X\right]\right)^2={\sum_{x_i}{x_i^2p\left(x_i\right)-\left(\sum_{x_i}{x_ip\left(x_i\right)}\right)}}^2 \\ & =\sum_{x_i}{x_i^2p\left(x_i\right)-\left(\mu_x\right)^2} \end{align*} $$
The variance of \(X\) is sometimes often referred to as the second moment of \(X\) about the mean.
Let \(\alpha\) and \(\beta\) be non-zero constants. Then, it can be proved that:
The standard deviation of a discrete random variable, \(\sigma\), is a fundamental statistical measure that quantifies the degree of variability or dispersion in the outcomes of the variable. It represents the average distance between each data point and the mean of the data set. It’s calculated as the square root of variance:
$$ \sigma=\sqrt V\left(X\right) $$
Alternatively,
$$ Var\left(X\right)=\sigma^2 $$
The standard deviation has several advantages over variance. While both measures convey information about data dispersion, the standard deviation is expressed in the same units as the original data, making it more interpretable. It provides a more intuitive understanding of the spread of data because it is in the same scale as the data points. In contrast, variance is in squared units, which can be less meaningful. Additionally, the standard deviation is less sensitive to outliers compared to the variance, making it a robust measure for summarizing data when extreme values are present.
Suppose we are conducting an experiment of rolling a fair six-sided die. Let \(X\) be the random variable representing the outcome of rolling the die.
Find \(Var(X)\).
Solution
We know that:
$$ \begin{align*} Var\left(X\right) & =E\left(X^2\right)-\left(E\left[X\right]\right)^2 \\ E\left(X\right) & = 1\times \left(\frac{1}{6}\right)+ 2\times\left(\frac{1}{6}\right)+ 3\times\left(\frac{1}{6}\right)+ 4\times\left(\frac{1}{6}\right) \\ & + 5\times\left(\frac{1}{6}\right)+ 6\times\left(\frac{1}{6}\right) \\ & = 3.5 \\ E\left(X^2\right) & = 1^2\times \left(\frac{1}{6}\right)+ 2^2\times \left(\frac{1}{6}\right)+ 3^2\times\left(\frac{1}{6}\right)+ 4^2\times\left(\frac{1}{6}\right) \\ & + 5^2\times \left(\frac{1}{6}\right)+ 6^2\times \left(\frac{1}{6}\right) \\ & =\frac{91}{6} \\ \Rightarrow Var\left(X\right) & = \left(\frac{91}{6}\right)– (3.5)^2 =\frac{35}{12} = 2.92 \end{align*} $$
Alternatively, we can get the above result using the formula
$$ Var\left(X\right)=E\left(X-\mu\right)^2=\sum_{\forall x}{\left(X-\mu\right)^2 p\left(x_i\right)} $$
Where \(E\left(X\right)=\mu\)
$$ \begin{align*} \Rightarrow Var\left(X\right) &=\left(1 - 3.5\right)^2\times\left(\frac{1}{6}\right)+ \left(2 - 3.5\right)^2\times\left(\frac{1}{6}\right) \\ & + \left(3 - 3.5\right)^2\times\left(\frac{1}{6}\right)+ \left(4 - 3.5\right)^2\times\left(\frac{1}{6}\right) \\ & +\left(5 - 3.5\right)^2\times \left(\frac{1}{6}\right)+ \left(6 - 3.5\right)^2\times\left(\frac{1}{6}\right) \\ & = 2.92 \end{align*} $$
The number of claims, \(X\), that an insurance company receives per annum is distributed as below:
$$ \begin{array}{c|c}
X & P(X=x) \\ \hline
1 & 0.25 \\ \hline
2 & 0.035 \\ \hline
3 & 0.05 \\ \hline
4 & 0.5 \\ \hline
5 & 0.16 \\ \hline
6 & 0.005
\end{array} $$
Solution:
We know that
$$ Var(X) = E (X^2) -(E[X])^2 $$
Now,
$$ \begin{align*}
E(X) & = 1 \times (0.25)+ 2 \times (0.035)+ 3 \times (0.05)+ 4 \times (0.5) \\ & + 5 \times (0.16)+ 6 \times (0.005) = 3.3 \\
E(X^2) & =1^2 (0.25) + 2^2 (0.035) + 3^2 (0.05) + 4^2 (0.5) \\ & + 5^2 (0.16) + 6^2 (0.005) =13.02 \\
Var(X) & =13.02-(3.3)^2= 2.13
\end{align*} $$
We know that,
$$ Var(2X)=E[(2X)^2 ]-[E(2X)]^2 $$
Now,
$$ \begin{align*}
E(2X) & =2 \times 1(0.25)+ 2 \times 2(0.035)+ 2 \times 3(0.05)+ 2 \times 4(0.5) \\ & + 2 \times 5(0.16)+ 2 \times 6(0.005)=6.6 \\
E[(2X)^2]& =E[4x^2 ] \\
E[(2X)^2 ]&=E[4x^2 ]=4 \times 1^2 (0.25)+ 4 \times 2^2 (0.035)+ 4 \times 3^2 (0.05) \\ & +4 \times 4^2 (0.5)
+ 4 \times 5^2 (0.16)+ 4 \times 6^2 (0.005)=52.08 \end{align*} $$
So that,
$$ Var(2X)=52.08-6.6^2=8.52 $$
Alternatively, using the properties of variance,
$$ Var(2X)=2^2 Var(X)=2^2 \times 2.13=8.52 $$
To find \(Var(2X+5)\), we can start by creating a table for the variable \(2X+5\):
$$ \begin{array}{c|c}
2X+5 & P(X=x) \\ \hline
7 & 0.25 \\ \hline
9 & 0.035 \\ \hline
11 & 0.05 \\ \hline
13 & 0.5 \\ \hline
15 & 0.16 \\ \hline
17 & 0.005
\end{array} $$
We know that
$$ Var(2X+5)= E[(2x+5)^2 ]-[E(2x+5)]^2 $$
Now,
$$ \begin{align*} E(2x+5) & =7 \times (0.25)+ 9 \times (0.035)+ 11 \times (0.05)+ 13 \times (0.5) \\
& +15 \times (0.16)+ 17 \times (0.005)=11.6 \end{align*} $$
And,
$$ \begin{align*} E[(2x+5)^2 ]& =7^2 \times (0.25)+ 9^2 \times (0.035)+ 11^2 \times (0.05)+ 13^2 \times (0.5) \\
& +15^2 \times (0.16)+ 17^2 \times (0.005)=143.08 \\
\therefore Var(2X+5) & =143.08-11.6^2=8.52 \\
\end{align*} $$
It is clear that,
$$ Var(2X+5)=Var(2X) $$
This proves the property that,
$$ Var(X+\alpha)=Var(X) $$
A research report suggests that the annual cost of maintaining and repairing a motorcycle in a city in British Columbia averages 150 with a variance of 180. A new tariff of 25% is imposed on all products related to the maintenance and repair of motorcycles (i.e., everything becomes 25% more expensive).
Calculate the variance of the annual cost of maintaining and repairing a motorcycle after the tariff is introduced.
Solution
Let \(Z\) and \(W\) denote the annual cost of maintaining and repairing a motorcycle before and after the 25% tariff, respectively.
Given:
\(Z\) (average) = 150
\(Var(Z) = 180\)
From the problem, \(W\)=1.25Z
Using the properties of variance:
$$ \begin{align*} Var(W) & = Var(1.25Z)=1.25^2 \times Var(Z) \\
& =1.5625(180)=281.25
\end{align*}$$
The profit for a new product is given by \(Z = 4X – 2Y – 7\). \(X\) and \(Y\) are independent random variables with \(Var(X) = 1\) and \(Var(Y) = 2\).
Calculate \(Var(Z)\).
Due to the independence of \(X\) and \(Y\),
$$ \begin{align*} Var(Z) & = Var(4X – 2Y – 7) = 4^2 Var(X^2 )+(-2^2 )Var(Y)+0 \\
& =16(1) + 4(2) + 0 \\
& = 24
\end{align*}$$
If \(X\) is a continuous random variable, then as in the case of discrete random variables, \(Var(X)\) is given by
$$ \begin{align*} Var(X) & =E(X)^2-(E[X])^2 \\
& =\int_{-\infty}^{\infty} X^2f\left(x\right)dx-\left[\int_{-\infty}^{\infty} x f\left(x\right)dx\right]^2 \\
\end{align*} $$
And if we let \(E(X)=\mu\), then \(Var(X)\) can be expressed as
$$ Var(X)=\int_{-\infty}^{\infty}(X-\mu)^2 f(x)dx $$
Given the following probability density function of a continuous random variable:
$$ f(x)=\left\{ \begin{matrix} \frac{x}{2}, & 0 \lt x \lt 2 \\ 0, & \text{otherwise} \end{matrix} \right. $$
Calculate \(Var(X)\)
Solution
We know that:
$$ Var(X)=E(X)^2-(E[X])^2 $$
Therefore,
$$ \begin{align*}
E(X) & =\int_{-\infty}^{\infty} xf(x)dx=\int_0^2 x \times \frac{x}{2} \times dx=\left[\frac {x^3}{6} \right]_{x=0}^{x=2}=\frac {8}{6}=\frac {4}{3} \\
E(X^2) & =\int_{-\infty}^{\infty} X^2 f(x)dx=\int_0^2 x^2 \times \frac {x}{2} \times dx=\left[\frac {x^4}{8} \right]_{x=0}^{x=2}=2 \\
\Rightarrow Var(X) & =2-\left(\frac {4}{3} \right)^2=\frac {2}{9}
\end{align*} $$
Alternatively,
$$ \begin{align*} Var(X) & =\int_{-\infty}^{\infty}(x-\mu)^2 f(x)dx \\
& =\int_0^2 \left(x-\frac {4}{3}\right)^2 \times \frac {x}{2} \times dx=\left[\frac {x^4}{8}-\frac {4}{9} x^3+\frac {4}{9} x^2 \right]_{x=0}^{x=2}=\frac {2}{9} \end{align*} $$
As with discrete random variables, the standard deviation, often written as \(\sigma\), of a continuous random variable is simply the square root of the variance:
$$ S.D(X)=\sigma=\sqrt{Var(X)} $$
Using the example above, we found that:
$$ \begin{align*}
Var (X) &= \frac {2}{9} \\
\Rightarrow S.D &=\sigma=\sqrt{\frac {2}{9}} \\
&= 0.4714
\end{align*} $$
Another important concept that we discuss in this reading is the coefficient of variation.
A renowned camera manufacturer offers a 10-year warranty on their latest professional DSLR camera. The warranty covers any lens issues that arise within this period or the camera will be replaced upon reaching the 10-year mark. Let \(U\) signify the age of the camera at the time of replacement due to lens issues. The camera's age at lens issue occurrence, denoted by V, has the following
density function:
$$ \left\{ \begin{matrix} \frac {1}{10} & \text{for } 0\lt v \lt 5 \\ 0 & \text{elsewhere} \end{matrix} \right. $$
Determine the variance and standard deviation of \(U\).
Solution
Step 1: Determine \(E[U]\)
From the provided density function:
$$
E[U]=\int_{0}^{10}{v\times\frac{1}{10}dv=\frac{1}{10}\times\frac{v^2}{2}\left|\frac{10}{0}\right.}=5 $$
Step 2: Determine \(E[U^2]\)
$$ E\left[U^2 \right]=\int_{0}^{10}{v^2\times\frac{1}{10}dv=\frac{1}{10}\times\frac{v^3}{3}\left|\frac{10}{0}\right.}=33.33 \\
E\left[U\right]=\int_{0}^{10}{v\times\frac{1}{10}dv=\frac{1}{10}\times\frac{v^2}{2}\left|\frac{10}{0}\right.}=5 $$
Step 3: Calculate the variance of \(U\)
$$ \begin{align*} Var[U] & =E[U^2]-(E[U])^2 \\
& = 33.33 – 25 = 8.33 \end{align*} $$
Step 4: Calculate the Standard deviation
$$ \sigma_U=\sqrt{8.33}=2.89 $$
The coefficient of variation (CV) is a standardized measure of relative risk, representing the ratio of the standard deviation to the mean, and is especially valuable when comparing the risk of two different investments or assets. It provides a dimensionless measure, allowing for a direct comparison of variation between datasets that might have different units or scales. In the fields of finance and insurance, the CV is instrumental in determining the volatility of investments or the reliability of financial models, respectively. It's particularly important for financial analysts and insurance actuaries when they are assessing the relative risk of different ventures, determining policy premiums, or analyzing asset diversification in portfolios.
Mathematically,
$$ C.V.=\frac{\sigma}{\mu} $$
From example 6 above, \(\sigma=\frac{2}{9}\) and \(\mu=43\).
Thus,
$$ C.V.=\frac {\sigma}{\mu}=\frac{\frac{2}{9}}{\frac {4}{3}}=\frac{1}{6} $$
The independent random variables \(X\) and \(Y\) have the same mean. The coefficients of variation of X and Y are 2 and 5 respectively.
Calculate the coefficient of variation of \(\frac{1}{3}(X + Y)\).
Solution
Let \(\mu\) be the common mean. Given the coefficients of variation, the standard deviations of \(X\) and \(Y\) are \(2\mu\) and \(5\mu\) respectively.
The mean of \(\frac{1}{3}(X + Y) = \frac{1}{3}\left(\mu+\mu\right)=\frac{2}{3}\mu\)
The variance is given by \(Var(\frac{1}{3}(X + Y))\) which is equivalent to \(\frac{1}{9}Var(X+Y)\)
Let \(X\) be the random variable representing the number of successes in \(n\) independent trials where each trial ends in either a success or failure. Let \(p\) denote the probability of a success and \(q=1-p\) denote the probability of a failure. Then \(X\) is said to be a binomial random variable with parameters \(n\) and \(p\) denoted as \(X\sim Bin\left(n, p\right)\).
In other words, a binomial experiment is an experiment that consists of \(n\) independent trials, each with a probability of success, \(p\), and failure, \(1-p\). The probability of success, \(p\), is the same throughout the experiment.
The probability mass function of a binomial distribution is given by:
$$ P\left(X=x\right)=\binom{n}{x}p^X\left(1-p\right)^{n-x},\ \ \ \ x=0, 1, 2, \ldots $$
The mean and variance of a binomial distribution are given by:
$$ \begin{align*} E\left(X\right)&=np \\
Var\left(X\right)&=np(1-p) \end{align*} $$
The Bernoulli distribution is a special case of the binomial distribution with \(n=1\), i.e., \(X\sim Bin\left(1, p\right)\). The PMF of a Bernoulli distribution is given by:
$$ f\left(x\right)= \left\{ \begin{matrix} p,& x=1 \\ 1-p, & x=0 \end{matrix} \right. $$
The expected value and the variance of a Bernoulli random variable are given by:
$$ E\left(X\right)=p $$
And,
$$ Var\left(X\right)=p(1-p) $$
At a local training institute, it has been observed that 1 out of every 6 students skips lunch during the lunch break. If a random sample of 10 students is taken from this institute, determine the variance of the number of students who skip lunch.
Solution
Let \(X\) be the random variable for the number of students who skip lunch.
$$ X\sim Bin\left(10,\frac{1}{6}\right) $$
We know that,
$$ \begin{align*} Var\left(X\right) & =np\left(1-p\right) \\
& =\left(10\right)\left(\frac{1}{6}\right)\left(\frac{5}{6}\right)\\ & =\frac{25}{18}=1.389 \end{align*} $$
Suppose we have a sequence of independent Bernoulli trials and that we wish to model the number of failures denoted by \(k\) before a specified number of successes, \(r\) is obtained. Suppose further that each trial has two outcomes: success or failure. In each trial, the probability of success is \(p\). Let \(X\) denote the random variable representing the number of failures observed before the \(r^{th}\) success is observed. Then, \(X\) is said to be a negative binomial random variable with parameters \(r\) and \(p\), denoted as \(X\sim NB\left(r,p\right)\).
The PMF of \(X\) is given by:
$$ P\left(X=k\right)=\binom{k+r-1}{k}\left(1-p\right)^kp^r,\ \ \ \ for\ k=0,\ 1,\ 2,\ \ldots $$
The alternate formula for the above PMF, using an equivalent binomial, can be expressed as:
$$ P\left(X=k\right)=\binom{k+r-1}{r-1}\left(1-p\right)^kp^r $$
And if we let \(n=k+r\), then the formula can be simplified to give:
$$ P\left(X=k\right)=\binom{n-1}{k}\left(1-p\right)^kp^r,\ \ for\ k=0,\ 1,\ 2\ldots $$
The mean and variance of \(X\) are:
$$ E\left(X\right)=\frac{r(1-p)}{p} $$
and,
$$ Var\left(X\right)=\frac{r\left(1-p\right)}{p^2} $$
We can have alternative definitions of the negative binomial distribution depending on what \(X\) is counting. For example:
Suppose that we wish to model the number of trials, \(n\), given \(r\) successes, that is, \(X\) is counting \(n\) trials given \(r\) successes, the PMF of \(X\) becomes:
$$ P\left(X=n\right)=\binom{n-1}{r-1}p^r\left(1-p\right)^{n-r},\ \ \ \ \ \ \ \ n=r,\ r+1,\ r+2,\ \ldots $$
In this case, the mean of \(X\) becomes,
$$ E\left(X\right)=\frac{r}{p} $$
Similarly, if we wish to model the number of trials, \(n\), given r failures, that is, \(X\) is counting \(n\) trials given \(r\) failures, the PMF of \(X\) becomes:
$$ P\left(X=n\right)=\binom{n-1}{r-1}p^{n-r}\left(1-p\right)^r,\ \ \ \ \ \ \ \ n=r,\ r+1,\ r+2,\ \ldots $$
which can also be expressed as:
$$ P\left(X=n\right)=\binom{n-1}{k}p^k\left(1-p\right)^r,\ \ \ \ \ \ \ \ n=r,\ r+1,\ r+2,\ \ldots $$
If we look at the distribution of a binomial random variable, X:
$$ P\left(X=r\right)=\binom{n}{r}p^k\left(1-p\right)^r,\ \ \ \ \ \ \ r=0,\ 1,\ 2\ldots $$
We can see that the binomial distribution can be likened to the case where we wish to model the number of successes, \(r\), given \(n\) trials, i.e., \(X\) is counting \(r\) successes given \(n\) trials.
A person conducting telephone surveys must get 5 more completed surveys before completing their job. There is a 15% chance of reaching an adult who will complete the survey on each randomly dialed contact.
Find the variance for the number of adults who complete the survey.
Solution
In this case, \(p= 0.15\), \(r= 5\)
Let \(X\) be the number of adults who complete the survey.
$$ P\left(X=n\right)=\binom{n-1}{r-1}\left(1-p\right)^{n-r}p^r $$
$$ E\left(X\right)=\mu=\frac {r}{p}=50.15=33\frac{1}{3} $$
$$ Var\left(X\right)=\sigma=\frac{r\left(1-p\right)}{p^2}=\frac{5\left(1-0.15\right)}{{0.15}^2}=\frac{4.25}{0.0225}=188.89 $$
Given a sequence of independent trials such that we have two outcomes, success or failure, let \(X\) denote the random variable representing the number of failures observed before the 1st success is observed. Then \(X\) is said to be a geometric random variable, denccoted as \(X\sim G\left(1,p\right)\).
Therefore, the geometric distribution is a special case of a negative binomial distribution where the number of successes, \(r\) is equal to 1. The PMF of a geometric random variable \(X\) is given by:
$$ P\left(X=x\right)=\left(1-p\right)^{x-1}p,\ \ \ \ \ \ \ x=1,2,\ldots $$
The mean and variance of a geometric random variable are:
$$ E\left(X\right)=\frac{1}{p} $$
And
$$ Var\left(X\right)=\frac{1-p}{p^2} $$
Suppose that a sample of size \(n\) is randomly selected without replacement from a population of \(N\) items. Suppose further that in the population, \(m\) items can be classified as successes, and \(N-m\) items can be classified as failures. Let \(X\) be the random variable for the number of items selected without replacement from a population. Then \(X\) is said to be a Hypergeometric random variable with parameters \(N\), \(m\), and \(n\) denoted, \(X \sim \text{Hypergeometric}(N,m,n)\)
.
For example, in an experiment, assuming you have a basket containing 20 balls – 10 red and 10 white. You randomly select 6 marbles without replacement and count the number of white balls selected. Such a scenario would be a hypergeometric experiment.
The PMF of a Hypergeometric random variable is given by
$$ P\left(X=x\right)=\frac{\binom{m}{x}\binom{N-m}{n-x}}{\binom{N}{n}} $$
Where:
\(N\)= population size,
\(m\)= number of success states in the population,
\(n\)= number of draws (i.e., quantity drawn in each trial),
\(x\)= number of observed successes.
Note that the probability of success is given by:
$$ p=\frac{m}{N} $$
The mean and variance of a Hypergeometric random variable is given by:
$$ E\left(X\right)=\mu=n\frac{m}{N} $$
And
$$ Var\left(X\right)=n\left(\frac{m}{N}\right)\left(\frac{N-m\ }{N}\right)\left(\frac{N-n}{N-1}\right)=\frac{nm\left(N-m\right)\left(N-n\right)}{N^2(N-1)} $$
Alternatively, since we know that, \(p=\left(\frac{m}{N}\right)\) and that \(q=\left(\frac{N-m\ }{N}\right)\), then, the above variance formula can be expressed as:
$$ Var\left(X\right)=n\left(\frac{m}{N}\right)\left(\frac{N-m\ }{N}\right)\left(\frac{N-n}{N-1}\right)=npq\left(\frac{N-n}{N-1}\right) $$
Where \(q=1-p\)
In an ordinary deck of playing cards, out of the total cards in a deck, there are 26 red cards. Suppose we randomly select 7 cards without replacement. Find the mean, and variance of getting exactly 3 red cards, that is, diamonds or hearts.
Solution
\(N= 52\); (there are a total of 52 cards in a deck)
\(m= 26\) red cards
\(n= 7\)(there are 7 randomly selected cards from the deck)
\(x=3\)(out of the randomly selected cards, 3 are red)
We know that,
$$ \begin{align*}
E\left(X\right) & =\mu=\frac{nm}{N} \\
& =\frac{7\times26}{52}=3.5
\end{align*} $$
For the variance, we have:
$$ \begin{align*} Var\left(X\right) & =\frac{nm\left(N-m\right)\left(N-n\right)}{N^2\left(N-1\right)}
\\ & =\frac{7\times26\left(52-26\right)\left(52-7\right)}{{52}^2\left(52-1\right)} \approx1.5441 \end{align*} $$
Let \(X\) be a Poisson random variable with parameter \(\lambda\), denoted \(X \sim P\left(\lambda\right)\).
The probability mass function (PMF) of a Poisson random variable is given by:
$$ P\left(X=x\right)=\frac {\lambda^x e^{-\lambda}}{xǃ},x=0,1,2,3,\ldots $$
Where \(\lambda\) is the mean number of occurrences in a given fixed interval.
A Poisson random variable can be described as the number of events occurring in a fixed time period if the events occur at a known constant rate, \(\lambda\).
The mean and variance of a Poisson random variable are given by:
$$ E\left(X\right)=Var\left(X\right)=\lambda $$
A statistician has found that Company B is three times more likely to produce eight defective products than it is to produce ten defective products in a batch. The number of defective products in each batch from Company B follows a Poisson distribution with mean \(\lambda\). Calculate the variance of the number of defective products in Company B's batches.
Solution:
We know that the Poisson distribution formula is given by:
$$ P\left(X=x\right)=\frac{\lambda^xe^{-\lambda}}{xǃ},x=0,1,2,3,\ldots $$
From the given information:
$$ P\left(X=8\right)=3P(X=10) $$
$$ \Rightarrow\frac{\lambda^8e^{-\lambda}}{8!}=3\times\frac{\lambda^{10}e^{-\lambda}}{10!} $$
Solving for \(\lambda\):
$$ \begin{align*}
\Rightarrow\frac{\lambda^8}{8!} & =3\times\frac{\lambda^{10}}{10!} \\
\Rightarrow\frac{\lambda^8}{\lambda^{10}} & =3\times \frac{8!}{10!} \\
\Rightarrow\lambda &=5.4772 \end{align*} $$
Using the variance formula for a Poisson distribution:
$$ Var\left(X\right)=\lambda $$
The variance of the number of defective products in Company B's batches is approximately 5.4772.
A random variable \(X\) is said to have a discrete uniform distribution if each of the \(n\) values in its range, consists of an equal probability, \(\frac{1}{n}\), i.e., all outcomes are equally likely, and we write, \(X \sim U\left\{0,\ 1,\ \cdots,\ n-1\right\}\). We can present this in a table as follows:
$$ \begin{array}{c|c}
X & P(X=x) \\ \hline
0 & \frac{1}{n} \\ \hline
1 & \frac{1}{n} \\ \hline
\vdots & \vdots \\ \hline
n-1 & \frac{1}{n}
\end{array} $$
The PMF of a uniform discrete random variable is given by:
$$ P\left(X=x\right)=\frac{1}{n},\ \ x=1,\ 2,\ \ldots,\ n $$
The mean and variance are:
$$ \begin{align*} E\left[X\right] & =\frac{n-1}{2} \\
Var\left(X\right) &=\frac{n^2-1}{12} \end{align*} $$
Suppose that you are conducting an experiment involving the rolling of a standard six-sided die. Find the probability mass function, mean (expected value), and variance for this experiment.
In the experiment of rolling a standard six-sided die, each of the six sides \((n=6)\) is equally likely to show up with probability \frac{1}{6}. Thus,
$$ \begin{align*} {P}\left(X\right) &=\frac{1}{n}=\frac{1}{6} \\
E\left[X\right] & =\frac{n-1}{2}=\frac{6-1}{2}=2.5 \\
Var\left(X\right) &=\frac{{n}^2-1}{12}=\frac{6^2-1}{12}=2.92
\end{align*} $$
Example:
Calculate the expected value and variance of a random variable that is equally likely to take on the values of 5, 6, 7, 8, or 9,
Solution:
Since the random variable is equally likely to take on the value 5, 6, 7, or 8, then \(\widetilde{X}\sim U\left\{5,\ 6,\ 7,\ 8,\ 9\right\}\).
Generally, we know that the standard uniform distribution is denoted as:
$$ X\sim U\left\{0,\ 1,\ 2,\ 3,\ 4\right\} $$
We can, therefore, express the given distribution, \(\widetilde{X}\) in terms of the random variable \(X\).
$$ \begin{align*} \Rightarrow\widetilde{X} &=X+5 \\
\Rightarrow E(\widetilde{X}) &=E(X)+5 \end{align*} $$
But, we know that,
$$ \begin{align*}
E\left[X\right] & =\frac{n-1}{2}=\frac{5-1}{2}=2 \\
\therefore E\left(\widetilde{X}\right) & =E\left(X\right)+5=2+5=7 \end{align*} $$
Alternatively,
$$ E\left(\widetilde{X}\right)=\frac{a+b}{2}=\frac{5+9}{2}=\frac{14}{2}=7 $$
For the variance, we will calculate,
$$ Var\left(\widetilde{X}\right)=Var\left(X+5\right)=Var(X) $$
Using the formula for the variance of a discrete uniform random variable,
$$ \begin{align*} Var\left(X\right) & =\frac{n^2-1}{12}=\frac{5^2-1}{12}=2 \\
\therefore Var\left(\widetilde{X}\right) & =Var\left(X\right)=2 \end{align*} $$
The following are the commonly tested continuous distributions:
A random variable \(X\) is said to be uniformly distributed, or having rectangular distribution on the interval [a, b], denoted by \(X\sim U(a,b)\) if its probability density function is given by:
$$ f\left(x\right)= \left\{ \begin{matrix} \frac{1}{b-a}, & \text{for }a\le x \le b \\ 0, & \text{elsewhere} \end{matrix} \right. $$
The probability density function, \(f(x)\), of a continuous uniform random variable is constant over the possible values of \(x\)
The mean and variance are:
$$ \begin{align*}
E\left(\ X\right) & =\frac{b+a}{2} \\
Var\left(X\right) & =\frac{\left(b-a\right)^2}{12} \end{align*} $$
Suppose the time it takes for a dial to rotate, measured in seconds, follows a uniform distribution between 5 and 30 seconds, inclusive. Calculate the probability density function, mean (expected value), and variance for this dial rotation time.
Solution
Let \(X\) be the dial rotation time.
It follows that \(X \sim U\left(a,b\right)=X \sim U\left(5,30\right)\).
$$ \Rightarrow f\left(x\right)=\frac{1}{30-5}=\frac{1}{25} $$
The mean and variance are:
$$ E\left(X\right)=\frac{b-a}{2}=\frac{30-5}{2}=12.5 $$
And
$$ Var\left(X\right)=\frac{\left(b-a\right)^2}{12}=\frac{\left(30-5\right)^2}{12}=52.0833 $$
An exponential distribution is often associated with the amount of time until some specific event occurs. For instance, the amount of time (starting now) until a volcanic eruption occurs has an exponential distribution.
If a random variable \(X\) has an exponential distribution, we write \(X\sim Exp(\lambda)\), where \(\lambda\) is the rate parameter.
The PDF of an exponential distribution is given by:
$$ f\left(x\right)= \left\{ \begin{matrix} \lambda e^{-\lambda x} & \text{for } x\gt 0 \\ 0 & \text{for } x\le 0 \end{matrix} \right. $$
The mean of an exponential random variable is given by:
$$ E\left(X\right)=\frac{1}{\lambda} $$
And the variance is given by:
$$ Var\left(X\right)=\frac{1}{\lambda^2} $$
A random variable X is said to have a gamma distribution with parameters \(\alpha, \beta \gt 0\), denoted as \(X \sim {\Gamma}(\alpha,\beta)\) if its probability density function is given by:
$$ f\left(x\right)=\left\{ \begin{matrix} \frac{B^\alpha x^{\alpha-1}e^{-\beta x}}{{\Gamma(\alpha)}}, & x\ge 0 \\ 0, & x \lt 0 \end{matrix} \right. $$
The gamma function, denoted by \(\Gamma(x)\), is an extension of the factorial function to real (and complex) numbers.
For \(n\epsilon{1,2,3,\ldots}\), then
$$ \Gamma\left(n\right)=\left(n-1\right)! $$
Generally, for any positive real number a, \(\Gamma\left(a\right)\) is defined as:
$$ \Gamma\left(\alpha\right)=\int_{0}^{\infty}{x^{\alpha-1}e^{-x}dx,\ \ \ \ \text{for}\ \alpha \gt 0} $$
For \(\alpha=1\),
$$ \Gamma\left(1\right)=\int_{0}^{\infty}{e^{-x}dx}=1 $$
By using the change of variables technique, we can let \(x=\lambda y\) so that we have,
$$ \Gamma(\alpha)=\lambda^\alpha\int_{0}^{\infty}{y^{\left(\alpha-1\right)}e^{-\lambda y}}dy\ \ \ \ \ for\ \alpha,\ \lambda \gt 0 $$
Using integration by parts, it can be shown that,
$$ \Gamma\left(\alpha+1\right)=\alpha\Gamma\left(\alpha\right),\ \ \ \ \ for\ \alpha \gt 0 $$
If \(\alpha=n\), where \(n\) consists of a positive integer, the equation above reduces to;
$$ n!=n\times(n-1)! $$
For any positive real number \(\alpha\);
The gamma function,\(\Gamma(\alpha)\), for \(\alpha \gt 0\), is defined as
$$ \Gamma\left(\alpha\right)=\int_{0}^{\infty}{x^{\alpha-1}e^{-x}dx} $$
It satisfies the recursive property
$$ \Gamma\left(\alpha\right)=(\alpha-1)\Gamma(\alpha-1) $$
It is related to the factorial function when \(\alpha=n\) and \(n\) is a positive integer such that \(\Gamma\left(n\right)=(n-1)!\)
For specific values of \(\alpha\), the exact values of \(\Gamma(\alpha)\) exist. For the positive integers, \(\Gamma(n)\) is defined by property 3, that is, \(\ \Gamma\left(n\right)=(n-1)!\)
The gamma function evaluated at \(\alpha =\frac{1}{2}\) is
$$ \Gamma\left(\frac{1}{2}\right)=\sqrt{\pi} $$
It can be shown that,
$$ \begin{align*} E\left(X\right) & =\frac{\alpha}{\beta} \\
Var\left(X\right) & =\frac{\alpha}{\beta^2} \end{align*} $$
We can see that, indeed, the exponential distribution is a special type of gamma distribution with \(\alpha=1\).
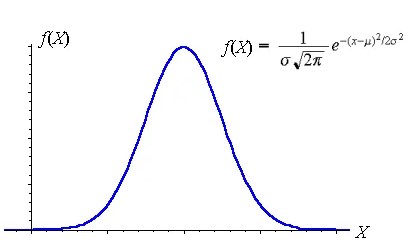
A random variable \(X\) is said to be a normal random variable with parameters \(\mu\) and \(\sigma^2\) (denoted as \(X \sim N(\mu,\sigma^2)\) if its probability density function is given by:
$$ f\left(x;\mu,\sigma^2\right)=\frac{1}{\sqrt{2\pi\sigma^2}}e^\frac{{-\left(x-\mu\right)}^2}{2\sigma^2},\ -\infty \lt x \lt \infty $$
It is symmetric, taking a bell-shaped
If a random variable \(X\) is normally distributed with parameters \(\mu\) and \(\sigma^2\) then, the random variable \(Z\), defined by:
$$ Z=\frac{X-\mu}{\sigma} $$
is normally distributed with mean and standard deviation of 0 and 1, respectively. \(Z\) is, therefore, a standard normal variable.
The density function of a standard normal variable is given by:
$$ f\left(x\right)=\frac{1}{\sqrt{2\pi}}e^\frac{{-x}^2}{2} $$
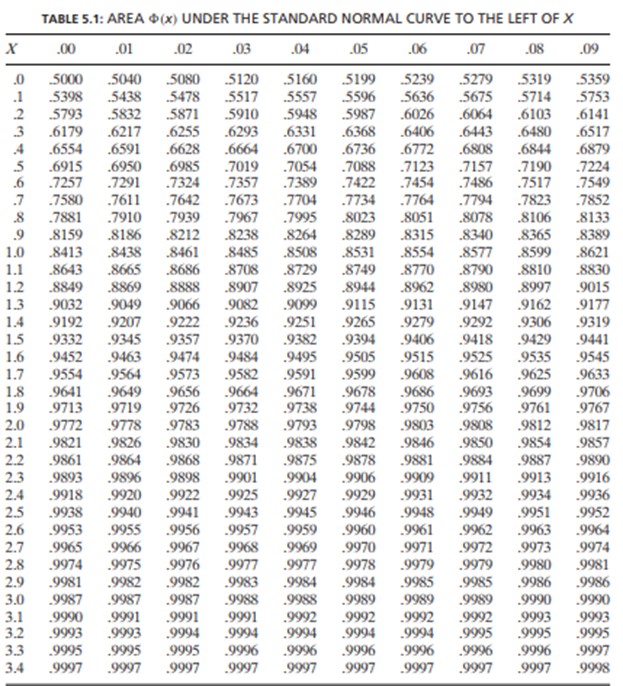
The cumulative distribution function of a standard normal random variable is usually denoted by \(\Phi(x)\). That is:
$$ \Phi\left(x\right)=\frac{1}{\sqrt{2\pi}}\int_{-\infty\ }^{x}{\ e^\frac{{-x}^2}{2}\ dx\ } $$
When using a standard normal table with only positive Z-values, non-negative values of \(\Phi(x)\) are usually tabulated (shown below), while for negative values of \(\Phi(x)\) can be obtained by using the following formula:
$$ \Phi\left(-x\right)=1-\ \Phi\left(x\right),\ \ \ -\infty \lt x \lt \infty $$
Note that the formula above follows from the symmetry property of standard normal density.
Given that \(Z=\frac{X-\mu}{\sigma}\) is a standard normal random variable, and that \(X\) is normally distributed with parameters \(\mu\) and \(\sigma^2\), then the distribution function of \(X\) can be expressed as:
$$ \begin{align*} F_X\left(a\right) & =P\left(X\le a\right)=P\left(\frac{X-\mu}{\sigma}\le\frac{a-\mu}{\sigma}\right) \\ & =P\left(Z\le\frac{a-\mu}{\sigma}\right)=\Phi\left(\frac{a-\mu}{\sigma}\right) \end{align*} $$
One important thing to consider is the continuity correction which we apply when we wish to find the probability of a variable being less than or equal to some value or the probability of a random variable being greater than or equal to some value written as \(P(X\le x)\) or \(P(X\geq x)\).
Now, to find the approximations of the above probabilities, we use the following relationship:
$$ P\left(X\le x\right)\approx P(X \lt x+0.5) \\
P\left(X\geq x\right)\approx P(X \gt x-0.5) $$
Suppose \(X\) is a normal random variable with mean 4 and variance 3. Find \(P(X\le5)\).
Solution:
$$ P\left(X\le5\right)\approx P\left(X<5+0.5\right)=P\left(X<5.5\right) $$
Now,
$$ \begin{align*} P\left(X\le5\right) & \approx P\left(X \lt 5.5\right) \\
=P\left(Z\lt \frac{5.5-4}{\sqrt3}\right) & =P(Z \lt 0.8660) \end{align*} $$
And from the standard normal table,
$$ P\left(Z \lt 0.8660\right)=0.8067 $$
If \(X\) is a normal random variable with parameters \(\mu=5\) and \(\sigma^2=16\), calculate \(P(3 \lt X \lt 6)\).
Solution
We need to express \(P(3 \lt X \lt 6)\) into a standard normal variate such that:
$$ \begin{align*} P\left(3 \lt X \lt 6\right) & =P\left(\frac{3-5}{4} \lt \frac{X-5}{4} \lt \frac{6-5}{4}\right) \\
& =P\left(-0.5 \lt Z \lt 0.25\right) \\
& =\Phi\left(0.25\right)-\Phi(-0.5) \\
& =\Phi\left(0.25\right)-\left[1-\Phi\left(0.5\right)\right] \\
\end{align*} $$
Now, using a standard normal table, we have:
$$ =\Phi\left(0.25\right)-\left[1-\Phi\left(0.5\right)\right]=0.5987-\left[1-0.6915\right]=0.2902 $$
Question
A well-known drone manufacturer offers an extended warranty of 8 years on their top-tier drone model. The warranty assures a replacement either if the drone experiences motor failure before reaching 8 years or upon the completion of the 8-year duration. Let S represent the age of the drone at the time of replacement due to motor failure. The drone's age at motor failure, denoted by \(T\), has the following density function:
$$ \left\{ \begin{matrix} \frac{1}{8} & \text{for } 0\lt t \lt5 \\ 0 & \text{elsewhere} \end{matrix} \right. $$
Find the standard deviation of \(S\).
- 5.33
- 6.25
- 7.11
- 8.00
Solution
The correct answer is A.
Step 1: Determine \(E[S]\)
From the provided density function:
$$ E[S] = \int_{0}^{8}{t\times\frac{1}{8}dt=\frac{1}{8}\times\frac{t^2}{2}\left|\frac{8}{0}\right.}=4 $$
Step 2: Determine \(E\left[S^2\right]\)
$$ E[S^2]=\int_{0}^{8}{t^2\times\frac{1}{8}dt=\frac{1}{8}\times\frac{t^3}{3} \left| \frac{8}{0} \right.}=21.33 $$
Step 3: Calculate the variance of \(S\)
$$ \begin{align*} Var[S]&=E\left[S^2\right]-\left(E\left[S\right]\right)^2 \\
& = 21.33 – 16 = 5.33 \end{align*} $$Step 5: Calculate the standard deviation of \(S\)
$$ \sigma_s=\sqrt{5.33}=2.31 $$
Learning Outcome
Topic 2.d: Univariate Random Variables - Explain and calculate variance, standard deviation, and coefficient of variation.
Offered by AnalystPrep


Get Ahead on Your Study Prep This Cyber Monday! Save 35% on all CFA® and FRM® Unlimited Packages. Use code CYBERMONDAY at checkout. Offer ends Dec 1st.