


Calculating and Interpreting Quartiles ...
Quartiles, quintiles, deciles, and percentiles are values or cut points that partition a... Read More

Confidence interval (CI) refers to a range of values within which statisticians believe the actual value of a certain population parameter lies. It is different from from a point estimate which is a single, specific numerical value.
When constructing confidence intervals, we must specify the probability that the interval contains the true value of the parameter of interest. This probability is represented by (1 – α), where α is the level of significance. In statistical terminology, (1- α) is called the degree of confidence or certainty.
We define a 100 (1 – α)% confidence interval for a given parameter, say θ, by specifying two random variables, θ’1(X) and θ’2(X), such that P{θ’1(X) < θ < θ’2(X)} = 1 – α.
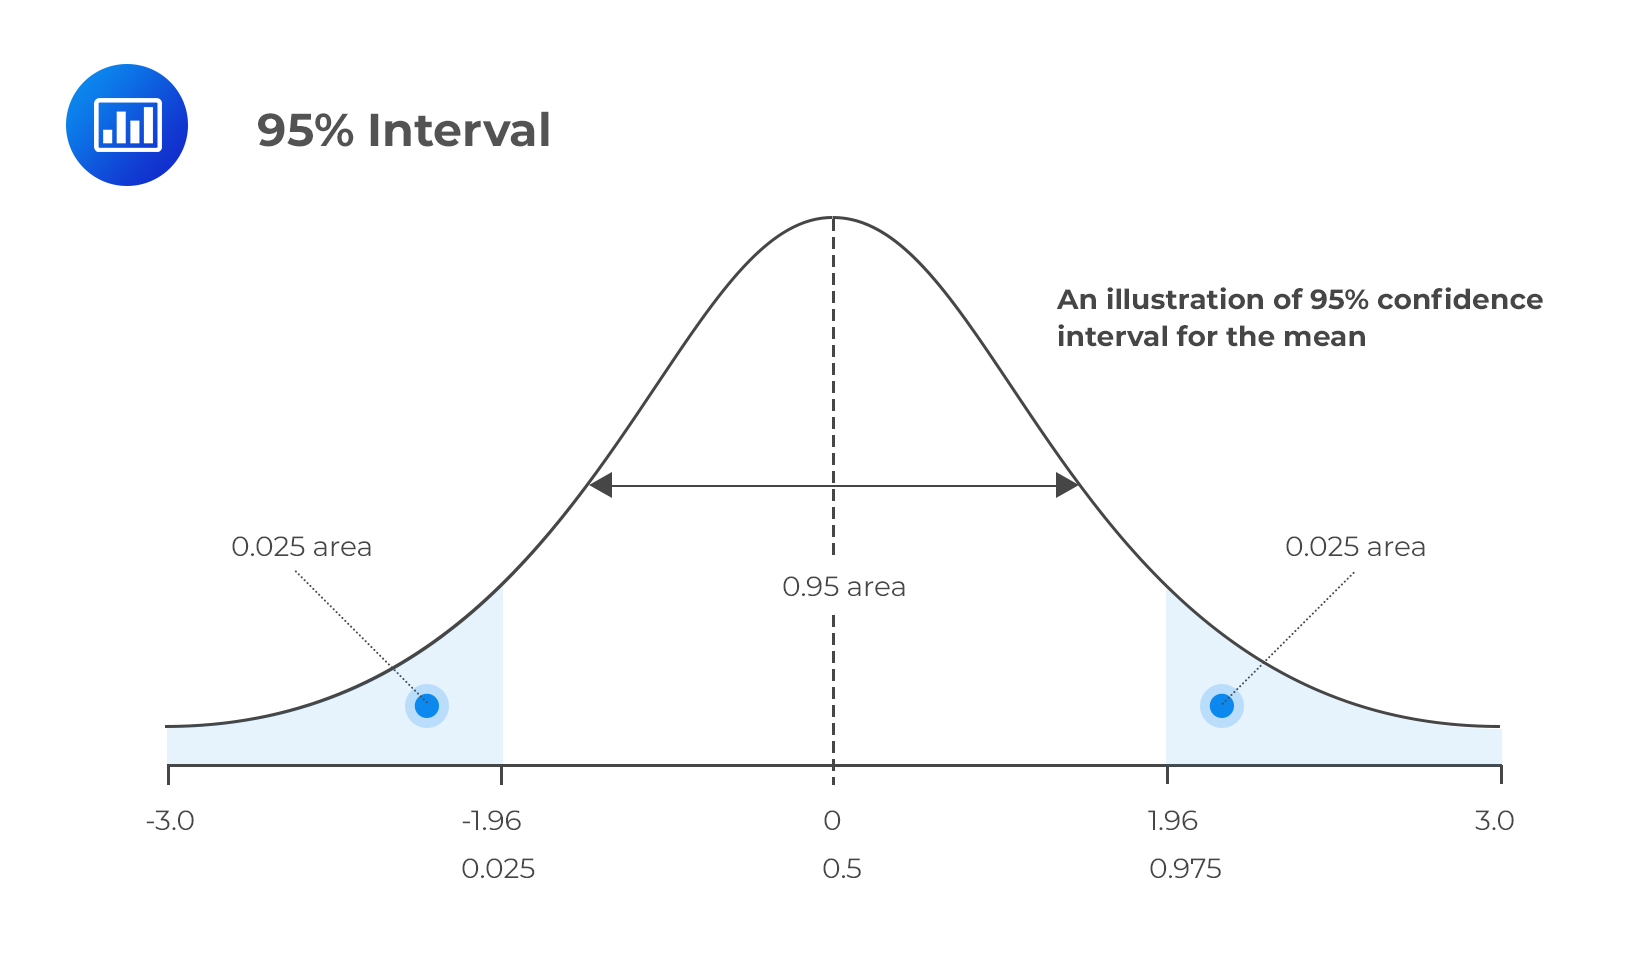
It happens that α = 0.05 is the most common case in examinations and practice. This leads to a 95% confidence interval.
Consequently, P{θ’1(X) < θ < θ’2(X)} = 0.95 specifies {θ’1(X), θ’2(X)} as a 95% confidence interval for θ. The main task for a candidate lies in being able to construct and interpret a confidence interval. Therefore, the CI for θ above could be interpreted to mean that if we were to construct similar intervals using samples of equal sizes from the same population, 95% of the intervals would contain the true parameter value and just 5% would not contain it, hence, the phrase “confidence” interval.
To construct a confidence interval, one must come up with an appropriate value that will be subtracted and added to a point estimate. A confidence interval appears as follows:
$$ \text{CI} =\text{Point estimate} \pm \text{Reliability factor} × \text{Standard error} $$
Where:
The point estimate refers to a calculated value of the sample statistic such as the mean, X.
The reliability factor is a value that depends on the sampling distribution involved and (1 – α), the probability that the point estimate is contained in the confidence interval.
The Standard error is the standard error of the point estimate.
We can calculate the confidence interval for the mean as:
$$ x \pm z_{\alpha/2} × \frac {\sigma}{\sqrt n} $$
Here, the reliability factor is zα/2. The z-score leaves a probability of α/2 on the upper tail (right-hand tail) of the standard normal distribution.
The table below represents the standard normal distributions commonly used by analysts.
$$ \begin{array}{c|c|c} \text{Degree of confidence} & \text{Level of significance(one-tailed)} & {z_{\alpha/2}} \\ \hline {90\%} & {10\%} & {1.645} \\ \hline {95\%} & {5\%} & {1.960} \\ \hline {99\%} & {1\%} & {2.575} \\ \end{array} $$
When the variance is unknown, we construct the confidence interval for the mean by replacing the z-score in the first scenario with the t-score. Similarly, we replace the unknown σ with S, the standard deviation of the sample mean. Therefore,
$$ CI = x \pm t_{\alpha/2} × \frac {S}{\sqrt n} $$
tα/2 is the t-score that leaves a probability of α/2 on the upper tail of the t-distribution. The number of degrees of freedom is determined by the sample size such that the degrees of freedom (df) = n – 1.
Thanks to the Central Limit Theorem, we can approximate just about any non-normal distribution the same way we do a normal one, provided the sample size is large (n ≥ 30). Furthermore, we can use the relevant z-score when constructing a confidence interval for the population mean.
However, some analysts may advocate for the use of a t-distribution in scenarios where the distribution is non-normal, and the population variance is unknown, even if n ≥ 30. Regardless of such arguments, the use of the z statistic would still be justified under such circumstances, provided the central limit theorem is applied correctly.
A teacher draws a sample of five 12-year-old children from a school’s population and records their heights in centimeters as follows:
$$ \{124, 124, 128, 130, 127\} $$
Assume that the heights have a normal distribution where both μ and σ are unknown. Calculate a two-tailed 95% confidence interval for the mean height of 12-year-olds.
Solution
Since the variance is unknown and the sample size is less than 30, we should use the t-score instead of the z-score, even if the distribution is normal. As such, we will calculate the confidence interval for the mean as follows:
$$ CI = x \pm t_{\alpha/2} × \frac {S}{\sqrt n} $$
From the data, X = 126.6 and S2 = 6.8
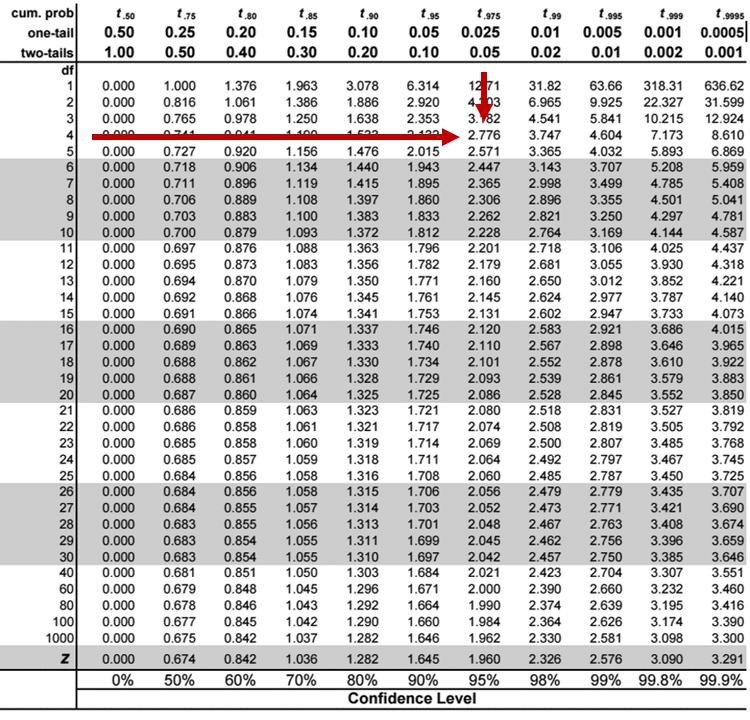
You can read off the t-score value from the t-distribution table where you will find that,
$$ t_{4, 0.025} = 2.776 $$
Please, refer to the t-table below to find the critical t-value.
Therefore,
$$ \begin{align*}
CI & = 126.6 \pm 2.776 \times \frac {\sqrt 6.8}{\sqrt 5} \\
& = 126.6 \pm 3.2373 \\
\end{align*} $$
Therefore, our confidence interval for μ is (123.36, 129.84).
Question
Use the data from the example above to calculate a two-tailed 99% confidence interval for the population mean.
- (125.3, 127.91)
- (117.9, 135.3)
- (116.6, 136.6)
Solution
The correct answer is A.
$$ CI = x \pm t_{\alpha/2} × \frac {S}{\sqrt n} $$
$$ t_{4, 0.005 }= 4.604 $$
The other inputs remain the same as in the example above.
Therefore,
$$ \begin{align*}
CI & = 126.6 \pm 4.604× \frac {\sqrt 6.8}{\sqrt 5} \\
& = 126.6 \pm 5.4391 \\
\end{align*} $$The confidence interval for the mean is (121.16, 132.01).
As you might have observed, the interval widens as the level of confidence increases.
Confidence intervals are important CFA Level I Quantitative Methods concepts. Candidates may be tested on estimating population parameters, selecting the correct distribution, and interpreting interval estimates under different assumptions.
To strengthen your preparation, explore the CFA Level I study program with practice questions, mock exams, and guided lessons.
Work through confidence interval questions, strengthen your statistical interpretation, and build exam confidence.


Get Ahead on Your Study Prep This Cyber Monday! Save 35% on all CFA® and FRM® Unlimited Packages. Use code CYBERMONDAY at checkout. Offer ends Dec 1st.