Other Return Measures
Other Return Measures Gross and Net Return The gross return is what an... Read More
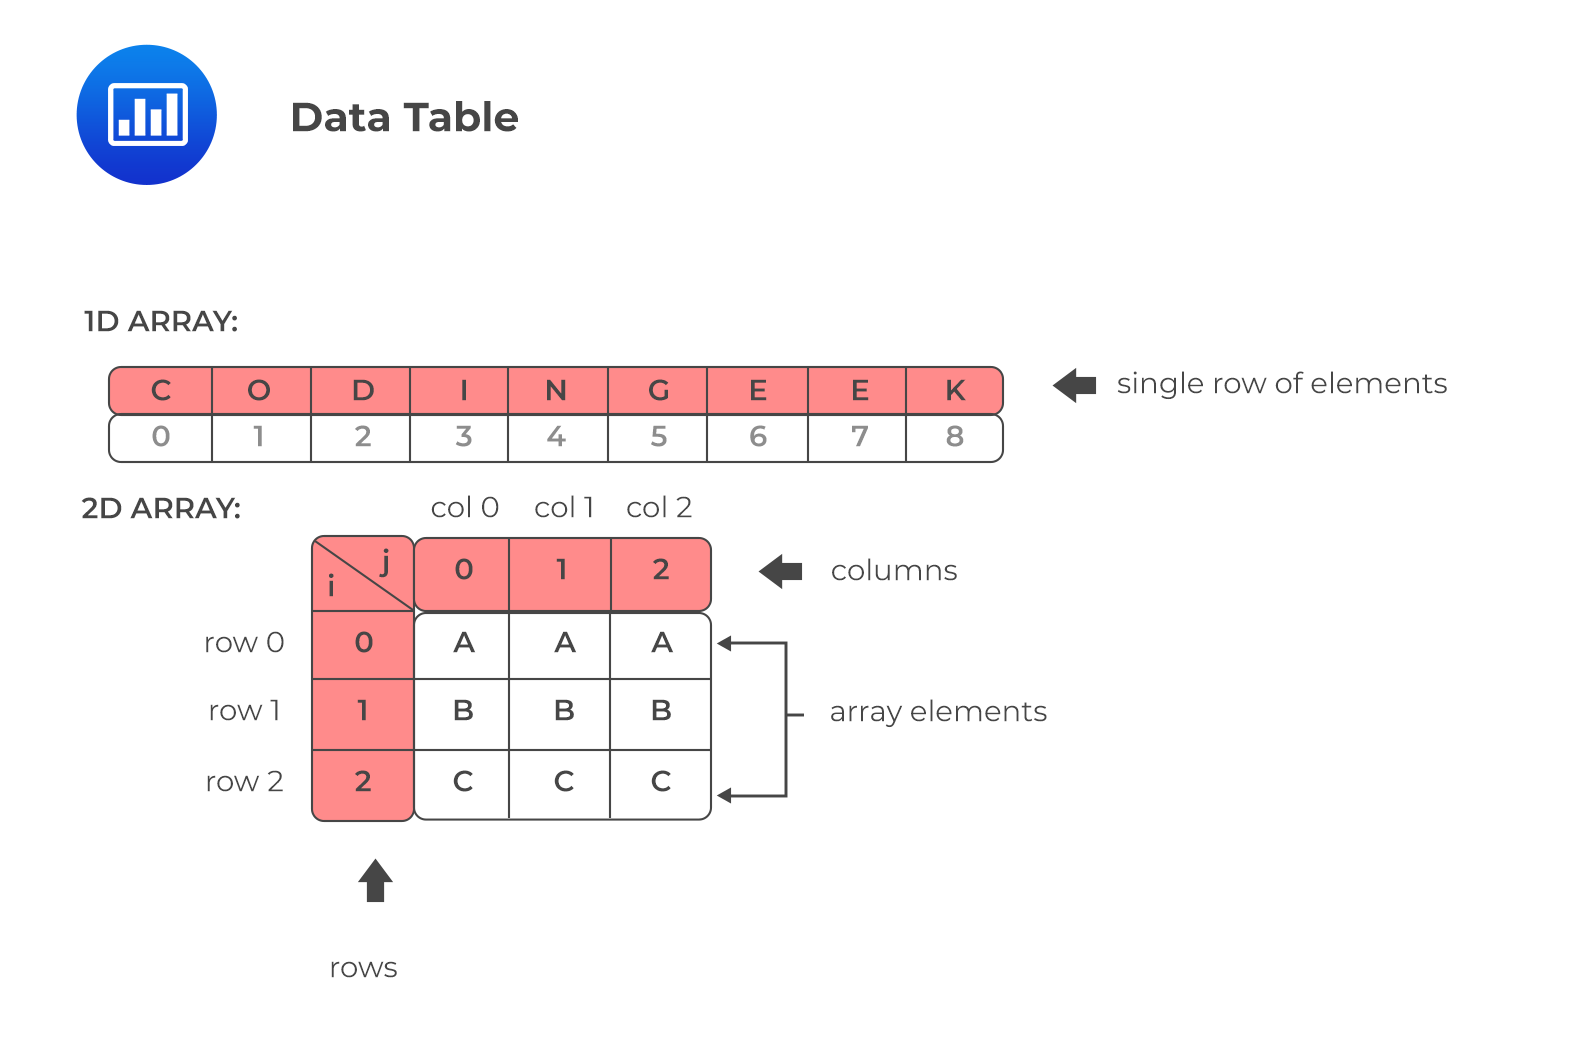
Typically, raw data can be organized into the following two formats for quantitative analysis:

Refer to the following two arrays and identify the one which is one-dimensional and the other which is two-dimensional.
$$\begin{array}{}\textbf{Array 1}\end{array}$$
$$\begin{array}{l|c|c|c|c} \textbf{Year}&\textbf{2017}&\textbf{2018}&\textbf{2019}&\textbf{2020}\\ \hline \text{Closing price of}&5.7&5.22&5.13&5.17\\ \text{stock (in USD)}&{}&{}&{}&{}\\ \end{array}$$
$$\begin{array}{}\textbf{Array 2}\end{array}$$
$$
\begin{aligned}
&\textbf { Fertilizer Sector Profit after Tax (PKR MN) } \\
&\begin{array}{c|c|c}
\textbf { Company } & \textbf { 2QFY21 } & \textbf { 2QFY22 } \\
\hline \text { A } & 2,315 & 981 \\
\hline \text { B } & 2,478 & 272 \\
\hline \text { C } & 820 & 222 \\
\hline \text { D } & 965 & 10 \\
\end{array}
\end{aligned}
$$
Solution
Array 1 represents a one-dimensional array, while Array 2 represents a two-dimensional array.
Question
Which of the following statements is most likely correct? A two-dimensional array is:
- Most suitable for organizing raw panel data.
- Suitable for organizing raw time-series data of a single variable.
- Appropriate for organizing raw cross-sectional data.
Solution
The correct answer is A.
Remember that panel data consist of observations made on one or more variables for multiple observational units. In other words, panel data is a combination of time series data and cross-sectional data.
Therefore, a two-dimensional array would be suitable for organizing panel data. This is because it consists of columns to accommodate variable(s) for the observational units and rows that accommodate the observations made through time.
B is incorrect. A one-dimensional array is suitable for organizing time-series data of a single variable.
C is incorrect. A one-dimensional array is suitable for organizing cross-sectional data.
Get Ahead on Your Study Prep This Cyber Monday! Save 35% on all CFA® and FRM® Unlimited Packages. Use code CYBERMONDAY at checkout. Offer ends Dec 1st.