


Standardized Measurement Approach for ...
The Basel Committee emphasizes consistency in implementing post-crisis controlling reforms. This consistency improves... Read More

After completing this reading, you should be able to:
Markets are considered efficient if investors can measure the performance of their asset managers. In this chapter, we will delve into the measurement of portfolio returns, risk adjustments, and challenges arising from changes in the risk characteristics of portfolios.
The time-weighted rate of return, also called the geometric mean return, is a measure of the compound growth rate of a portfolio. In simple words, the returns for each interval of time are multiplied by each other. This measure banishes the distorting effects on rates of growth created by money inflows and outflows, making it suitable for comparing the returns of investment managers.
Suppose that a portfolio manager wants to evaluate a portfolio’s performance over ten years. The geometric average rate of return, \({ \text{r} }_{ \text{G} }\), is expressed as;
$$ \left(1+{ \text{r} }_{ \text{G} } \right)^{10}=\left(1+ {\text{r}}_{1} \right)\left(1+{\text{r}}_{1} \right)…\left(1+{\text{r}}_{10} \right) $$
Where \( \left(1+{\text{r}}_{1} \right)\left(1+{\text{r}}_{2} \right)…\left(1+{\text{r}}_{10} \right) \) is the compounded final value of a unit dollar investment that earns the ten annual rates of return.
The annualized geometric average rate of return can be expressed as follows:
$$ \begin{align*} 1+{ \text{r} }_{ \text{G} }&= \left(\left(1+{\text{r}}_{1} \right)\left(1+{\text{r}}_{2} \right)…\left(1+{\text{r}}_{10} \right)\right)^{\cfrac{1}{10}} \\ \text{TWR}&=\left[ \left(1+{\text{a}}_{1} \right) \times \left(1+{\text{a}}_{2} \right) \times \dots \left(1+{\text{a}}_{ \text{n} } \right) \right]-1 \end{align*} $$
Where:
\(TWR\) = Time-weighted rate of return; and
\(n\) = Number of subperiods.
The return for any subperiod \(i\) is:
$$ \text{a}_{ \text{i} } \left( \text{Holding period portfolio return} \right) = \cfrac { \text{End value}-\text{Initial value}+\text{Cash flow} }{ \text{Initial value}} $$
The dollar-weighted rate of return (DWR) gauges the rate of return of a portfolio, taking into account the timing of cash flows. It is equivalent to the internal rate of return (IRR). It is calculated by finding the rate of return that will set the discounted values of all cash flows equivalent to the value of the initial investment.
To compute DWRR, we use;
$$ { \text{PV} }_{ \text{0} }={ \text{PV} }_{ \text{I} }={ \text{C} }_{ \text{0} }+\cfrac { { \text{C} }_{ 1 } }{ 1+\text{r} } +\cfrac { { \text{C} }_{ 2 } }{ { \left( 1+\text{r} \right) }^{ 2 } } +\dots +\cfrac { { \text{C} }_{ \text{N} } }{ { \left( 1+\text{r} \right) }^{ \text{N} } } $$
Where:
\({ \text{PV} }_{ \text{O} }\) = Cash outflows;
\({ \text{PV} }_{ \text{I} }\) = Cash inflows;
\({ \text{C} }_{ \text{0} }\) = Initial cash outlay;
\({ \text{C} }_{ 1 },{ \text{C} }_{ 2 },…,{ \text{C} }_{ \text{N} }\) = Cash flows in each subperiod;
\(r\) = Dollar-weighted rate of return; and
\(N\) = The number of periods.
Suppose the following information is available regarding a certain project:
$$ \begin{array}{c|c|l} \textbf{Time} & \textbf{Outlay }($) & \textbf{Description} \\ \hline \textbf{0} & \text{40} & \text{To purchase the first share} \\ \hline \textbf{1} & \text{43} & \text{To purchase a share a year later} \\ \hline \textbf{} & \textbf{Proceeds} ($) & {} \\ \hline \textbf{1} & \text{3} & \text{Dividend from the initially purchased share} \\ \hline \textbf{2} & \text{5} & \text{Total dividends from the 2 shares held in the second year} \\ \textbf{} & \text{100} & \text{Received from selling both shares at }$50 \text{ each} \end{array} $$
Calculate:
i. The dollar-weighted rate of return
The cash flows for this project are shown in the following timeline:
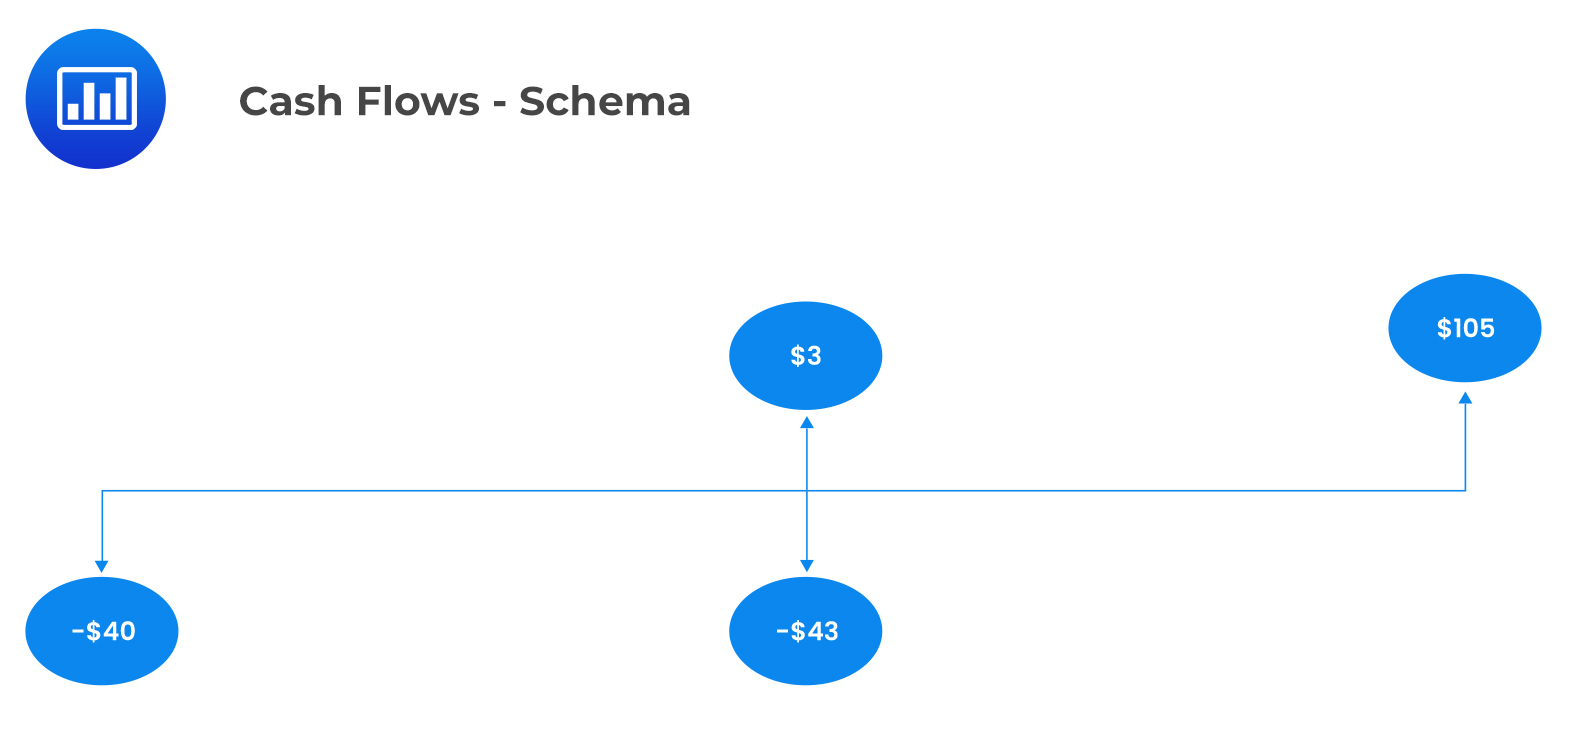 $$ \begin{align*} $40 & =\cfrac { \left( -$43+$3 \right) }{ { \left( 1+\text{r} \right) }^{ 1 } } +\cfrac { $105 }{ { \left( 1+\text{r} \right) }^{ 2 } } \\ \text{r} & =19.553\% \end{align*} $$
ii. The time-weighted rate of return is calculated as follows:
$$ \begin{align*} \text{r}_1 & =\cfrac{$43-40+3}{40}=0.15 \\ \text{r}_2 & =\cfrac{$50-$43+$2.5}{$43}=0.22093 \\ \text{r}_{ \text{G} } & =\left[\left(1.15 \right)\left(1.22093 \right)\right]^{0.5}-1=18.493\% \end{align*} $$
The dollar-weighted average rate of return is higher than the time-weighted rate of return in this case because more investment is made in year 2 when the return is higher.
Once the performance based on average return has been evaluated, it is important to adjust the returns for risk before relevant comparisons are made. The commonly used adjustment method is comparing the rates of return with those of other funds with the same risk characteristics. It works by grouping funds with similar risk properties together, for example, putting growth stock equity funds into one comparison category. After that, each portfolio manager is ranked based on the relative performance within the comparison group.
The conventional approaches to performance evaluation are as follows.
Sharpe’s ratio is defined as the excess return over a sub-period divided by the standard deviation of returns over the same period. It is given by:
$$ \cfrac { { \bar { \text{r} } }_{ \text{p} }-{ \bar { \text{r} } }_{ \text{f} } }{ { \sigma }_{ \text{p} } } $$
Where:
\({ \bar { \text{r} } }_{ \text{p} }\) = Average return on the portfolio;
\( { \text{r} }_{ \text{p} }\) = Average risk-free rate; and
\({\sigma }_{ \text{p} }\) = Standard deviation for the portfolio.
Sharpe’s ratio gives a reward for the total portfolio risk.
The portfolio with the greatest Sharpe ratio is said to have the best performance. Additionally, for an actively managed portfolio to be considered acceptable for the investor’s optimal risky portfolio, it must have a higher Sharpe ratio than the market index.
Treynor’s measure is defined as the excess return per unit of risk, i.e., the ratio of the expected excess return to the systematic risk (beta). This risk-adjusted performance measure is given by:
$$ \cfrac { { \bar { \text{r} } }_{ \text{p} }-{ \bar { \text{r} } }_{ \text{f} } }{ { \beta }_{ \text{p} } } $$
Where:
\({ \bar { \text{r} } }_{ \text{p} }\) = Average return on the portfolio;
\( { \bar{ \text{r} } }_{ \text{f} }\) = Average risk-free rate; and
\({ \beta }_{ \text{p} }\) = Weighted average beta for the portfolio.
Unlike the Sharpe ratio, Treynor’s measure uses systematic risk rather than total portfolio risk. When dealing with several managers, systematic risk is a more suitable measure of risk relative to cumulative risk.
Suppose that \({ \text{w}}_{ \text{P} }\) is invested in portfolio p, and the rest in a risk-free asset. The adjusted portfolio \({ \text{P} }^{*}\) will have beta values proportional to portfolio P’s beta scaled down by \({ \text{w}}_{ \text{P} }\):
$$ {\beta}_{ {P}^{*} }={ \text{w}}_{ \text{P} } { \beta }_{ \text{P} } $$
Suppose that a proportion of 0.88 is invested in portfolio P, and the rest in T-bills. The beta and alpha statistics for portfolio P are 1.8 and 3, respectively. What is the value of beta for the resultant portfolio?
Formula:
$$ \begin{align*} {\beta}_{ {P}^{*} }&={ \text{w}}_{ \text{P} } { \beta }_{ \text{P} } \\ { \text{w}}_{ \text{P} }&=0.88 \\ { \beta }_{ \text{P} }&=1.8 \\ ∴{\beta}_{ {P}^{*} }&=0.88 \times 1.8=1.584 \end{align*} $$
Jensen’s alpha (\({ \alpha }_{ \text{p} }\)) is defined as the average return on a portfolio, over and above the return predicted by the CAPM. Similar to the Treynor measure, Jensen’s alpha only takes into account the systematic risk of the portfolio and, hence, does not indicate the diversification in the portfolio.
It is given by:
$$ { \alpha }_{ \text{P} }={ \bar { \text{r} } }_{ \text{p} }-\left[ { \bar { \text{r} } }_{ \text{f} } +{ \beta }_{ \text{p} }\left( { \bar { \text{r} } }_{ \text{m} }-{ \bar { \text{r} } }_{ \text{f} } \right)\right] $$
Where:
\({ \bar { \text{r} } }_{ \text{p} }\) = Average return on the portfolio;
\({ \text{r} }_{ \text{f} }\) = Average risk-free rate;
\({ \text{r} }_{ \text{M} }\) = Average return on the market; and
\({ \beta }_{ \text{p} }\) = Weighted average beta for the portfolio.
A positive \({ \alpha}_{ \text{P} }\) implies that the portfolio has the best performance.
The following information relates to two portfolios M and N.
$$ \begin{array}{l|c|c|c} {} & \textbf{Portfolio M} & \textbf{Portfolio N} & \textbf{Market} \\ \hline \text{Beta} & {0.70} & {1.40} & {1.0} \\ \hline \text{Excess return} {\left({ \bar { \text{r} } }-{ \bar { \text{r} } }_{ \text{f} } \right)} & {9\%} & {18\%} & {10\%} \\ \hline \text{Alpha} & {0.02} & {0.04} & {0} \end{array} $$
i. Portfolios’ Jensen’s alpha
$$ { \alpha }_{ \text{p} }=\left( { \bar { \text{r} } }-{ \bar { \text{r} } }_{ \text{f} } \right) -\beta \left( { \bar { \text{r} } }_{ \text{m} }-{ \bar { \text{r} } }_{ \text{f} } \right) \\ { \alpha }_{ \text{M} }=0.09-0.7(0.10)=0.02 \\ { \alpha }_{ \text{N} }=0.18-1.4(0.10)=0.04 $$
Both \({ \alpha }\)’s are positive, implying that both portfolios outperformed the market.
ii. Adjusted Portfolios’ Jensen’s alpha
$$ \alpha_{{ \text{M} }^{*}}={ \text{w} }_{ \text{M} } { \alpha }_{ \text{M} } =0.02{ \text{w} }_{ \text{M} } $$
The information ratio (IR) is the ratio of the portfolio’s α (active return) to the portfolio’s tracking error (nonsystematic risk). It quantifies the tradeoff between alpha and diversifiable risk.
$$ \text{IR}=\cfrac{{ \alpha }_{ \text{p} }}{ \sigma \left({\text{e}}_{\text{p}} \right)} $$
A negative information ratio implies the absence of excess returns. Investors will look for a portfolio with the highest information ratio because it shows a high return ability, i.e., it carries the best performance.
Information ratio is a suitable performance measure for a hedge fund. Therefore, investors will look for hedge funds whose managers have the highest information ratios.
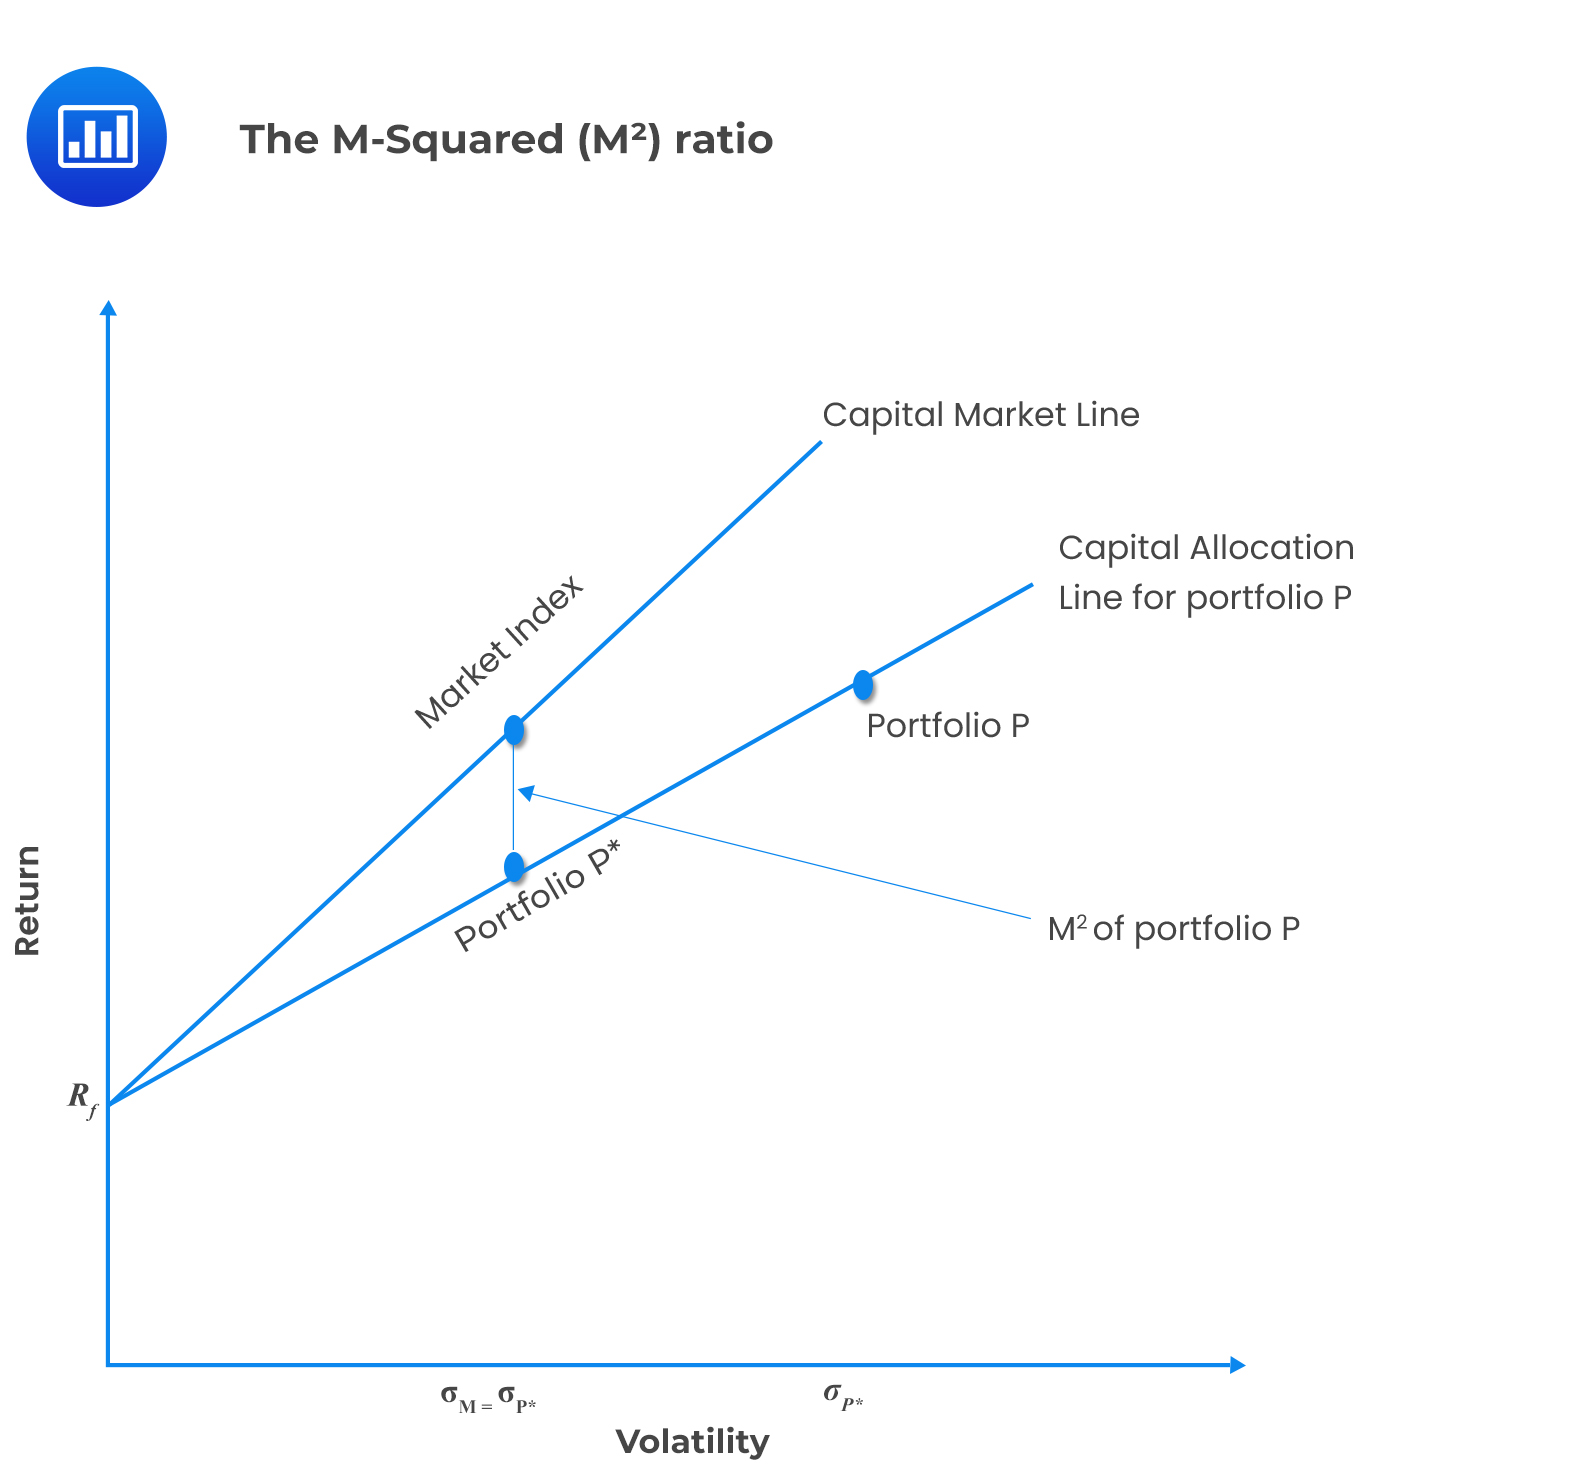
The \({ \text{M} }^{2}\) (Modigliani-squared) uses total volatility for measuring risk. Unlike the Sharpe ratio, the result for \({ \text{M} }^{2}\) can easily be interpreted.
To obtain \({ \text{M} }^{2}\), an adjusted portfolio (P*) that has the same standard deviation as the market index is created.
For example, if a percentage of weight (\({ \text{w} }_{ \text{P} }\)) is invested in portfolio P, and the remaining (1-\({ \text{w} }_{ \text{p} }\)) in T-bills, then the return of the adjusted portfolio P* is given by:
$$ \text{r}_{{ \text{P} }^{*}}={ \text{w} }_{ \text{P} } { \text{r} }_{ \text{P} }+(1-{ \text{w} }_{ \text{P} } ) { \text{r} }_{ \text{f} } $$
Where:
\({ \text{r} }_{ \text{P} }\) = Return for portfolio P,
\({ \text{r} }_{ \text{f} }\) = Return for the risk-free asset, and
\({ \text{w} }_{ \text{P} }\) = Weight in portfolio P.
Comparing the returns of the market index and the adjusted portfolio gives the value of \({ \text{M} }^{2}\).
Thus,
$$ { \text{M} }^{2}=({ \text{r} }_{ \text{P} }-{ \text{r} }_{ \text{f} } ) { \text{w} }_{ \text{P} }-({ \text{r} }_{ \text{m} }-{ \text{r} }_{ \text{f} } )=\text{r}_{{ \text{P} }^{*}}-{ \text{r} }_{ \text{m} } $$
A positive \({ \text{M} }^{2}\) value implies a portfolio with the best performance.
\({ \text{M} }^{2}\) of a portfolio P can be illustrated in the following diagram:
 Example: Calculating the \({ \text{M} }^{2}\) Measure
Assume that a managed portfolio has a return of 30% and a volatility of returns of 40%. On the other hand, the market has a hypothetical return of 23% and a volatility of returns of 28%. The return of the risk-free asset is 4%.
Calculate \({ \text{M} }^{2}\).
$$ \begin{align*} { \text{M} }^{2} & =({ \text{r} }_{ \text{P} }-{ \text{r} }_{ \text{f} } ) { \text{w} }_{ \text{P} }-({ \text{r} }_{ \text{m} }-{ \text{r} }_{ \text{f} } )=\text{r}_{{ \text{P} }^{*}}-{ \text{r} }_{ \text{m} } \\ & =\left(30\%-4\% \right)\times \cfrac{28}{40}-\left(23\%-4\% \right)=-0.80\% \end{align*} $$
This means that the managed portfolio underperformed relative to the market.
In conclusion, a negative \({ \text{M} }^{2}\) implies the underperformance of the managed portfolio relative to the market. Consider two portfolios, A and B, representing the entire investment. A will be preferred to B if it has a higher Sharpe ratio and better \(M^2\).
Treynor’s measure is a measure of the returns earned more than that which would have been earned on a completely diversified portfolio, or T-Bills, per each unit of market risk assumed. As mentioned earlier, systemic risk is used instead of the total risk. A higher Treynor’s Ratio indicates a better performance of the portfolio.
For example, if two portfolios A and B are competing for a role as one of several sub-portfolios, A will dominate B if its Treynor measure is higher than that of B.
The following information relates to two portfolios A and B
$$ \begin{array}{l|c|c|c} {} & \textbf{Portfolio A} & \textbf{Portfolio B} & \textbf{Market} \\ \hline \text{Beta} & {0.70} & {1.40} & {1.0} \\ \hline \text{Excess return} {\left({ \bar { \text{r} } }-{ \bar { \text{r} } }_{ \text{f} } \right)} & {9\%} & {18\%} & {10\%} \\ \hline \text{Alpha} & {0.02} & {0.04} & {0} \end{array} $$
This information can be demonstrated in the following diagram
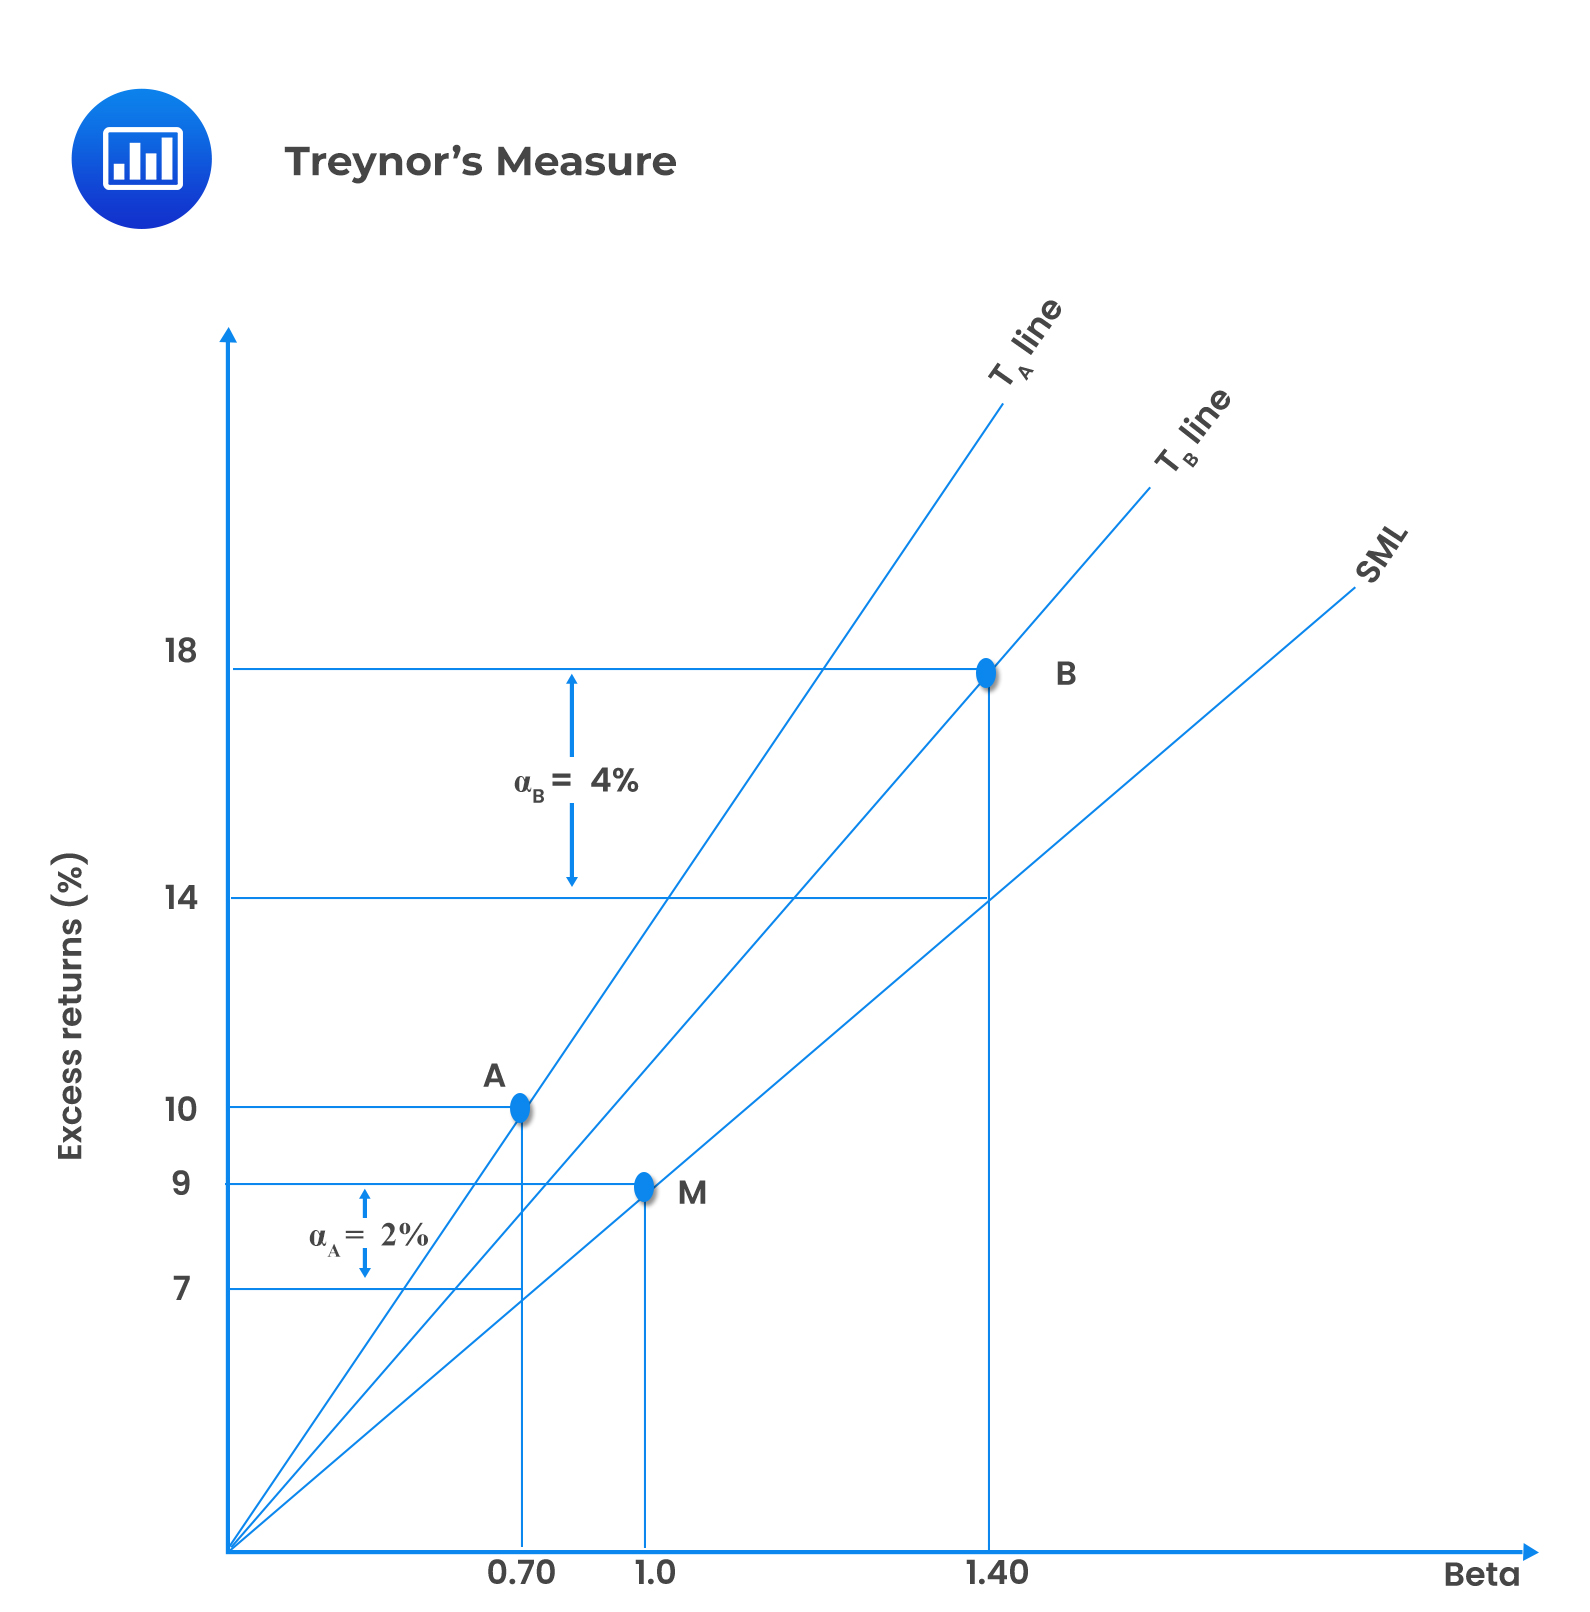 The slope of the T-line shows the tradeoff between the excess return and beta. The slope of A is expressed as:
$$ { \text{T} }_{ \text{A} }=\cfrac { { \bar { \text{r} } }_{ \text{A} }-{ \bar { \text{r} } }_{ \text{f} } }{ { \beta }_{ \text{A} } } $$
Where \({ \text{T} }_{ \text{A} }\) is the slope for A.
The market excess return can be subtracted from the Treynor’s measure to obtain the difference between the return on the \({ \text{T} }_{ \text{A} }\) line and the security market line, where \({ \beta }=1\). Therefore, we can use the same premise for \({ \text{M} }^{2}\). Treynor’s measure is given in percentage, just like \({ \text{M} }^{2}\).
It is crucial to note that the difference between \({ \text{M} }^{2}\) and \({ \text{T} }^{2}\) correspond to the difference between Sharpe’s and Treynor’s measures. In the case of two portfolios, the one with positive \({ \text{M} }^{2}\) and higher Treynor measure is preferred.
Determining the significance level of a performance measure is important to avoid inherent errors in investment outcomes.
The correlation coefficient between a portfolio and the market index is given by:
$$ \rho ={ \left( \cfrac { { \beta }^{ 2 }{ \sigma }_{ \text{M} }^{ 2 } }{ { \beta }^{ 2 }{ \sigma }_{ \text{M} }^{ 2 }+{ \sigma }^{ 2 }\left( \text{e} \right) } \right) }^{ \cfrac { 1 }{ 2 } } $$
Portfolio alpha is key in establishing the performance of the portfolio. A positive alpha of 10 (+10) implies that the return of the portfolio exceeded the benchmark index’s performance by 10%. An alpha of negative 10 (-10) means that the portfolio underperformed the benchmark index by 10%. An alpha of zero indicates that the investment’s return matched the overall market return, as shown by the benchmark index.
However, the performance implied by alpha may be due to luck and not skill. To assess a manager’s ability to generate alpha, we can perform the following significance tests:
The standard error of the estimate of alpha in the security characteristic line (SCL) regression is given by:
$$ \hat { \sigma } \left( \alpha \right) =\cfrac { \hat { \sigma } \left( \text{e} \right) }{ \sqrt { \text{N} } } $$
Where:
\(N\) = Number of observations; and
\(\hat { \sigma } \left( \text{e} \right)\) = Sample estimate of nonsystematic risk.
Assume that a manager’s portfolio beta is 1.0, the standard deviation per month for the nonsystematic risk is 1%, the monthly market index standard deviation is 6.2%, and these parameters remain unchanged for 100 months.
Compute the standard error of \(\hat { \alpha } \).
$$ \begin{align*} \hat { \beta } &= 1.0 \\ \hat { \sigma } \left( \text{e} \right) &= 1\% \\ { \sigma }_{\text{M}}&=6.2\% \\ \text{N}&=100 \text{ months} \\ \hat { \sigma } \left( \alpha \right) &= \cfrac { \hat { \sigma } \left( \text{e} \right) }{ \sqrt { \text{N} } } = \cfrac {1\%}{10}=0.10\% \end{align*} $$
To ascertain that alpha represents the true skill, the t-statistic of the alpha estimate is evaluated. It aids in rejecting the null hypothesis that alpha equal to zero. If alpha is truly equal to zero, it implies that the investor does not have the superior ability.
The t-statistic for the estimate of \({ \alpha }\) is given by:
$$ \text{t}\left( \hat { \alpha } \right) =\cfrac { \hat { \alpha } }{ \hat { \sigma } \left( \alpha \right) } =\cfrac { \hat { \alpha } \sqrt { \text{N} } }{ \hat { \sigma } \left( \text{e} \right) } $$
A portfolio manager requires a significant level of 1% to reject the null hypothesis. Due to a large number of observations, this requires a t(\(\hat { \alpha } \)) value of at least 2.33.
With \(\hat { \alpha } \) = 0.4 and \({ \hat { \sigma } \left( \text{e} \right) } = 4\), calculate the number of observations.
$$ \text{t}\left( \hat { \alpha } \right) =\cfrac { \hat { \alpha } }{ \hat { \sigma } \left( \alpha \right) } =\cfrac { \hat { \alpha } \sqrt { \text{N} } }{ \hat { \sigma } \left( \text{e} \right) } \\ 2.33=\cfrac{0.4 \sqrt{ \text{N} }}{4} \\ \text{N} \approx 543 \text{ months} \approx 45 \text{ years} $$
The objective of investing in hedge funds is to diversify funds and maximize returns. However, to meet the aim of high returns, a higher cost of risk is incurred because hedge funds are invested in risky portfolios. There are several inherent issues in measuring the performance of hedge funds, as discussed below.
The return distribution of active strategies changes by design, as the portfolio manager, updates the changes in line with the current financial situation. The Sharpe ratio of actively managed portfolios is affected by changes in portfolio components, mean, and risk levels. However, it is not affected by investment in risk-free assets.
Suppose that the market index has a Sharpe ratio of 0.32.
|
Year |
Strategy |
Quarterly Returns (%) |
Mean Return (%) |
St. Dev. Return (%) |
Sharpe Ratio |
Conclusion |
|
1 |
Low risk |
-4, 8, -4, 8 |
2 |
6 |
\(\cfrac { 2 }{ 6 }=0.33\) |
Superior performance |
|
2 |
High risk |
-10, 20, -10, 20 |
5 |
15 |
\(\cfrac { 5 }{ 15 }=0.33\) |
Superior performance |
|
1 & 2 |
-4, 8, -4, 8, -10, 20, -10, 20 |
3.5 |
11.52 |
\(\cfrac { 3.5 }{ 11.52 }=0.31\) |
Inferior performance |
In conclusion, superior performance appears to dissipate once we analyze the low-risk and high-risk strategies together. This shows that it is important to consider changes in portfolio composition when using performance measures such as the Sharpe ratio.
Active management takes advantage of potential market inefficiencies, intending to maximize returns while minimizing risk. To achieve these objectives, the market timing strategy is employed.
Market timing involves shifting funds between a market-index portfolio and a safe asset. If the proportion between the risky asset and the risk-free asset is constant, the beta of the entire portfolio remains the same over time, as shown below:
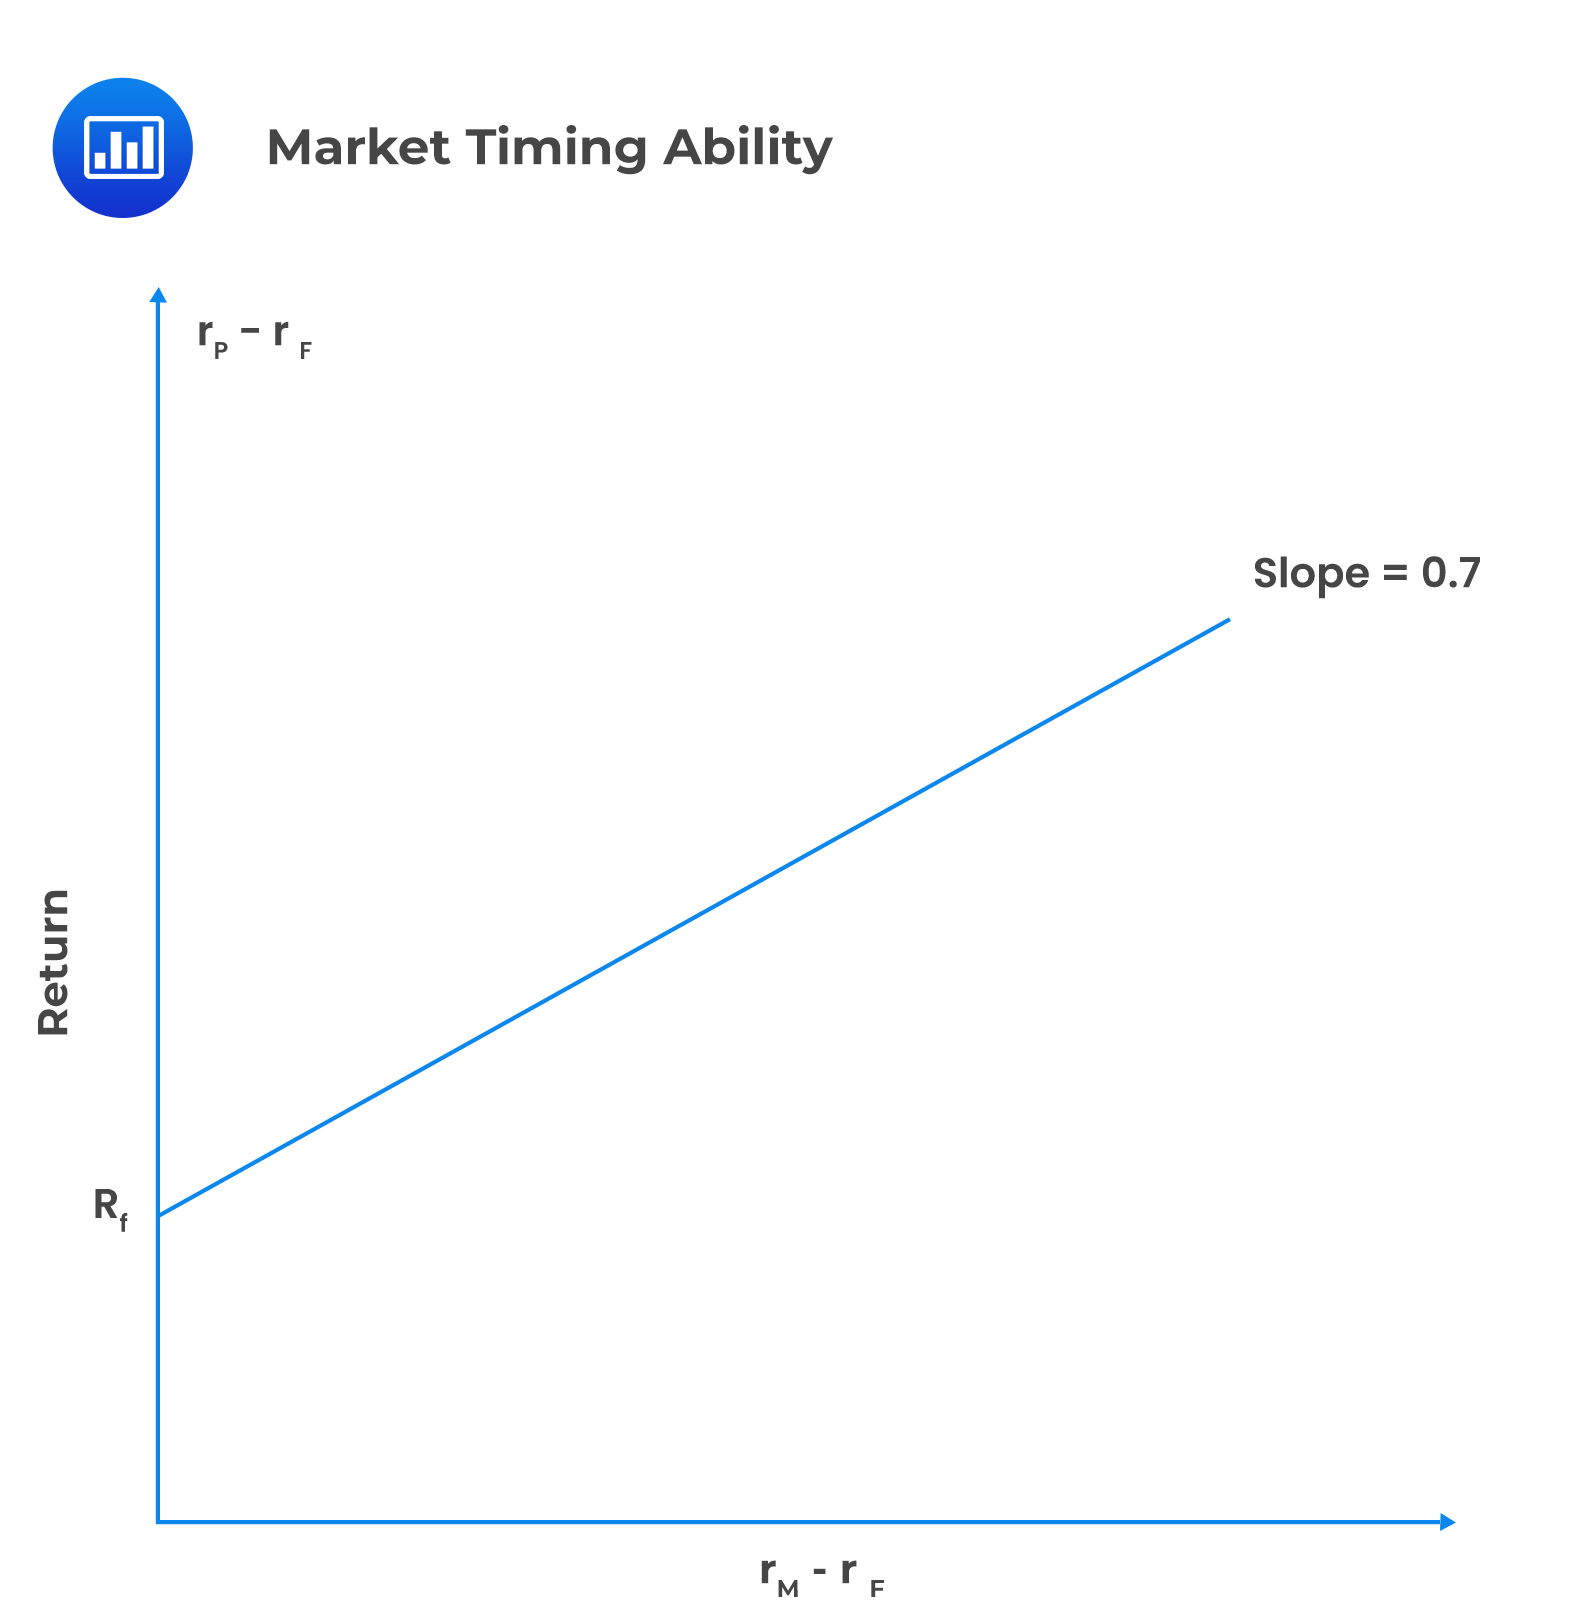 If the portfolio manager shifts funds from risk-free assets to risky assets due to the expected increase in market return, we will observe:
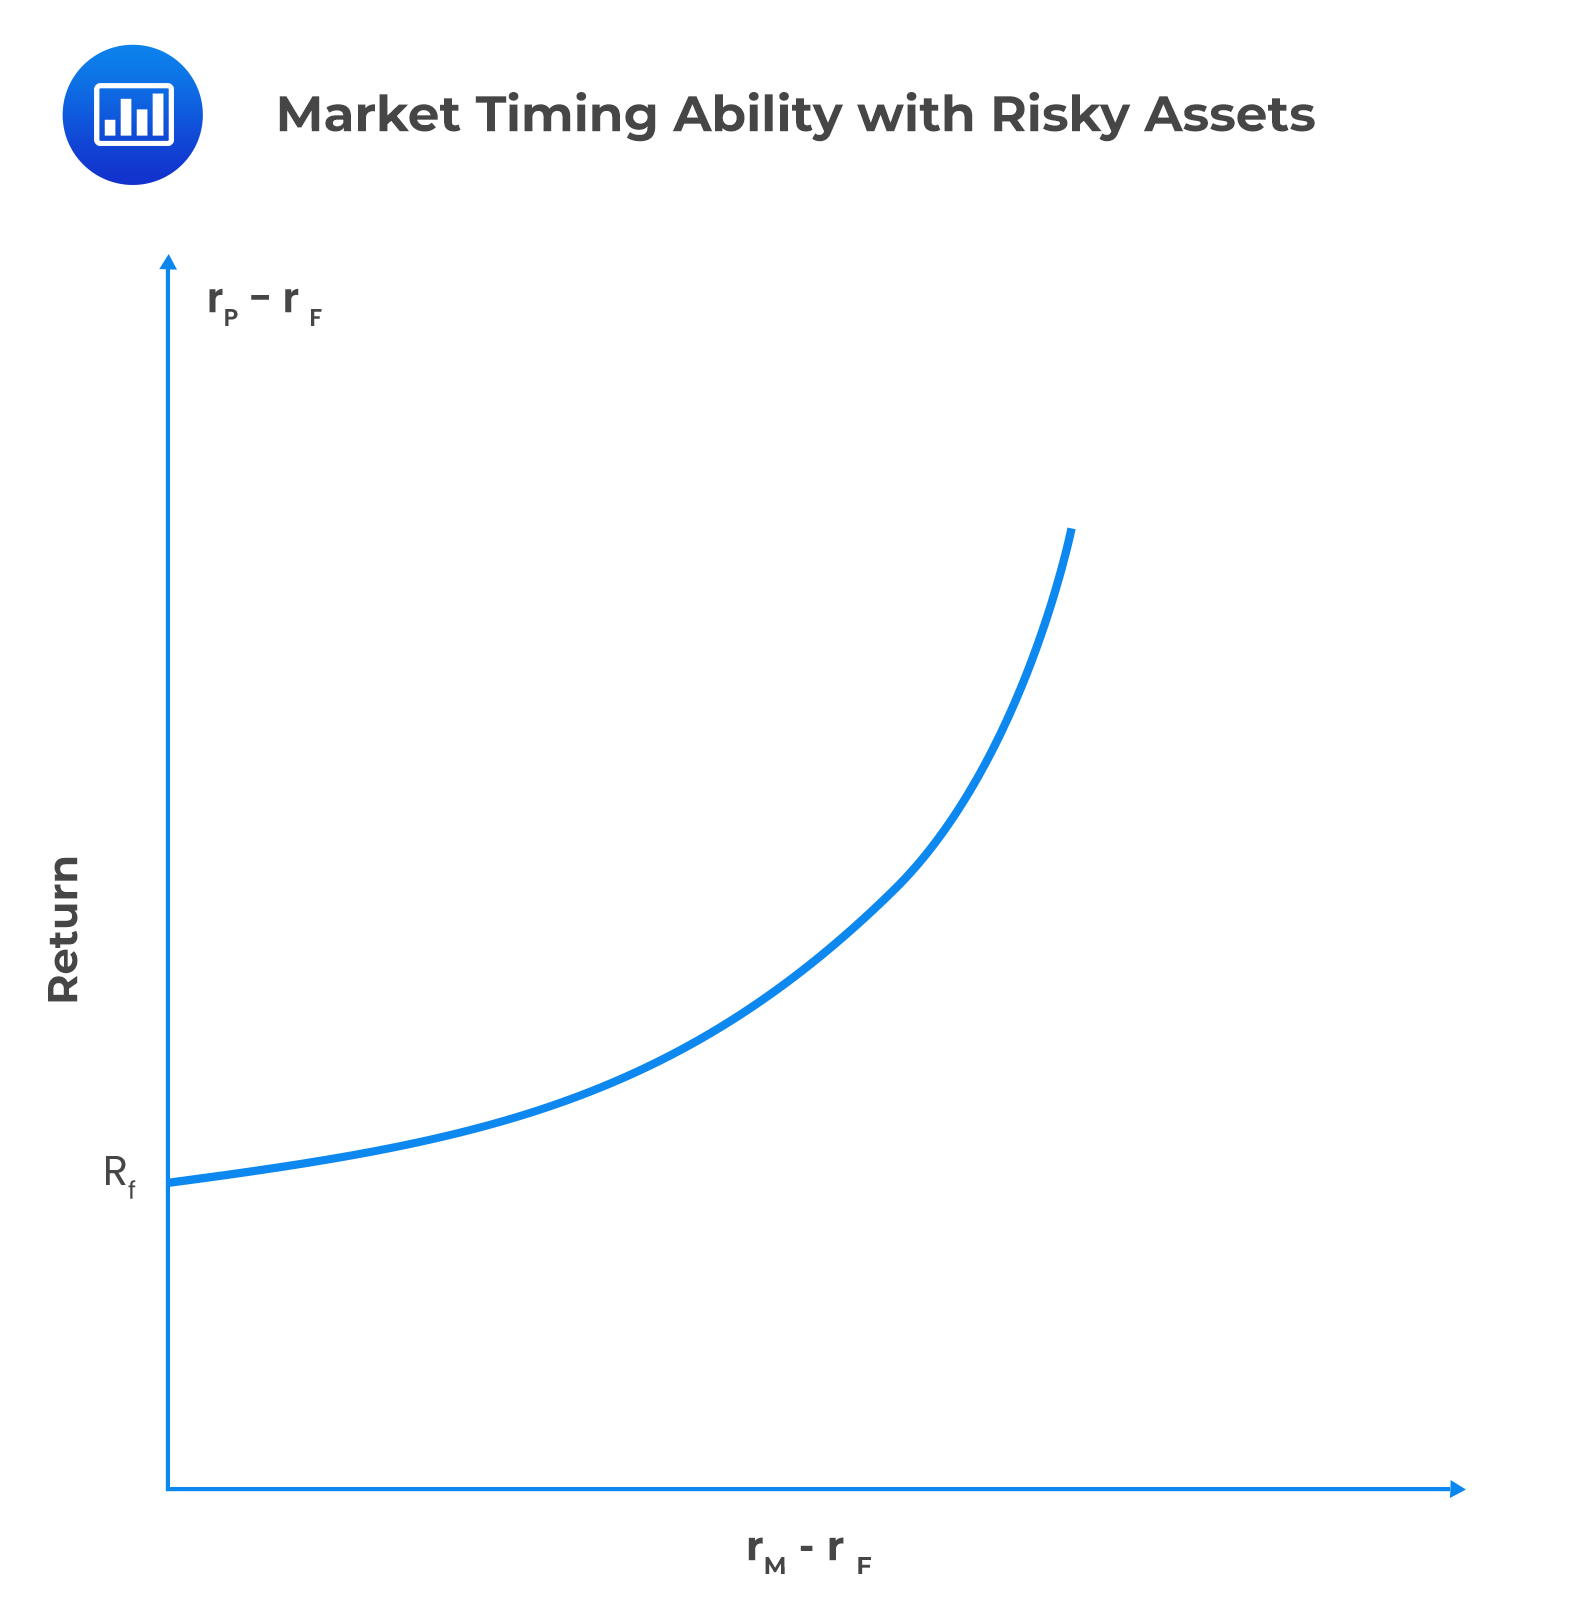 To capture the regime shift, we can employ the following methods:
Treynor and Mazuy proposed a quadratic regression analysis method to measure timing ability. It is given by:
$$ { \text{r} }_{ \text{p} }-{ \text{r} }_{ \text{f} }={ \text{A} }+{ \text{B} }\left({ \text{r} }_{ \text{M} }-{ \text{r} }_{ \text{f} } \right)+ \text{C}\left({ \text{r} }_{\text{M} }-{ \text{r} }_{ \text{f} } \right)^{2}+{ \text{e} }_{ \text{p} } $$
Where:
\({ \text{r} }_{ \text{p} }\) is the portfolio return;
\(A\), \(B\), and \(C\) are constants obtained from the regression analysis.
A positive \(C\) indicates the presence of timing ability.
Empirical evidence of mutual fund return data found little evidence of timing ability. As a result, a similar method (Henriksson and Merton) stating that the beta of a portfolio takes only two values was proposed. The regression equation for this approach is given by:
$$ { \text{r} }_{ \text{p} }-{ \text{r} }_{ \text{f} }={ \text{A} }+{ \text{B} }\left({ \text{r} }_{ \text{M} }-{ \text{r} }_{ \text{f} } \right)+ \text{C}\left({ \text{r} }_{\text{M} }-{ \text{r} }_{ \text{f} } \right) \text{D}+{ \text{e} }_{ \text{p} } $$
Where:
\(A\) = Alpha estimate;
\(B\) = Beta estimate;
\(C\) = Timing coefficient;
\(D\) = Dummy variable, which is either one or zero, when \({ \text{r} }_{\text{M} }>{ \text{r} }_{\text{f} }\) and \({ \text{r} }_{\text{M} }>{ \text{r} }_{\text{f} }\), respectively.
A positive \(C\) is evidence of market timing ability.
The beta of the portfolio is B for a bear market and B+C for a bull market.
A portfolio analyst with two portfolios, A and B, achieves the following results:
$$ \begin{array}{l|c|c|c|c} {} & \textbf{Portfolio A} & \textbf{Portfolio B} \\ \hline \textbf{Alpha estimate} & {1.54} & {-1.81} \\ \hline \textbf{Beta estimate} & {0.5} & {0.8} \\ \hline \textbf{Timing coefficient} & {0} & {0.08} \end{array} $$
For portfolio A, there is no evidence of an attempted timing because its coefficient of timing is zero. For B, there is evidence of successful timing, since its coefficient of timing is 0.08, and an unsuccessful stock selection, shown by the negative alpha estimate.
Perfect timing is the ability to be certain at the start of a period that a particular portfolio will outperform the preset strategy. To acknowledge that perfect foresight is equivalent to holding a call option, market timing ability is valued. The perfect timer invests 100% into a portfolio with higher returns.
Consider an option with a current market index of \({ \text{S} }_{ \text{t} }\) and a call option on the index whose exercise price is \(X= { \text{S} }_{ \text{T} } (1+{\text{r}}_{\text{f}}) \).
Suppose that the market outperforms bills over the succeeding period. \({ \text{S} }_{ \text{T} }\) will exceed \(X\) as expressed in the following equation:
$$ { \text{S} }_{ \text{T} }-\text{X}={ \text{S} }_{ \text{t} } (1+{\text{r}}_{\text{M}} )-{ \text{S} }_{ \text{t} } (1+{\text{r}}_{\text{F}}) $$
The final value of the T-bill is the exercise price of the perfect-timer call option on $1 of the equity portfolio. Using the Black-Scholes formula, the value of the call option is simplified to:
$$ \text{MV} \left( \text{perfect-timer-per } $ \text{ of assets} \right) ={ \text{C} }_{ \text{pt} }=2\text{N} \left( \cfrac { 1 }{ 2 } { \sigma }_{ \text{M} }\sqrt { \text{T} } \right) -1 $$
However, there are instances when the measure of market predictions is not perfect, i.e., (\({ \text{r} }_{\text{M} }<{ \text{r} }_{\text{f} }\)) and (\({ \text{r} }_{\text{M} }>{ \text{r} }_{\text{f} }\)) respectively. The correct forecast for the proportion of a bull and bear market need to be examined. Suppose we take \({ \text{p} }_{1} \) and \({ \text{p} }_{2} \) as the proportions of the correct forecasts of bull and bear markets respectively, then \({ \text{p} }_{1} \)+\({ \text{p} }_{2} -1\) will be the correct timing.
A perfect prediction implies that \({ \text{p} }_{1} \)=\({ \text{p} }_{2} \)=1. In a case where all the concentration is on the bull market, \({ \text{p} }_{2} \)=0, and \({ \text{p} }_{1} \)=1, giving a timing ability of zero (\({ \text{p} }_{1} \)+\({ \text{p} }_{2} \)-1).
Therefore, we can simplify the value of an imperfect timer as:
$$ \begin{align*} \text{MV}\left( \text{Imperfect timer} \right)&={ \text{C} }_{ \text{ipt} }=({ \text{p} }_{1}+{ \text{p} }_{2}-1)\times { \text{C} }_{ \text{pt} } \\ &=({ \text{p} }_{1}+{ \text{p} }_{2}-1)\left( 2\text{N} \left( \cfrac { 1 }{ 2 } { \sigma }_{ \text{M} }\sqrt { \text{T} } \right) -1 \right) \end{align*} $$
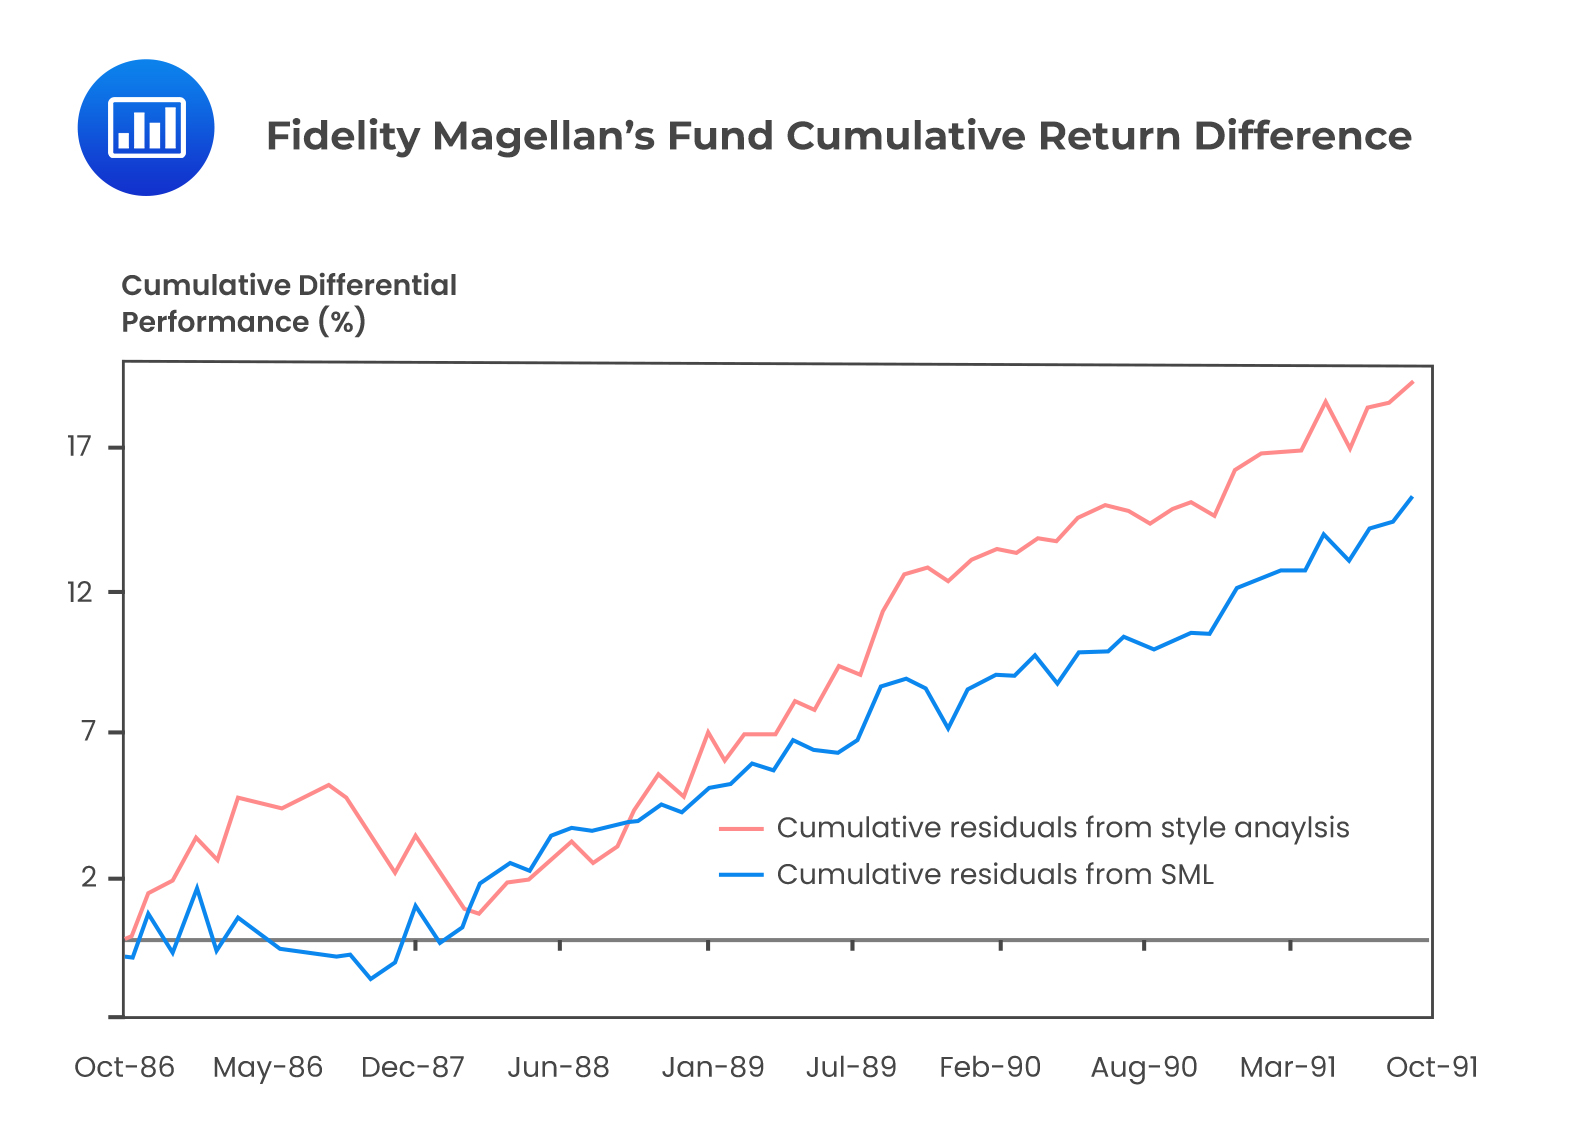
Style analysis was introduced by William Sharpe, who regressed fund returns on indexes representing a range of asset classes. The resultant coefficient of regression on every index measures the implicit allocation of the fund to that style.
The regression coefficients are either equal or greater than zero and must add up to 1. The percentage of return variability attributable to style choice is given by the regression’s \({ \text{R} }^{2}\), whereas, the average return from security selection of the fund portfolio is given by the intercept (residual variability).
William Sharpe analyzed the returns on Fidelity Magellan’s Fund, where the \({ \text{R} }^{2}\) was 97.5% of the returns that were attributed to style, and the residual 2.5% variability was assigned to security selection and market timing.
Therefore, style analysis can be used for performance measurement based on the security market line (SML) of the capital asset pricing model (CAPM).
The following diagram shows Fidelity Magellan’s Fund Cumulative Return Difference
 Performance Attribution Procedures
A common attribution system divides performance into three components:
Superior performance is attained by overweighting assets in markets that perform well or underweighting assets in poorly performing markets. The following outlines the performance attribution procedure:
$$ { \text{r} }_{ \text{B} }=\sum _{ \text{i}=1 }^{ \text{n} }{ { \text{w} }_{ { \text{B} }_{ \text{i} } } } { \text{r} }_{ { \text{B} }_{ \text{i} } } $$
Where:
\(i\) is the asset class;
\({ { \text{w} }_{ { \text{B} }_{ \text{i} } } }\) is the weight of the benchmark in i; and
\({ { \text{r} }_{ { \text{B} }_{ \text{i} } } }\) is the benchmark portfolio return of i.
$$ { \text{r} }_{ \text{p} }=\sum _{ \text{i}=1 }^{ \text{n} }{ { \text{w} }_{ { \text{p} }_{ \text{i} } } } { \text{r} }_{ { \text{p} }_{ \text{i} } } $$
Where:
\(i\) = Asset class;
\({ { \text{w} }_{ { \text{p} }_{ \text{i} } } }\) = Weight in each asset class;
\({ { \text{r} }_{ { \text{p} }_{ \text{i} } } }\) = Return of each asset class.
Thus, from attribution analysis,
$$ { \text{r} }_{ \text{p} }-{ \text{r} }_{ \text{B} }=\sum _{ \text{i}=1 }^{ \text{n} }{ { \text{w} }_{ { \text{p} }_{ \text{i} } } } { \text{r} }_{ { \text{p} }_{ \text{i} } }-\sum _{ \text{i}=1 }^{ \text{n} }{ { \text{w} }_{ { \text{B} }_{ \text{i} } } } { \text{r} }_{ { \text{B} }_{ \text{i} } }=\sum _{ \text{i}=1 }^{ \text{n} }\left({ { \text{w} }_{ { \text{p} }_{ \text{i} } } } { \text{r} }_{ { \text{p} }_{ \text{i} } }-{ { \text{w} }_{ { \text{B} }_{ \text{i} } } } { \text{r} }_{ { \text{B} }_{ \text{i} } } \right) $$
Where \(p\) is the managed portfolio, and \(B\) is the bogey portfolio.
The summation consists of the components obtained after decomposing the overall performance. Thus, the total contribution for each asset class is given by:
$$ \text{w}_{ { \text{p} }_{ \text{i} } }\text{r}_{ { \text{p} }_{ \text{i} } }-{ \text{w} }_{ { \text{B} }_{ \text{i} } }{ \text{r} }_{ { \text{B} }_{ \text{i} } }=\left(\text{w}_{ { \text{p} }_{ \text{i} } }-\text{w}_{ { \text{B} }_{ \text{i} } } \right) { \text{r} }_{ { \text{B} }_{ \text{i} } }+\text{w}_{ { \text{p} }_{ \text{i} } }\left( { \text{r} }_{ { \text{p} }_{ \text{i} } }-{ \text{r} }_{ { \text{B} }_{ \text{i} } } \right) $$
To achieve a superior performance relative to the bogey, the investments that perform well are over-weighted, while the poor performers are under-weighted.
The contribution of asset allocation to performance is the sum of the individual asset contribution to performance, which is expressed as:
$$ { \text{r} }_{ \text{aa} }=\sum _{ \text{i}=1 }^{ \text{n} }\left ( { { \text{w} }_{ { \text{p} }_{ \text{i} } } }- { \text{w} }_{ { \text{B} }_{ \text{i} } } \right){ \text{r} }_{ { \text{B} }_{ \text{i} } } $$
Where:
\(i\) = Asset class;
\({ \text{r} }_{ \text{aa} }\) = Contribution of asset allocation;
(\( { { \text{w} }_{ { \text{p} }_{ \text{i} } } }- { \text{w} }_{ { \text{B} }_{ \text{i} } }\))= Active/excess weight; and
\({ \text{r} }_{ { \text{B} }_{ \text{i} } }\) = Return of the index.
Given the following information about different assets making up the market, we can determine the contribution of asset allocation decision to performance:
$$ \textbf{Asset Allocation Decisions} $$
$$ \begin{array}{l|c|c|c|c} \textbf{Market} & \textbf{Equity} & \textbf{Fixed Inc.} & \textbf{Cash} & \textbf{Total} \\ \hline \text{Portfolio weight} & {0.6} & {0.3} & {0.1} & {100.00\%} \\ \hline \text{Benchmark weight} & {0.5} & {0.3} & {0.2} & {100.00\%} \\ \hline \text{Return of the benchmark} & {6.00\%} & {4.00\%} & {1.50\%} & {11.50\%} \\ \hline \textbf{Excess weight} & \textbf{0.1} & \textbf{0} & \textbf{-0.1} & \textbf{0.00%} \\ \hline \textbf{Contribution} & \textbf{0.60%} & \textbf{0.00%} & \textbf{-0.15%} & \textbf{0.45%} \end{array} $$
Where:
Excess weight =\({ \text{w} }_{ { \text{p} }_{ \text{i} } }-{ \text{w} }_{ { \text{B} }_{ \text{i} } }\); and
The contribution of asset allocation is given by:
$$ { \text{r} }_{ \text{aa} }=\sum _{ \text{i}=1 }^{ \text{n} }\left ( { { \text{w} }_{ { \text{p} }_{ \text{i} } } }- { \text{w} }_{ { \text{B} }_{ \text{i} } } \right){ \text{r} }_{ { \text{B} }_{ \text{i} } } $$
Sector and security selection is performed after the asset allocation strategy has been formulated. It is the process of identifying individual sectors and securities within a particular portfolio’s asset class.
The contribution of selection to total performance is given by the sum of the individual asset class contributions. It is defined as,
$$ { \text{r} }_{ \text{ss} }=\sum _{ \text{i}=1 }^{ \text{n} }{ \text{w} }_{ { \text{p} }_{ \text{i} } } \left ( { { \text{r} }_{ { \text{p} }_{ \text{i} } } }- { \text{r} }_{ { \text{B} }_{ \text{i} } } \right) $$
Where:
\(i\) = Asset class;
\({ \text{r} }_{ \text{ss} }\) = Contribution of selection to performance;
(\({ { \text{r} }_{ { \text{p} }_{ \text{i} } } }- { \text{r} }_{ { \text{B} }_{ \text{i} } }\)) = Excess performance; and
\({ \text{w} }_{ { \text{p} }_{ \text{i} } }\) = Portfolio weight.
Given the following information about different assets making up the market, we can determine the contribution of the sector and security selection decisions to the overall performance:
$$ \textbf{Sector and Security Selection} $$
$$ \begin{array}{l|c|c|c} \textbf{Market} & \textbf{Equity} & \textbf{Fixed Income} & \textbf{Total} \\ \hline \text{Portfolio return} & {8.00\%} & {2.00\%} & {} \\ \hline \text{Benchmark Return} & {6.00\%} & {4.00\%} & {} \\ \hline \textbf{Excess return} & \textbf{2.00%} & \textbf{-2.00%} & {} \\ \hline \text{Portfolio weight} & {0.6} & {0.3} & {} \\ \hline \textbf{Contribution} & \textbf{1.20%} & \textbf{-0.60%} & \textbf{0.60%} \\ \end{array} $$
Where:
$$ \text{Excess return} =\left( { { \text{r} }_{ { \text{p} }_{ \text{i} } } }- { \text{r} }_{ { \text{B} }_{ \text{i} } } \right ) $$
And
$$ { \text{r} }_{ \text{ss} }=\sum _{ \text{i}=1 }^{ \text{n} }{ \text{w} }_{ { \text{p} }_{ \text{i} } } \left ( { { \text{r} }_{ { \text{p} }_{ \text{i} } } }- { \text{r} }_{ { \text{B} }_{ \text{i} } } \right) $$
Aggregate contribution involves the complete summation of the component contributions. The asset allocation, sector allocation, and security selection contributions are put together to generate the total excess return of a portfolio. It is given by,
$$ { \text{r} }_{ \text{aa} }+{ \text{r} }_{ \text{ss} }={ { \text{w} }_{ { \text{p} }_{ \text{i} } } } { { \text{r} }_{ { \text{p} }_{ \text{i} } } }-{ { \text{w} }_{ { \text{B} }_{ \text{i} } } } { { \text{r} }_{ { \text{B} }_{ \text{i} } } } $$
$$ \textbf{Aggregate Contribution} $$
$$ \begin{array}{|ll} \text{Asset Allocation} & {0.45\%} \\ \hline \text{Sector and Security Selection} & {0.60\%} \\ \hline \textbf{Total Excess return} & \textbf{1.05%} \end{array} $$
Practice Question
James Harrington is a retail investor. Assume that he is interested in a stock that pays an annual dividend of $10 selling for $135 at the present moment. He decides to first buy the stock, then collects the $10 dividend, and at the end of the year wishes to sell the stock in exchange for $150. However, instead of selling his share, Harrington wishes to purchase a second share when the first year elapses and hold each of the shares until the end of the second year and then sell each of the shares at $170.
Compute the geometric average/time-weighted return on the investment.
A. 19.26%
B. 24.07%
C. 38.52%
D. 48.15%
The correct answer is A.
$$ { r }_{ 1 }=\frac { 150+10-135 }{ 135 } =0.1852 $$
$$ { r }_{ 2 }=\frac { 170+10-150 }{ 150 } =0.2 $$
Then:
$$ { r }_{ G }={ \left( 1+{ r }_{ 1 }\times 1+{ r }_{ 2 } \right) }^{ \cfrac { 1 }{ 2 } }-1 $$
$$ { r }_{ G }={ \left( 1.1852\times 1.2 \right) }^{ \cfrac { 1 }{ 2 } }-1=19.26\% $$
Offered by AnalystPrep


Get Ahead on Your Study Prep This Cyber Monday! Save 35% on all CFA® and FRM® Unlimited Packages. Use code CYBERMONDAY at checkout. Offer ends Dec 1st.