Basel III: Finalizing Post-crisis Reforms

Basel III: Finalizing Post-crisis Reforms

After completing this reading, the candidate should be able to:

  • Explain the elements of the new standardized approach to measuring operational risk capital, including the business indicator, internal loss multiplier, and loss component, and calculate the operational risk capital requirement for a bank using this approach.
  • Compare the SMA to earlier methods of calculating operational risk capital, including the Advanced Measurement Approaches (AMA).
  • Describe general and specific criteria recommended by the Basel Committee for the identification, collection, and treatment of operational loss data.

What is Operational Risk?

Operational risk is defined as the risk of loss resulting from inadequate or failed internal processes, people, and systems or from external events. It includes events such as fraud, employee errors, criminal activity, and security breaches. However, this definition excludes reputational risk as well as strategic risk.

Following the announcement of Basel III reforms, operational risk should be measured using the standardized approach in internationally active banks. It is, indeed, noteworthy that supervisors still have the discretion to apply the standardized approach among non-internationally active lenders.

Components of the Standardized Approach for Measurement of Operational Risk

The minimum operational risk capital (ORC) for a bank is given by:

$$ ORC = BIC × ILM $$

Business Indicator Component (BIC)

The Business Indicator Component (BIC) is a product of the Business Indicator (BI) and a set of regulatory marginal coefficients \( { a }_{ i } \).

$$ \left( BIC \right) =\sum { \left( { a }_{ i }\times { BI }_{ i } \right)  } $$

The BI consists of select items from a bank’s financial statements that are representative of a bank’s operational risk exposure. In particular, the BI has 3 components:

  • The interest, leases, and dividends component (ILDC).
  • The services component (SC).
  • The financial component, FC.

Important: All the three components must be calculated as averages over 3 years.

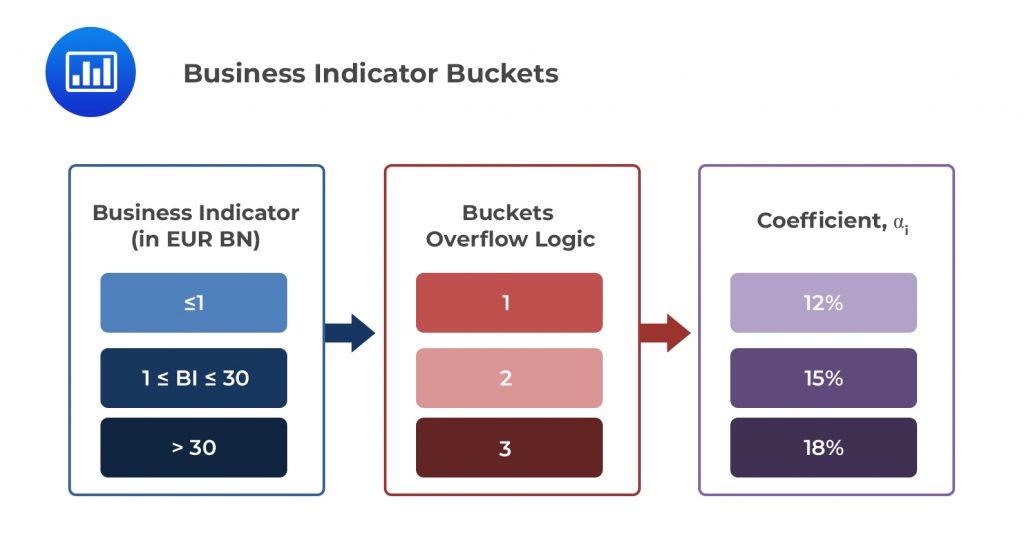
The BIs of large international banks are typically large figures running into billions of Euros – the chosen denomination for operational risk capital calculations. A bank’s BI tells a lot about its operational risk exposure. For this reason, the standardized approach divides banks into 3 buckets according to the size of their BI. Each bucket is associated with a regulatory-determined coefficient \( { a }_{ i } \). As the BI increases, so do the coefficients. A summary is set out in the table below:

Business Indicator BucketsExample 1: Calculating the BIC of a Bank With a BI of €40bn.

$$
\small{\begin{array}{l|c|c|c}
\textbf{BI Bucket}& \textbf{1} & \textbf{2}& \textbf{3} \\ \hline
\textbf{BI Range} & ≤ €1 \text{ billion} & €1 \text{ billion} < BI ≤ €30 \text{ billion} & ≥€30 \text{ billion} \\ \hline
\textbf{Marginal BI Coefficient, }  \bf{{ a }_{ i }} & 0.12 & 0.15 & 0.18 \\ \hline
\textbf{Calculation, }  \bf{{ a }_{ i }} & €1bn × 12\%
= €0.12bn & €(30 – 1) × 15\%
= €4.35bn & €(40 – 30) × 18\%
= €1.8bn \\
\end{array}
}$$

By summing the 3 buckets, we arrive at a BIC of €6.27 billion.

Example 2: Calculating the BIC of a Bank With a BI of €25bn.

$$
\small{\begin{array}{l|c|c|c}
\textbf{BI Bucket}& \textbf{1} & \textbf{2}& \textbf{3} \\ \hline
\textbf{BI Range} & ≤ €1 \text{ billion} & €1 \text{ billion} < BI ≤ €30 \text{ billion} & ≥€30 \text{ billion} \\ \hline
\textbf{Marginal BI Coefficient, }  \bf{{ a }_{ i }} & 0.12 & 0.15 & 0.18 \\ \hline
\textbf{Calculation, }  \bf{{ a }_{ i }} & €1bn × 12\%
= €0.12bn & €(25 – 1) × 15\% = €3.6bn & \\
\end{array}}
$$

By summing the 3 buckets, we arrive at a BIC of €3.72 billion.

Internal Loss Multiplier

The internal Loss Multiplier is defined as:

$$ ILM=\ln { \left[ exp\left( 1 \right) -1+{ \left( \frac { LC }{ BIC }  \right)  }^{ 0.8 } \right]  } $$

As can be seen from the equation above, the ILM (the Internal Loss Multiplier) is a function of the BIC and the Loss Component (LC), where the latter is equal to 15 times a bank’s average historical losses over the preceding 10 years. Firms with less than 10 years of data must use a minimum of 5 years of data while computing the average historical loss.

Important:

  • When LC = BIC, the ILM factor is equal to 1, and in effect, it becomes the default ILM level in certain circumstances.
  • When the LC is greater than the BIC, the ILM is greater than one.
  • When the LC is less than the BIC, the ILM is less than one.
  • For firms with BI levels less than €1bn, the ILM is set to 1, and therefore, internal loss data does not affect the capital calculation.
  • Under transitional arrangements, banks without 5-year historical data must set the ILM to 1, although the supervisor in charge maintains the discretion to set higher levels.

How is the Standardized Measurement Approach (SMA) Different from the Advanced Measurement Approach (AMA)?

The AMA, introduced in Basel II, allows for the estimation of regulatory capital to be based on a diverse range of internal modeling practices conditional on supervisory approval. The method has had a significant degree of flexibility, meaning that banks have been at liberty to use slightly different models while calculating the capital required. This flexibility has resulted in the AMA being replaced since it has resulted in widely incomparable internal modeling practices. This has exacerbated variability in risk-weighted asset calculations and eroded confidence in risk-weighted capital ratios. The SMA has limited flexibility and requires banks to follow precise guidelines in the entire capital calculation process.

General Criteria Recommended by the Basel Committee for the Identification, Collection, and Treatment of Operational Loss Data

To use the Loss Component (LC), banks have to observe certain guidelines:

  • A bank must have quality loss data spanning a 10-year period. Under transitional arrangements, banks are allowed to use a minimum of 5 years of loss data.
  • A bank must have documented procedures and processes for the identification, collection, and treatment of internal loss data.
  • A bank must be ready to map internal loss data onto the relevant Level 1 supervisory category as defined in Annex 9 of the Basel II Framework, on request (by the supervisor).
  • The data must capture all material events and exposures from all geographical locations and subsystems. Any loss event of €20,000 or more is considered material.
  • A bank must keep records of specific dates when operational risk events occurred or commenced.
  • Operational loss events related to credit risk and that are accounted for in credit risk RWAs should not be included in the loss data set.
  • For the purpose of calculating minimum regulatory capital under the SMA framework, operational risk losses related to market risk are treated as operational risks.
  • A bank must have an independent mechanism to validate and ensure the accuracy of the data.

Specific Criteria for Loss Data Identification, Collection, and Treatment

  • A bank must put policies that address various aspects of internal loss data in place. Among others, such aspects include collection dates, gross loss definition, and the grouping of losses.
  • Gross loss is a loss before recoveries of any type. Net loss is defined as the loss after taking the impact of recoveries into account.
  • Banks must be able to identify gross operational losses and recoveries for all operational risk events.
  • Items included in gross loss calculations:
    • Direct charges, including impairments and settlements.
    • External expenses linked to an operational risk event, e.g., legal expenses.
    • Provisions or reserves are accounted for in the P&L against the potential operational loss impact.
    • Material “timing losses” resulting from operational risk events impacting the cash flows or financial statements of previous financial accounting periods.
    • Temporary losses booked in suspense accounts but not recorded in P&L.
  • Items excluded from gross calculations:
    • General maintenance costs.
    • Internal or external business enhancement costs incurred following a risk event.
    • Insurance premiums

Practice Question

Calculate the BIC of a bank with a BI of €20bn.

A. €3.6 billion.

B.€2.4 billion.

C. €3 billion.

D. €2.97 billion.

Solution

The correct answer is D.

$$
\small{\begin{array}{l|c|c|c}
\textbf{BI Bucket}& \textbf{1} & \textbf{2}& \textbf{3} \\ \hline
\textbf{BI Range} & ≤ €1 \text{ billion} & €1 \text{ billion} < BI ≤ €30 \text{ billion} & ≥€30 \text{ billion} \\ \hline
\textbf{Marginal BI Coefficient, }  \bf{{ a }_{ i }} & 0.12 & 0.15 & 0.18 \\ \hline
\textbf{Calculation,  }  \bf{{ a }_{ i }} & €1bn × 12\%
= €0.12bn & €(20 – 1) × 15\% = €2.85bn & \\
\end{array}}
$$

By summing the 2 buckets, we arrive at a BIC of €2.97 billion.

Shop CFA® Exam Prep

Offered by AnalystPrep

Featured Shop FRM® Exam Prep Learn with Us

    Subscribe to our newsletter and keep up with the latest and greatest tips for success
    Shop Actuarial Exams Prep Shop Graduate Admission Exam Prep


    Daniel Glyn
    Daniel Glyn
    2021-03-24
    I have finished my FRM1 thanks to AnalystPrep. And now using AnalystPrep for my FRM2 preparation. Professor Forjan is brilliant. He gives such good explanations and analogies. And more than anything makes learning fun. A big thank you to Analystprep and Professor Forjan. 5 stars all the way!
    michael walshe
    michael walshe
    2021-03-18
    Professor James' videos are excellent for understanding the underlying theories behind financial engineering / financial analysis. The AnalystPrep videos were better than any of the others that I searched through on YouTube for providing a clear explanation of some concepts, such as Portfolio theory, CAPM, and Arbitrage Pricing theory. Watching these cleared up many of the unclarities I had in my head. Highly recommended.
    Nyka Smith
    Nyka Smith
    2021-02-18
    Every concept is very well explained by Nilay Arun. kudos to you man!
    Badr Moubile
    Badr Moubile
    2021-02-13
    Very helpfull!
    Agustin Olcese
    Agustin Olcese
    2021-01-27
    Excellent explantions, very clear!
    Jaak Jay
    Jaak Jay
    2021-01-14
    Awesome content, kudos to Prof.James Frojan
    sindhushree reddy
    sindhushree reddy
    2021-01-07
    Crisp and short ppt of Frm chapters and great explanation with examples.