Striving for Operational Resilience
After completing this reading, you should be able to: Describe elements of an... Read More
After completing this reading, you should be able to:
LTP is a process that ascribes the costs, benefits, and risks of liquidity to relevant business sections within a bank. Liquidity was taken for granted before the global financial crisis of 2007-2008. Banks assumed the availability of funds at extremely low or no cost. The implication of this is that banks lacked strong liquidity practices, and leaned heavily on financing long-term assets with short-term liabilities refinancing to ensure that they made profits.
After the global financial crisis, liquidity management has become a ‘hot topic’ for both financial institutions and regulators. Currently, liquidity can only be obtained at a cost, and there are fewer lenders of last resort.
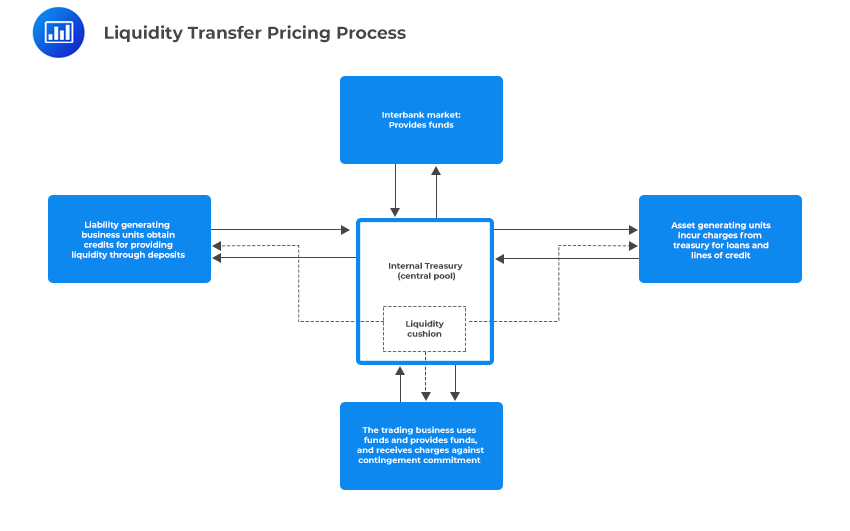
To successfully transfer liquidity costs and benefits from business units to a pool managed centrally, LTP charges users of loans/assets for the cost of liquidity, and credits providers of funds (liabilities/deposits) for the benefit of liquidity. Additionally, it replenishes the cost of carrying a liquidity cushion by charging contingent commitments, such as lines of credit, based on their expected use of liquidity.
The following chart demonstrates the liquidity transfer pricing process:
 Best Practices for the Governance and Implementation of an LTP Process
Good LTP practices call for banks to produce and stick to an LTP policy that defines the purpose of LTP and provides principles to ensure that LTP achieves its intended purpose. Banks with good LTP processes accrue less illiquid and interrelated assets, utilize more stable sources of funding to meet the business demands as well as carry a more sufficiently sized liquidity cushion to withstand unexpected market-wide disruptions.
On the other hand, poor LTP practices in banks lead to underpricing or, in worse case scenarios, failure to price liquidity. Thus, they accrue contingent exposure and illiquid assets, as well as undervalued sources of funding. Most financial institutions and many banks absorbed the same outcome before the global financial crisis.
In December 2010, the Basel Committee initiated liquidity standards forming part of the Basel III regime. Notably, it introduced the liquidity coverage ratio and (LCR) and the net stable funding ratio (NSFR). These standards were aimed to increase banks’ short-term and long-term resilience. The LCR gauges the adequacy of high-quality assets within a bank to survive stressed liquidity conditions over 30 days. On the other hand, NSFR enables banks to adopt more stable sources of funding over the long-term. Additionally, the Basel Committee introduced monitoring tools to track the diversification of funding sources, encumbrances on assets, and to alter disclosure to supervisors.
Some of the best practices that Banks can adopt to implement LTP successfully include:
It is costly to maintain a cushion for unexpected liquidity flows. Most times, income earned on the cushion is lower than the costs of funding it. Several banks are increasingly considering the repo and securities lending business intending to generate additional income. However, managing the specific risks of these instruments, such as concentration risk or the risk of a substantial devaluation of the collateral in case of a default, involves new counterparty credit risk management capabilities.
Traditionally, the asset-liability committee (ALCO) was responsible for allocating balance sheets and liquidity limits. However, following the recent regulatory scrutiny, the chief risk officers are now more often engaged in the decision-making process.
Typically, banks gauge their liquidity buffer needs using simple scenarios. However, besides these indicators being rough and static, they may be inadequate for the dynamic pricing of liquidity in line with the business strategy and a specific bank’s liquidity profile. The indicator requires extra support from appropriate policies and procedures in effectively managing liquidity risk according to the institution’s liquidity risk appetite.
Very few banks used to share information about the composition of their funding sources, liquidity reserves, and stress testing results in their annual reports. However, the Enhanced Disclosure Task Force (EDTF) now requires banks to fulfill these disclosure requirements since 2012. To accomplish that, many banks had to make substantial investments.
Several major financial institutions have established stress testing and contingency plans. Moreover, the frequency of stress testing has also changed. These financial institutions require access to the right data as it is critical for carrying out meaningful stress tests. Banks should work on improving the link between stress testing and contingency planning to incorporate new stress test results in contingency plans.
Liquidity risk entails a large amount of data being put together within the entity and across the group. The IT infrastructure should support a consistent representation of the data. Moreover, there should be an alignment between external reporting and internal management needs. The IT system should be responsive to reflect updated liquidity risk numbers. Banks should avoid setting up an IT system that is parallel to the one already utilized for other reporting needs. This helps in preventing reconciliation efforts as well as improving its cost-efficiency.
Banks are facing increased management needs for monitoring decision-making indicators as well as regulatory requirements for disclosure. Therefore, banks now want consistency in the group liquidity reporting as well as the capability to cope with the entity-level or regional-level specific regulations and needs. This means that having a consistent data hub at the group or regional level is crucial. Banks can consider automating their reporting solutions to solve the increasing complexity in reporting and in covering various liquidity metrics and considering different asset classes and currencies.
Good liquidity transfer pricing (LTP) practices require banks to have sound liquidity risk policies and procedures in areas where regulations can play a vital role. In the past, financial crises may have been activated by market breakdowns and a lack of regulatory oversight.
In a broader view, all processes, policies, and practices need governing. Such governing is attained via combining internal control elements such as threat management and regulation, and external control elements such as competition and regulation. External environment factors affect overseeing equally across all businesses. Thus, the main difference trickles down to the governance applied to internal control factors.
Internal governance entails having group-wide aims met, and this is what differentiates most businesses. Thus, having robust internal control bears the achievements of an institution’s goals, while weak internal controls result in adverse selection and moral hazards. Therefore, most banks may have poor LTP practices due to weak internal controls
Lack of LTP policy is a poor practice, especially now with the knowledge of liquidity risk. Traditionally, banks depended on internal transfer pricing in their management of interest rate threat in the banking book and also in the evaluation and monitoring of product performance and business units, but with minimal changes for liquidity benefit, costs, and risks.
The Financial Stability Institute recently conducted a study that analyzed 38 large banks from nine countries. The study showed several challenges in the context of the allocation of liquidity costs and benefits. Some of the key conclusions of this study include:
It was also noted that the most striking example of poor practices was the failure of banks to account for the costs, benefits, and risks of liquidity in all or some aspects of their business activities. These banks looked at liquidity as being free and thus seeing zero liquidity risk. Therefore, this attributed zero charges to some assets for the cost of using funding liquidity and conversely attributed no credit to some liabilities for the benefit of providing funding liquidity.
Banks can either have a centralized funding center where wholesale funding restricted to a subsidiary treasury or a group or a decentralized funding center where specific business units raise funding from their sources to cover their own liquidity needs.
However, the survey established that banks that applied decentralized funding centers, especially the ones with sizeable key brokerage business schemes, were more vulnerable to poor LTP practices. For instance, some business units used external sources of funds and traded those funds to other business units
(or the treasury) at a higher rate, resulting in a risk-free profit for the business unit involved.
Internal arbitrage was not only caused by decentralized funding systems but also weak oversight and inefficient risk controls. The basis for arbitrage comes about when these factors prevent business units and the treasury to know the prices paid by other businesses for funding from external sources. More so, most banks that employed decentralized funding systems applied inconsistent LTP policies and counted on manual off-line methods to have their funding costs updated.
Most of the banks are aiming to improve their LTP practices. This is through establishing LTP policies that provide a clear outline of LTP’s purpose as well as some rules and principles to make sure that business units grasp the need for charges associated with the utilization of liquidity.
A move towards better LTP practice consists of the following:
Banks make money through daily funding from short-term deposits (liabilities) and long-term loans (assets) via a process referred to as maturity transformation. Thus, banks must use LTP to account for the benefits, costs, and risks or liquidity in new product approval processes, product pricing, and performance evaluation. This way, they should be more encouraged to engage in maturity transformation.
Practicing poor LTP policies leads to accrued vast amounts of long-term illiquid liabilities, thus enhancing susceptibility to shortfall funding.
The zero cost of funds approach ignores accounting for the benefits, costs, and risks of liquidity in entirely all or some of a bank’s business activities. In this case, banks regard funding liquidity as free while funding liquidity threat as virtually zero. In other words, there is no charge applied to some assets for the price of utilizing funding liquidity — additionally, there is no credit application on some liabilities for the benefit of providing funding liquidity.
When there is a zero charge on liquidity costs, zero credit on liquidity benefits aggravates maturity transformation to the highest degree. As such, this method leads to long-term, highly illiquid assets hoarding and less long-term steady liabilities to cater for financing needs as they became of due.
There were favorable funding conditions before the global financial crisis of 2007-2008; thus, some banks regarded liquidity as a free good while funding liquidity risk at zero. If banks assumed that funding would always be readily available and at a steadily inexpensive rate, it could have encouraged the essence of charging assets for liquidity costs as well as credit liabilities for liquidity benefit.
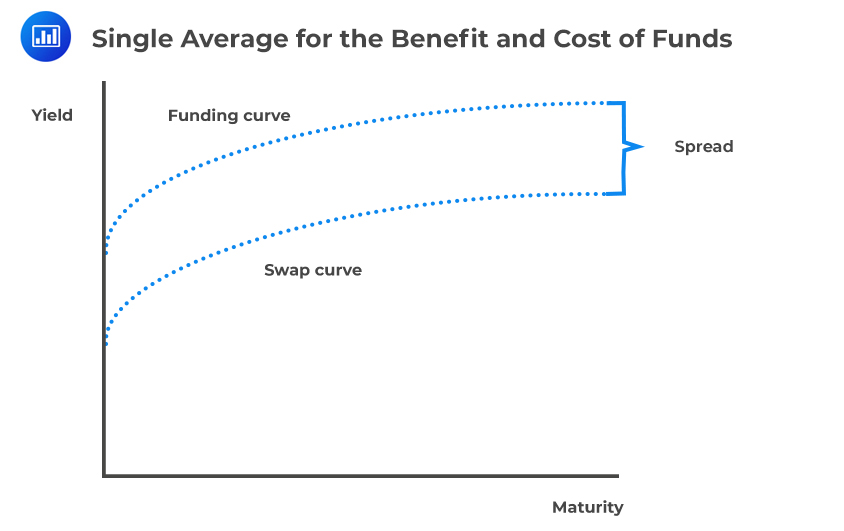
Some banks acknowledge the need to have users and credit providers charged for providing liquidity funding and thus came up with a pooled method to LTP. In this method, the average rate is derived based on the interest expense, i.e., the funds’ cost in all the existing funding sources.
Relative to the zero-cost funds’ approach, this approach is better. However, since only one average funding rate is applied, all assets get charged on the rate of usage of liquidity cost (funds) with no consideration of their varying maturity.
Suppose that the average rate across all funding sources is 20 bps, all loans would receive a charge of $4,000 on a principal amount of $2 million, irrespective of their maturity. Assuming this rate was also used to reward fund providers, then all deposits would receive a credit of $4,000 on a principal amount of $2 million, irrespective of their maturity.
$$ \begin{array}{l|c|c|c|c|c} \textbf{Term in years} & \textbf {1} & \textbf {2} & \textbf {3} & \textbf {4} & \textbf {5} \\ \hline {\text {Loan/deposit} \\ \text{principal}} & {$2 \text{ million}} & {$2 \text{ million}} & {$2 \text{ million}} & {$2 \text{ million}} & {$2 \text{ million}} \\ \hline {\text {Average cost of} \\ \text{funds (bps)}} & {20\text{ bps}} & {20\text{ bps}} & {20\text{ bps}} & {20\text{ bps}} & {20\text{ bps}} \\ \hline {\text {Charge for use} \\ \text{of funds}} & {$4,000} & {$4,000} & {$4,000} & {$4,000} & {$4,000} \\ \hline {\text {Credit for benefit} \\ \text{of funds}} & {$4,000} & {$4,000} & {$4,000} & {$4,000} & {$4,000} \\ \end{array} $$
The average cost of funds approach has two problems. These include:
The following is a graphical illustration of a single average for the benefit and cost of funds:
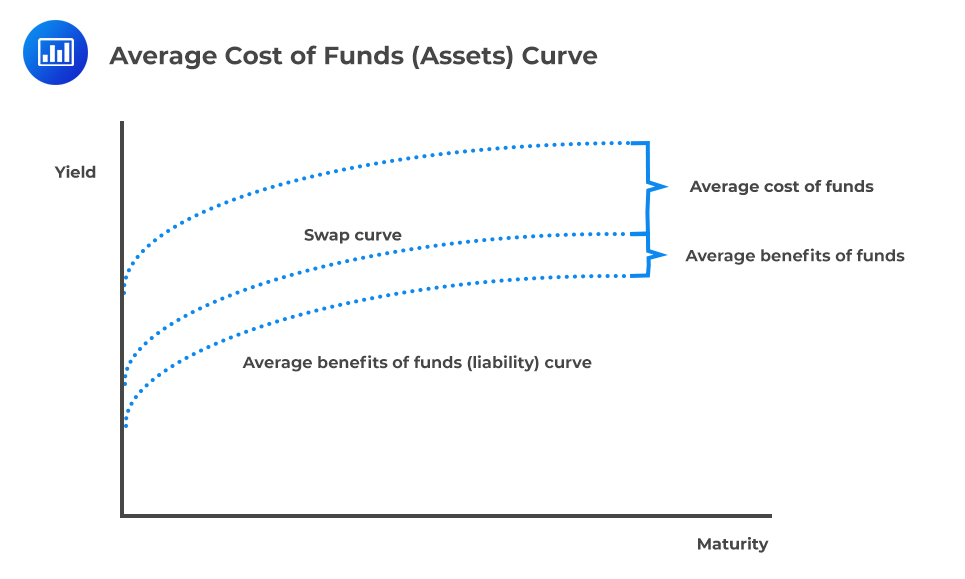
 A better approach to the above applies a separate ‘average’ rates for the costs and benefits.
Suppose that the average cost of funds is 20 bps, as in the example presented above, all loans would be charged $4,000 on a principal of $2 million, irrespective of their maturity. Further, if the average benefit of funds is 10 bps, all deposits would be credited $2,000 on a principal of $2 million, irrespective of their maturity. We can, therefore, deduce that lowering the average cost of funds from 20 bps to 10 bps encourages loan generation. However, since we have a separate rate for the average benefit of funds, this variation will not directly discourage business units from raising deposits.
The following is a graphical representation of the same:
 Indications of the Average Cost of Funds Approach
The average cost of funds approaches champions for maturity transformation. In other words, it promotes both healthy and unhealthy maturity transformation. Business units are overly encouraged to write long-term assets since, over a more extended period, as they are not charged heavily for their use of funds over a longer-term. On the other hand, they become more discouraged to engage in long-term liabilities since there is no premium ascribed to liabilities providing funding for a more extended period.
Additionally, information asymmetries and remuneration factors effortlessly motivate long-term asset generation; however, in the average costs of funds method, the motivation is aggravated.
This approach distorts profit assessment as it leads to the mispricing of and the accrual of assets on severely distorted risk-adjusted conditions.
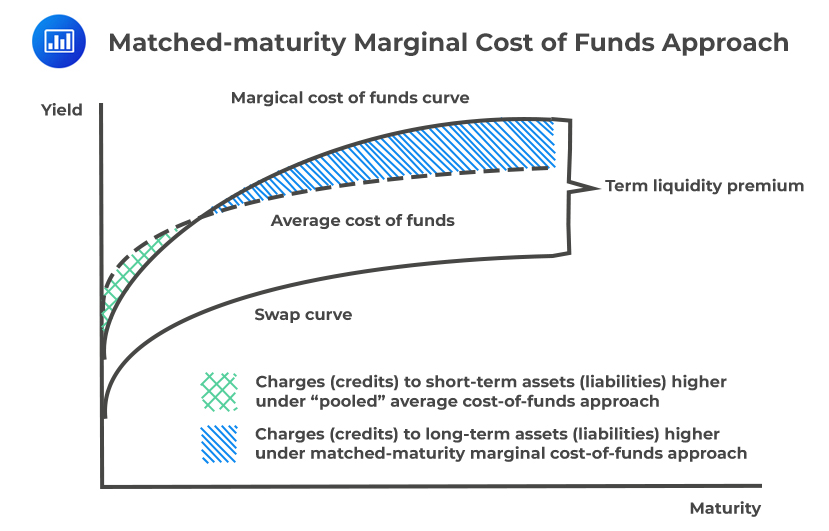
The matched-Maturity marginal cost of funds approach is currently the best practice for liabilities and assets on the balance sheet, which is based on the concept that the treasury, serves as a conduit for all of the institution’s funds using current market marginal funds costs. In this approach, individual business units trade their liabilities at reasonable transfer prices to the treasury. Furthermore, each business unit buys the funds required to support its assets at appropriate transfer prices from the treasury.
As such, each business unit is handled as a wholly/entirely matched book where assets get a transfer price charge that depicts their maturity. On the other hand, liquidity features such as maturity, cash flows, origination date, and repricing get transfer prices on credits that show the market worth of funds with similar characteristics.
One of the significant advantages of this approach is that each element of the net interest margin can be measured independently;
The following is a graphical representation of the matched-maturity marginal cost of funds approach to LTP and its components:
 Determining the Rates for Users and Providers of Funds
The rates charged for the use of funds and credited for the benefits of the fund are based on the term liquidity premiums. This should be in line with the maturity of the transaction. However, for indeterminate-maturity or amortizing products, the rates for providers and users of funds is determined by the blended term of liquidity premiums consisting of their estimated or known cash-flow profiles.
Non-amortizing bullet loans are those loans that do not provide repayments throughout their term. Thus, because the interest and principle get repaid at maturity, it is necessary to have a funding commitment throughout the duration of the loan.
For an illustration of the matched maturity marginal cost approach, assume the following term liquidity premiums and the average cost of funds were recorded by a bank at a point before the crisis (pre-GFC), and more recently.
$$ \textbf{Pre-GFC and Current Term Liquidity Premiums and Average Cost of Funds} $$
$$ \begin{array}{l|c|c|c|c|c} {\text {Term in years}} & {1} & {2} & {3} & {4} & {5} \\ \hline {\textbf{Pre-Global Financial Crisis}} & {} & {} & {} & {} & {} \\ \hline {\text {Term liquidity premium}} & {1} & {2} & {4} & {8} & {10} \\ \hline {\text {Average cost of funds}} & {3} & {3} & {3} & {3} & {3} \\ \hline {\text {Difference}} & {-2} & {-1} & {1} & {5} & {7} \\ \hline {\textbf{Current (post-crisis)}} & {} & {} & {} & {} & {} \\ \hline {\text {Term liquidity premium}} & {6} & {8} & {12} & {18} & {30} \\ \hline {\text {Average cost of funds}} & {10} & {10} & {10} & {10} & {10} \\ \hline {\text {Difference}} & {-4} & {-2} & {2} & {8} & {20} \\ \end{array} $$
A one-year non-amortizing bullet loan should have received a charge of 1 bp if originated pre-crisis, and six bps if arisen more recently. Assume that the principal of the loan was $2 million. This should have translated to charges of $200 and $1,200, respectively, to the business unit(s) writing the loans.
Contrary to the non-amortizing bullet loans, amortizing loans provide cash flows (repayments) in the entire life of the loan. Because a proportion of the interest and principal is paid before its maturity, no funding commitment is necessary throughout the term of the loan. This is because the loans become self-funding at some level in between the start and maturity of the loan.
Consider a five-year linearly amortizing bullet loan with a principal amount of $2 million. You can think of this as five separate annual loans, each of $400,000, using a matched-maturity marginal cost of funds approach. Let’s use the same table as in the previous example.
$$ \textbf{Pre-GFC and Current Term Liquidity Premiums and Average Cost of Funds} $$
$$ \begin{array}{l|c|c|c|c|c} {\text {Term in years}} & {1} & {2} & {3} & {4} & {5} \\ \hline {\textbf {Pre-Global Financial Crisis}} & {} & {} & {} & {} & {} \\ \hline {\text {Term liquidity premium}} & {1} & {2} & {4} & {8} & {10} \\ \hline {\text {Average cost of funds}} & {3} & {3} & {3} & {3} & {3} \\ \hline {\text {Difference}} & {-2} & {-1} & {1} & {5} & {7} \\ \hline {\textbf{Current (post-crisis)}} & {} & {} & {} & {} & {} \\ \hline {\text {Term liquidity premium}} & {6} & {8} & {12} & {18} & {30} \\ \hline {\text {Average cost of funds}} & {10} & {10} & {10} & {10} & {10} \\ \hline {\text {Difference}} & {-4} & {-2} & {2} & {8} & {20} \\ \end{array} $$
Now calculate the charge that the loan should have received, assuming it was originated pre-crisis.
$$ \text { Charge received pre-crisis}=\cfrac { 1\left( 1 \right) +2\left( 2 \right) +3\left( 4 \right) +4\left( 8 \right) +5\left( 10 \right) }{ 1+2+3+4+5 } =6.6 \text { bps} $$
This is a blended (tenor-weighted) term liquidity premium, which is derived from the tranching approach.
Using the same method, if the loans were generated in recent times, the charge it should have received is equivalent to:
$$ \text { Charge received post-crisis}=\cfrac { 1\left( 6 \right) +2\left( 8 \right) +3\left( 12 \right) +4\left( 18 \right) +5\left( 30 \right) }{ 1+2+3+4+5 } =18.7 \text { bps} $$
Although the matched-maturity marginal cost of funds approach is more complex relative to the average cost of funds approach, it promotes a better LTP practice. Moreover, it recognizes that the costs and benefits of liquidity are related to the maturities of assets and liabilities, and therefore allow higher rates to be assigned to products that use or provide liquidity for more extended periods.
Calculating the charge for utilizing liquidity and the credit for providing liquidity for most on-balance sheet items is relatively simple. However, this differs for contingent commitments such as lines of credit and other financial contracts. The best method is to impose a situation model, establish a reasonably low likelihood of worst-scenario results, and charge transaction, business units, or products at the most granular point for the expense of covering this outcome.
Mostly, banks consider a liquidity cushion. This is a “buffer” of highly liquid assets to assist them in surviving times of unforeseen funding outflows. Unanticipated funding outflows include but are not limited to wholesale funding run-off, drawdowns on lines of credit, and secured lending runoff.
As mentioned in the earlier sections, in December 2010, the Basel Committee initiated liquidity standards forming part of the Basel III regime. Notably, it introduced the liquidity coverage ratio and (LCR) and the net stable funding ratio (NSFR). These standards were aimed to increase banks’ short-term and long-term resilience. The LCR gauges the adequacy of high-quality assets within a bank to survive stressed liquidity conditions over 30 days. On the other hand, NSFR enables banks to adopt more stable sources of funding over the long-term. The two standards aim to minimize the burden on central banks of having to act as the last resort lender and the likely effects of moral hazards as an outcome of these actions.
The 12th BCBS principle requires a bank to maintain a cushion of unencumbered, high-quality liquid assets to be held as insurance against a range of liquidity stress scenarios.
Usually, banks attribute the cost of carrying liquidity cushions through LTP. However, there are no actual links established between liquidity cushion and LTP in existing academic writing. Mainly these two are independently treated as two different principles used in liquidity risk management.
Liquidity risk costs are defined as transfer prices covering liquidity risks. These costs can be split into the cost of the liquidity cushion and the cost of the liquidity reserve. The following figure shows the cost components of liquidity transfer pricing:
The cost of the liquidity cushion refers to the cost of providing a liquidity cushion for unanticipated cash flows obtained from product models, which are based on individual parameters. Repo deals and asset sell-offs are examples of these liquidity cushions which cover unexpected cash flows of products. The causation principle allocates liquidity cushion costs to specific balance sheet items.
Typically, carrying a ‘buffer’ of extremely high liquid assets is expensive for banks since the costs of assets funds consisting of the cushion generally outweigh the outcome they generate. Thus, most banks usually aim to reduce their liquidity cushion’s capacity so that it does not have a negative implication of dragging their profits.
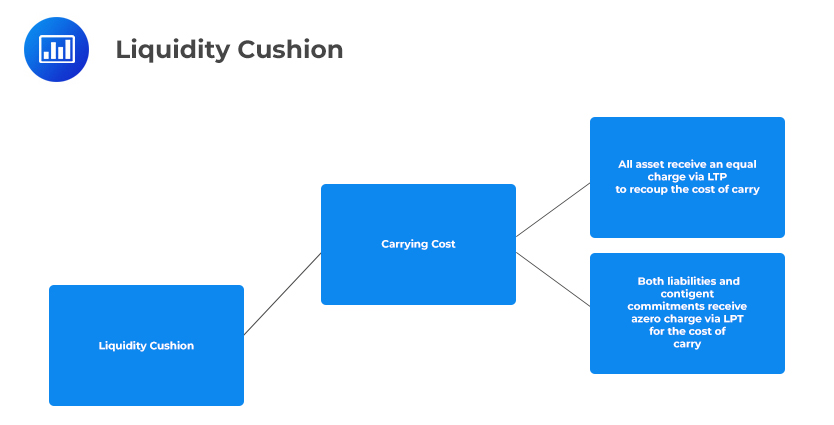
Most banks consider the cost of carrying additional liquidity costs as a business cost instead of as an opportunity cost. As such, the treasury (central management) should not incur the cost of carrying. Instead, it should be brought back into the business through the LTP process.
The following figure is an illustration of the liquidity cushion:
 $$ \text { FTP=Base Rate + Term Liquidity Premium + Liquidity Premium} $$
Where:
\(\text {FTP}\) is the fund transfer price;
\(\text {Base Rate}\) is the rate resulting from the swap curve relative to the asset’s contractual/ behavioral maturity or repricing term, whichever is less;
\(\text {Term Liquidity Premium}\) is the spread between the swap curve and the bank’s marginal cost of funds curve as per the contractual/ behavioral asset’s maturity; and
\(\text {Liquidity Premium}\) is the cost of carrying liquidity cushion averaged over the total assets of the bank.
The above equation implies that cushioning assets on short-term funding reduces the negative cost of carrying, making it much easier for banks to recoup through the addition of liquidity premium to the cost of financing charged to assets.
Banks are enhancing the way they manage contingent liquidity risk. Here are some of the strategies they have adopted:
All banks should be charging contingent commitments based on their likelihood of drawdown. The rate charged for contingent liquidity risk should be derived as follow:
$$ \text {Rate charged} =\frac{(\text {Limit}−\text {Drawn amount})}{\text {Limit}}×\text {Likelihood of drawdown}×\text {Cost of funding liquidity cushion} $$
All banks should charge contingent commitments based on their likelihood of drawdown at the extreme basic level of what is considered to be a better practice. For example, suppose a line of credit with a limit of $50 million has $5 million already drawn. Further, assume there is a 70% chance the customer will draw on the remaining credit and that the cost of term funding assets in the liquidity cushion is 20 bps The rate charged for contingent liquidity risk should be calculated as follows:
$$ \text {Rate charged}=\cfrac { $50-$5 }{ 50 } \times 0.7\times 0.0020=0.00126 $$
This is equivalent to 12.6 bps.
Practice Question
Calculate the monthly payment required to amortize a loan whose principal is $225,000 at an annual interest rate of 3.25% for a term of 30 years.
A. 739.23
B. 799.21
C. 979.21
D. 2700.21
The correct answer is C.
$$ \text R=\cfrac { \left( \text P\times {\text i} \right) }{ 1-\left( 1+{\text i} \right) } $$
Note:
A loan of P dollars at interest rate i per period may be amortized in an equal periodic payments of R dollars made at the end of each period.
Where:
$$ \text r=\cfrac { {\text i} }{\text m } $$
i is the interest rate per period
r is the interest rate on loan (periodic payment)
m is the number of compounding periods per year.
n = m \(\times\) t
t is the term of the loan
P= 225,000
r =3.25% (0.0325)
m = 12
But,
$$ {\text i}=\cfrac { 0.0325 }{ 12 } $$
$$ \text n = 12 \times 30=360 $$
Hence,
$$ \text {R}=\cfrac { 225,000\times \cfrac { 0.0325 }{ 12 } }{ 1-{ \left( 1+\cfrac { 0.0325 }{ 12 } \right) }^{ -360 } } = $979.21 $$
Get Ahead on Your Study Prep This Cyber Monday! Save 35% on all CFA® and FRM® Unlimited Packages. Use code CYBERMONDAY at checkout. Offer ends Dec 1st.