


Time Structure Models
Equilibrium Term Structure Models Equilibrium term structure models are built on theories about... Read More

Multiple regression allows us to evaluate the effect of two or more independent variables on a given dependent variable. Multiple regression with two explanatory variables and one intercept term can be represented in the following 3D diagram:
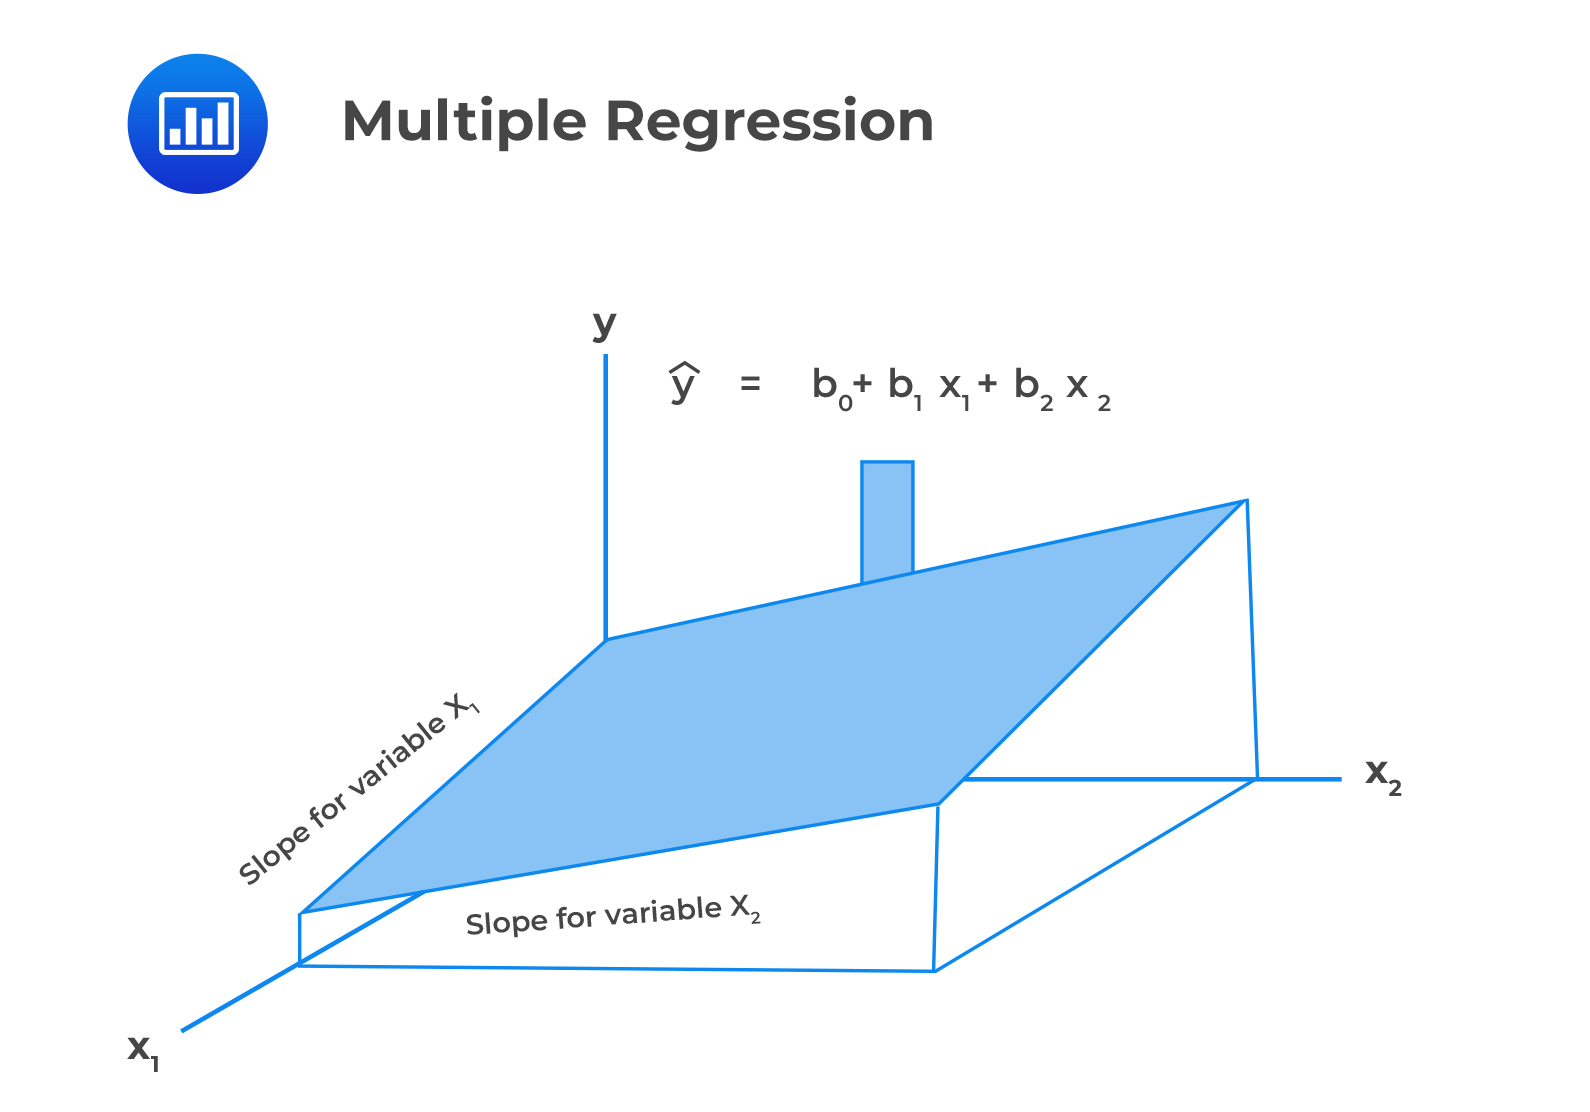 Mathematically, a multiple regression model wityh two or more explanatory variables takes the following form:
$$Y_{i}=b_{0}+b_{1}X_{1,i}+b_{2}X_{2,i}+…+b_{k}X_{k,i}+\epsilon_{i}$$
Where:
A regression equation has \(k\) slope coefficients and \(k+1\) regression coefficients.
The intercept term is defined as the value of the dependent variable when the independent variables are zero. On the other hand, the slope coefficient is defined as the estimated change in the dependent variable given a one-unit change in the value of the independent variable, keeping the other independent variables constant.
James Chase, an investment analyst, wants to determine the impact of inflation rates and real rates of interest on the price of the US Dollar index (USDX). Chase uses the multiple regression model below:
$$P=b_0+b_1INF+b_2IR+\epsilon_t$$
Where:
The regression of the price of USDX on inflation and real interest rates generates the following results:
$$\small{\begin{array}{l|c|c|c|c}{}& \textbf{Coefficients} & \textbf{Standard Error} & \textbf{t Stat} & \textbf{P-value}\\ \hline\text{Intercept} & 81 & 7.9659 & 10.1296 & 0.0000\\ \hline\text{Inflation rates} & -276 & 233.0748 & -1.1833 & 0.2753\\ \hline\text{Real interest Rates} & 902 & 279.6949 & 3.2266 & 0.0145\\ \end{array}}$$
The multiple regression equation can be expressed as:
$$P=81-276INF+902IR$$
The regression coefficient estimate of the inflation rate is negative. This indicates that an increase in the inflation rates causes a decrease in the price of the US Dollar index (USDX).
Furthermore, the positive real rate of interest coefficient implies that an increase in the real interest rate is accompanied by an increase in the price of USDX.
Additionally, the t-statistic indicates that only the real interest rate variable is significant at the 5% significance level.
Question
Adil Suleman, CFA, wishes to identify possible drivers of a company’s percentage return on capital (ROC). Suleman identifies performance measures, including the profit margin (%), sales, and debt ratio, as possible drivers of ROC.
He obtains the following results from the regression of ROC on profit margin (%), sales, and the debt ratio.
$$ \textbf{Exhibit 1: Summary Output} $$
$$\small{\begin{array}{l|c|c|c|c|c}{}& \textbf{Coefficients} & \textbf{Standard Error} & \textbf{t Stat} & \textbf{P-value} \\ \hline\text{Intercept} & 8.6531 & 0.9174 & 9.4323 & 0.0000 \\ \hline \text{Sales} & 0.0009 & 0.0005 & 1.7644 & 0.0922\\ \hline\text{Debt ratio} & 0.0229 & 0.0165 & 1.3880 & 0.1797 \\ \hline\text{Profit Margin%} & 0.2996 & 0.0564 & 5.3146 & 0.0000\\ \end{array}}$$
Use the notations S = Sales, DR=Debt ratio, and PM = Profit margin. The most appropriate expression of the multiple regression equation that can be used to test the effects of the changes in the values of sales, debt ratio, and profit margin (%) on ROC is:
A. ROC = 8.6531 + 0.0005S + 0.0165DR + 0.0564PM
B. ROC = 8.653 + 0.0009S + 0.0229DR + 0.2996PM
C. ROC = 0.9174 + 0.0005S + 0.0165DR + 0.0564PM
Solution
The correct answer is B.
A multiple regression model is expressed as:
$$Y_{i}=b_{0}+b_{1}X_{1,i}+b_{2}X_{2,i}+…+b_{k}X_{k,i}+\epsilon_{i}$$
Where:
- \(Y_i\) = Dependent variable.
- \(b_0\) = Intercept term.
- \(b_1, b_2,…,b_k\) = slope coefficients.
- \(X_{1,i}, X_{2,i}, …,X_{k,i}\) = Independent variables.
- \(\epsilon_{i}\) = Error term.
Reading 2: Multiple Regression
LOS 2 (a) Formulate a multiple regression equation to describe the relationship between a dependent variable and several independent variables and determine the statistical significance of each independent variable.
Strengthen your understanding of multiple regression equations in CFA Level 2 Quantitative Methods with study notes, practice questions, and mock exams.
Offered by AnalystPrep


Get Ahead on Your Study Prep This Cyber Monday! Save 35% on all CFA® and FRM® Unlimited Packages. Use code CYBERMONDAY at checkout. Offer ends Dec 1st.