Describe Influence Analysis and Method ...
In statistics, regression analysis is a method of modeling the relationships between a... Read More
Mutually exclusive projects compete for resources and management can therefore only pick one or a few out of a group of profitable projects. Usually, the project(s) with the highest NPV is (are) the most suitable. However, projects that need to be replaced and/or that have unequal lives complicate the analysis. In finance, this is often called a replacement chain.
Consider two projects with unequal lives:
$$ \textbf{End of Year Cashflows} $$
$$\small{\begin{array}{l|c|c} \text{Year} & \text{Project A} & \text{Project B} \\ \hline0 & -300 & -200 \\ \hline1 & 170 & 150 \\ \hline2 & 150 & 160 \\ \hline3 & 130 & \\ \hline\text{NPV} & \$76.18 & \$68.60 \\ \hline\text{RRR} & 10\% &10\%\\ \end{array}}$$
We can determine the NPV of the replacement chain as follows:
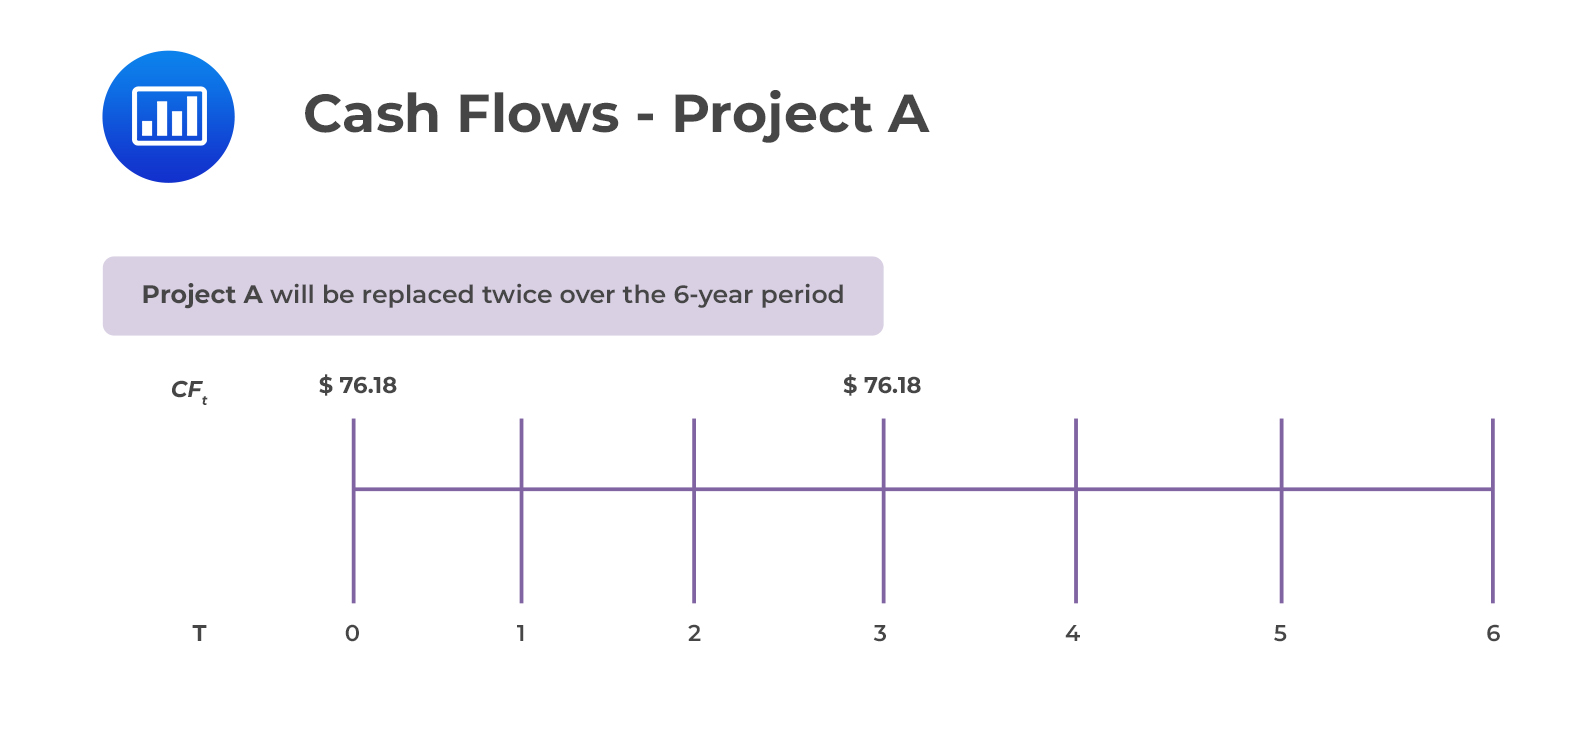
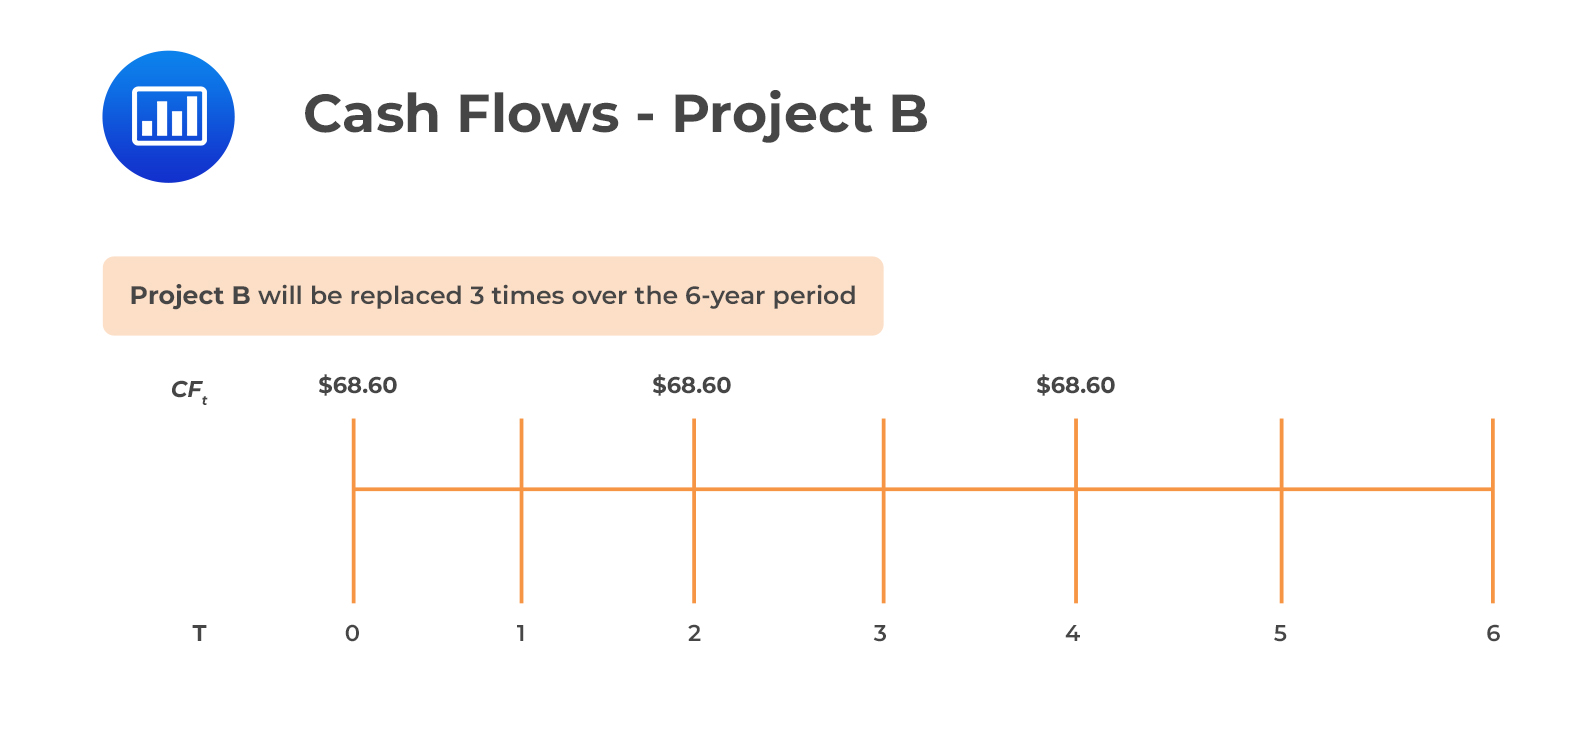
For both projects, the least common multiple of 2 and 3 is 6.


The above means that means investing in Project A is equivalent to receiving $76.18 at times 0 and 3 while investing in Project B is equivalent to receiving $68.60 at times 0, 2 and 4.
The present values of the cash flow patterns are:
$$\text{PV}_{A}=76.18+\frac{76.18}{1.10^{3}}=$133.42$$
$$\text{PV}_{B}=68.60+\frac{68.60}{1.10^{2}}+\frac{68.60}{1.10^{4}}=$172.15$$
The equivalent annual annuity (EAA) is a series of payments over the life of the project that is equal to the NPV.
EAA can be calculated in two steps:
\(\text{NPV}= $76.18\)
\(\text{N} = 3\)
\(\text{i} =10\%\)
\(\text{PMT} =$30.63\)
\(\text{NPV}=$68.60\)
\(\text{N} = 2\)
\(\text{i}=10\%\)
\(\text{PMT} =$39.53\)
We will select Project B since it has a higher equivalent annual annuity (EAA) of $39.53.
Capital rationing is an approach that investors or companies adopt to limit the number of projects that they choose to invest in at a time. With several profitable investments, capital rationing helps in selecting the project with highest profitability. This is applicable when the company has a fixed capital budget.
Suppose Company X has a fixed capital budget of $1,200 and the opportunity to invest in 3 projects. The exhibit below details the 3 projects.
$$ \textbf{Projects A, B, and C} $$
$$\small{\begin{array}{l|c|c|c|c} & \textbf{Investment Outlay} & \textbf{NPV} & \textbf{PI} & \textbf{IRR} \\ \hline\text{Project A} & 200 & 70 & 1.35 & 16 \\ \hline\text{Project B} & 800 & 220 & 1.5 & 15 \\ \hline\text{Project C} & 200 & -60 & 0.7 & 10\\ \end{array}}$$
With a fixed capital budget of $1,200, the analyst will choose Project A and Project B to get an NPV of $290 and will remain with $200 of the capital budget. If the analyst chooses to invest in Project C, he will reduce his NPV to $230. When a company has a fixed capital budget, the PI is handy since it shows the profitability of each investment per dollar amount invested. However, the IRR is not as reliable as NPV and PI in selecting projects under capital rationing because high IRR investments may have low NPVs.
Capital rationing has a tendency of misallocating resources and violating the market efficiency hypothesis if resources are not invested in areas that generate the highest returns. Corporations that use capital rationing either use hard capital rationing (managers have a fixed capital budget that they cannot change) or soft capital rationing (managers have more freedom to go beyond the budget if the investment is profitable).
Question
Cran Ltd. has come across two projects it would like to consider investing in. The two projects are mutually exclusive. The companies required rate of return is 10%.
$$\small{\begin{array}{l|c|c} & \textbf{Project Alpha} & \textbf{Project Delta} \\ \hline\text{Outlay} & (\$115,000) & (\$100,000) \\ \hline\text{Year 1 cash flows} & \$30,000 & \$45,000\\ \hline\text{Year 2 cash flows} & \$35,000 & \$25,000 \\ \hline\text{Year 3 cash flows} & \$30,000 & \$30,000\\ \hline\text{Year 4 cash flows} & \$25,000 & \$40,000\\ \hline\text{Year 5 cash flows} & \$25,000 & {}\\ \hline\text{Year 6 cash flows} & \$30,000 & {}\\ \end{array}}$$
Cran Ltd. will most likely select:
A. Project Alpha.
B. Project Delta.
C. Both Project Alpha and Project Delta.
Solution
The correct answer is B.
First, we will calculate the NPV for each project.
$$\small{\begin{array}{l|c|c|c|c} & \textbf{Project Alpha} & \textbf{PV} & \textbf{Project Delta} & \textbf{PV} \\ \hline\text{Outlay} & (\$ 115,000) & & (\$100,000) & \\ \hline\text{Year 1} & \$ 30,000 & \$ 27,273 & \$ 45,000 & \$ 40,909.50 \\ \hline\text{Year 2} & \$ 35,000 & \$ 28,924 & \$ 25,000 & \$ 20,660 \\ \hline\text{Year 3} & \$ 30,000 & \$ 22,539 & \$ 30,000 & \$ 22,539 \\ \hline\text{Year 4} & \$ 25,000 & \$ 17,075 & \$ 40,000 & \$ 27,320 \\ \hline\text{Year 5} & \$ 25,000 & \$ 15,522.50 & & \\ \hline\text{Year 6} & \$ 30,000 & \$ 16,935 & & \\ \hline\text{Outlay} & & (\$ 115,000) & & (\$ 100,000) \\ \hline\textbf{NPV} & & \bf{\$ 13,268.50} & & \bf{\$ 11,428.50}\\ \end{array}}$$
Now that we have calculated the NPV, we will go ahead and calculate the EAA for each project.
$$\text{EAA for Project Alpha}=\frac{13,268.50}{\frac{1}{0.1}\bigg[1-\frac{1}{(1+0.1)^{6}}\bigg]}=$3,046.50$$
$$\text{EAA for Project Delta}=\frac{11,428.50}{\frac{1}{0.1}\bigg[1-\frac{1}{(1+0.1)^{4}}\bigg]}=$3,605.36.50$$
We will select Project Delta since it has a higher equivalent annual annuity of $3,605.36.
A is incorrect. While Project Alpha has a higher NPV than Project Delta, its equivalent annual annuity is lower than that of Project Delta. This means that Project Alpha has lower constant annual cashflows over its lifespan.
C is incorrect. Because we can only choose one project since the question clearly states that the two projects are mutually exclusive.
Reading 19: Capital Budgeting
LOS 19 (c) Evaluate capital projects and determine the optimal capital project in situations of;