


The Mean Reversion
Mean reversion refers to the behavior of a time series to fall when... Read More

The following results are obtained from regressing the price of the US Dollar Index (USDX) on inflation rates and real interest rates.
$$\small{\begin{array}{l|c}\textbf{Regression Statistics}\\ \hline\text{Multiple R} & 0.8264\\ \hline\text{R Square} & 0.6830\\ \hline\text{Adjusted R Square} & 0.5924\\ \hline\text{Standard Error} & 5.3537\\ \hline\text{Observations} & 10\\ \end{array}}$$
$$\small{\begin{array}{l|l|l|l|l}{}& \textbf{Coefficients} & \textbf{Standard Error} & \textbf{t Stat} & \textbf{P-value}\\ \hline\text{Intercept} & 81 & 7.9659 & 10.1296 & 0.0000\\ \hline\text{Inflation rates} & -276 & 233.0748 & -1.1833 & 0.2753\\ \hline\text{Real interest Rates} & 902 & 279.6949 & 3.2266 & 0.0145\\ \end{array}}$$
Test the null hypothesis that the inflation rate is equal to 0 against the alternative hypothesis that it is not equal to 0 at the 5% significance level and interpret the results
We are testing the hypothesis:
\(H_{o}:b_1=0\) vs. \(H_1:b_1≠0\)
The 5% two-tailed critical t-value with \(10 – 2 – 1 = 7\) degrees of freedom is 2.365
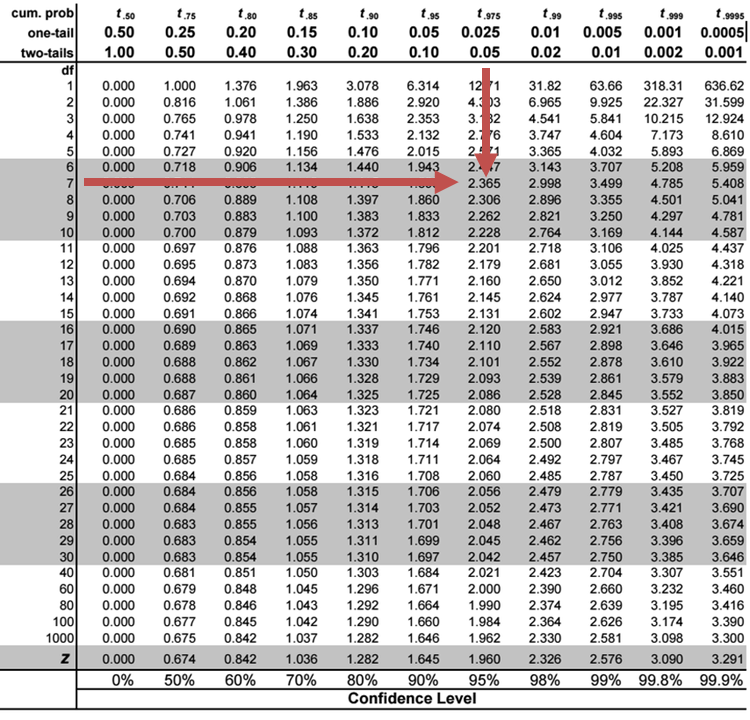
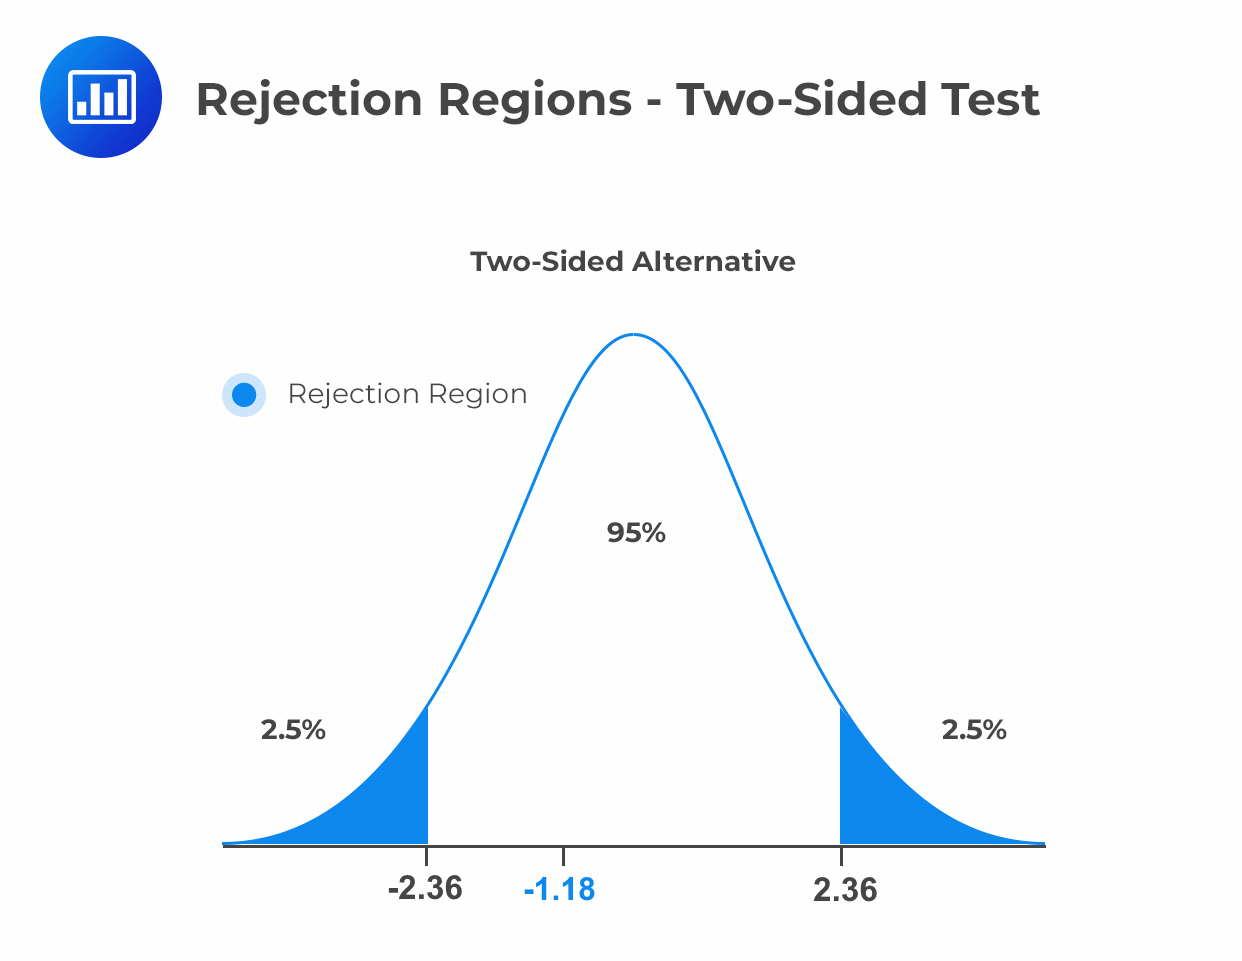
The null hypothesis is rejected if the t-statistic is either greater than 2.365 or smaller than –2.365 (the critical value).
$$t=\frac{\widehat{b_{j}}-b_{H0}}{S_{\widehat{b_{j}}}}$$
$$\begin{align*}t&=\frac{-276-0}{233.0748}&\\&=-1.18\end{align*}$$
The t-statistic of -1.18 is between the upper and lower critical t-values of –2.3646 and 2.3646. We cannot reject the null hypothesis and must conclude that the inflation rate regression coefficient is NOT statistically significantly different from 0 at the 5% significance level.
 Reading 2: Multiple Regression
LOS 2 (d) Interpret the results of hypothesis tests of regression coefficients
Offered by AnalystPrep


Get Ahead on Your Study Prep This Cyber Monday! Save 35% on all CFA® and FRM® Unlimited Packages. Use code CYBERMONDAY at checkout. Offer ends Dec 1st.