Business Cycle and Earnings Growth Exp ...
Earnings and business cycles have a very close relationship. Investors should, therefore, have... Read More
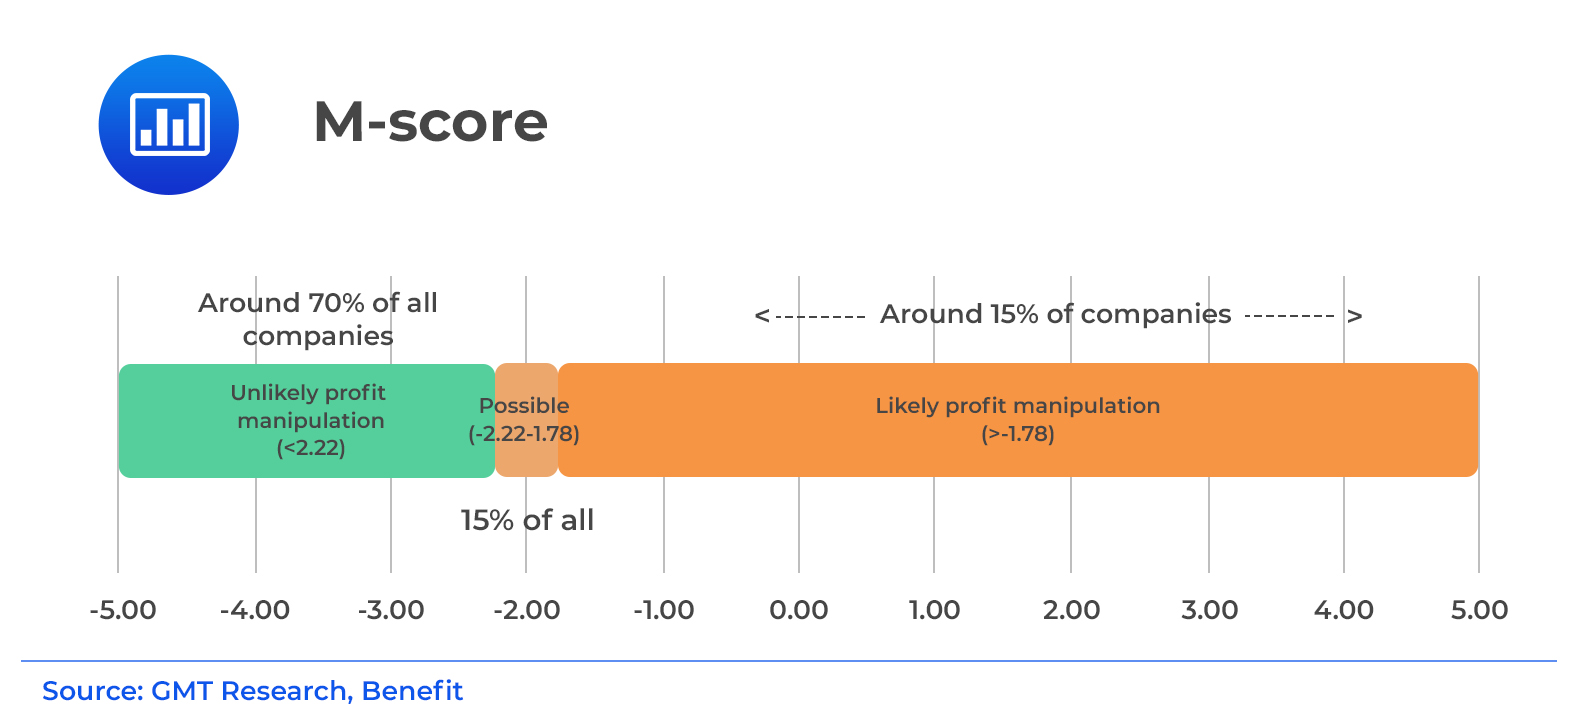
The M-score is the score indicating the probability of earnings manipulation. (Refer to the previous section for analysis of the model variables.) The M-score is a normally distributed random variable with a mean of 0 and a standard deviation of 1. Therefore, the probability of earnings manipulation can be calculated using the cumulative probabilities for a standard normal distribution or the NORMSDIST function in Excel. For example, M-scores of –1.49 and –1.78 indicate that the probability of earnings manipulation is 6.8% and 3.8%, respectively. Higher M-scores, i.e., less negative numbers, indicate an increased probability of earnings manipulation.
Additionally, the use of the M-score for classifying companies as potential manipulators depend on the relative cost of Type I errors and Type II errors. Type I errors occur due to incorrectly classifying a manipulator company as a non-manipulator. On the other hand, Type II errors are as a result of incorrectly classifying a non-manipulator as a manipulator. Beneish assessed that the likely relevant cutoff for investors is a probability of earnings manipulation of 3.8% (an M-score exceeding –1.78).
 Note: Exam tip: Do not memorize the Beneish model or coefficients – instead, be in a position to interpret the model. We illustrate an example in the section that follows:
Beneish’s M-score analysis for ABC Corporation (a hypothetical company) is shown below:
$$ \textbf{ABC Corporation M-score} $$
$$\small{\begin{array}{l|r|r|r} \textbf{Variable} & \textbf{Value of Variable} & {\textbf{Coefficient from}\\ \textbf{Beneish Model}} & \textbf{Calculations}\\ \hline\text{DSRI} & 1.200 & 0.947 & 1.136\\ \hline\text{GMI} & 1.000 & 0.471 & 0.471\\ \hline\text{AQI} & 0.600 & 0.438 & 0.263\\ \hline\text{SGI} & 1.000 & 1.041 & 1.041\\ \hline\text{DEPI} & 1.000 & 0.067 & 0.067\\ \hline\text{SGAI} & 0.400 & -0.408 & -0.163\\ \hline\text{Accruals} & 0.130 & 4.938 & 0.642\\ \hline\text{LEVI} & 0.400 & -0.640 & -0.256\\ \hline\text{Intercept} & {}& {}& -4.740\\ \hline\text{M-score} &{} &{} & -1.071\\ \hline\text{Probability of manipulation} &{} &{} & 7.93\%\\ \end{array}}$$
Question 1: Assume that an analyst uses a cut-off value of -1.78 for the M-score. Would the results of the Beneish model call for the analyst to identify ABC as a probable manipulator?
The M-score for ABC is -1.071, which is higher than the cut-off of -1.78. This indicates a higher than the acceptable probability of manipulation. Therefore, the model is expected to lead an analyst to identify ABC as a probable manipulator. For ABC Corporation, the Beneish model estimates the probability of manipulation as 7.93%. Although the classification of companies as manipulators depends on the relative cost of Type I errors and Type II errors, the value of 7.93% greatly exceeds the cut-off of 3.8% that Beneish identified as the relevant cut-off.
Question 2: From the exhibit, the values of DSRI, GMI, SGI, and DEPI are exceeding one. In the Beneish model, what does this indicate for each variable?
Days Sales Receivable Index (DSRI) is the ratio of days’ sales receivables in year t relative to year t – 1. The value higher than one for DSR indicates that receivables as a percentage of sales have increased. This variation may be reflective of improper revenue recognition leading to revenue inflation.
Gross Margin Index (GMI) is the ratio of gross margin in year t – 1 to that in year t. When this ratio is greater than 1, the gross margin has declined.
Sales Growth Index (SGI) is the ratio of sales in year t relative to year t – 1. The value higher than one for SGI indicates positive sales growth relative to the previous year. Companies could be predisposed to manipulate earnings to manage perceptions of continuing growth and also to obtain the capital needed to support growth.
Depreciation Index (DEPI) is the proportion of depreciation rate in year t – 1 to the corresponding rate in year t. A DEPI greater than 1 suggests a slower depreciation rate of ABC’s assets to manipulate earnings.
Question
An analyst collects the following information to use the Beneish model to assess XYZ’s corporation (a hypothetical company) likelihood of misreporting.
$$ \textbf{Selected Beneish Model Data for XYZ Corporation} $$
$$\small{\begin{array}{l|r|r} {}& \textbf{Current year} & \textbf{Previous Year}\\ \text{Days’ sales receivable index (DSR)} & 1.135 & 0.835\\ \hline\text{Leverage index (LEVI)} & 0.885 & 0.685\\ \hline\text{Sales, general, and administrative expenses index (SGAI)} & 0.685 & 0.535\\ \end{array}}$$
All else held constant, which variable in the Beneish model has a year-over-year change that would most likely increase XYZ’s likelihood of manipulation?
A. DSR
B. LEVI
C. SGAI
Solution
The correct answer is A.
The Days Sales Receivable Index (DSR) variable in the Beneish model is positively related to the Beneish model M-score. Thus, a year-over-year increase in DSR from 0.835 to 1.135 would lead to an increase in the M-score, which implies an escalation in XYZ’s probability of manipulation.
B is incorrect. The Leverage Index (LEVI) variable is negatively related to the Beneish model M-score. Hence, a year-over-year increase in LEVI from 0.685 to 0.8855 would lead to a decline in the M-score, which implies a decrease in XYZ’s likelihood of manipulation.
C is incorrect. The Sales, General, and Administrative Expenses Index (SGAI) variable is negatively related to the Beneish model M-score. Therefore, a year-over-year increase in SGAI from 0.535 to 0.685 would lead to a decrease in the M-score, which implies a decrease (not increase) in XYZ’s likelihood of manipulation
Reading 15: Evaluating Quality of Financial Reports
LOS 15 (d) Evaluate the quality of a company’s financial reports.
Get Ahead on Your Study Prep This Cyber Monday! Save 35% on all CFA® and FRM® Unlimited Packages. Use code CYBERMONDAY at checkout. Offer ends Dec 1st.