


Definitions of Cash Flow
There are various proxies for cash flow that may be used when... Read More

The parametric method is also called the variance-covariance method. This method looks at the price changes of an investment over a lookback period and computes a portfolio’s maximum loss using probability theory. It uses the standard deviation and the mean of the price returns of an asset as the parameters. The maximum loss within a specific confidence level is calculated, assuming asset price returns and volatility follow a normal distribution.
The variance-covariance method is the most common way of estimating VaR. It owes its popularity to the fact that it only requires the mean and standard deviation of the portfolio to perform the calculations. The assumption that the returns of portfolios are normally distributed allows the manager to use the calculated standard deviation to obtain a standard normal z score. The z score uses a standard normal table to determine the risk position with a degree of confidence.
The following is a normal distribution curve showing the distribution of hypothetical daily returns:
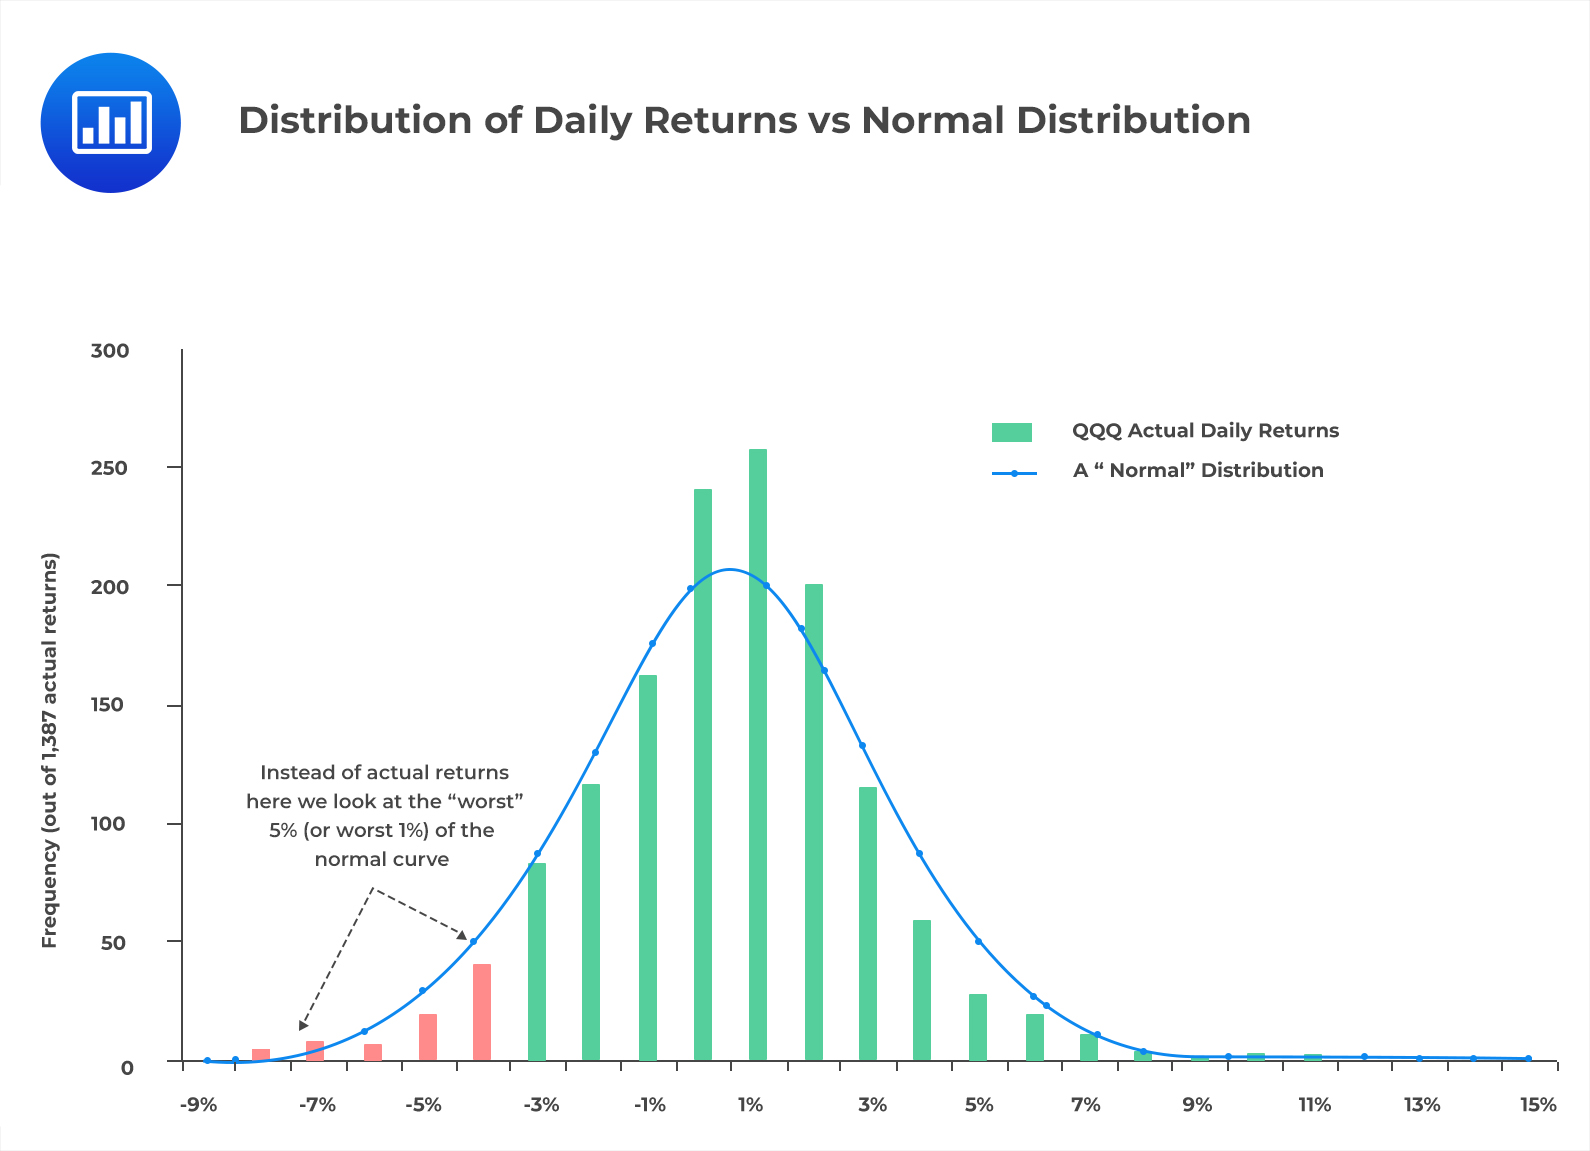 Unlike the historical simulation method, which will be discussed later, where we use actual data, we use the familiar curve under the parametric method. The parametric method makes it easy to automatically know where the worst 5% and 1% lie on the normal curve.
The historical simulation method assumes that the past performance of a portfolio is a good indicator of its performance in the near future. This method reorganizes actual historical returns by ranking them from the worst to the best. It assumes the recurrence of the trend, from a risk perspective.
Unlike the other two methods, the historical simulation method does not need any distributional assumption to estimate VaR.
A significant drawback of this method is that VaR estimates depend on the lookback period and, therefore, forecasts are highly dependent on the characteristics of the sample data. A high volatile lookback period overestimates VaR, while a low volatile lookback period underestimates VaR.
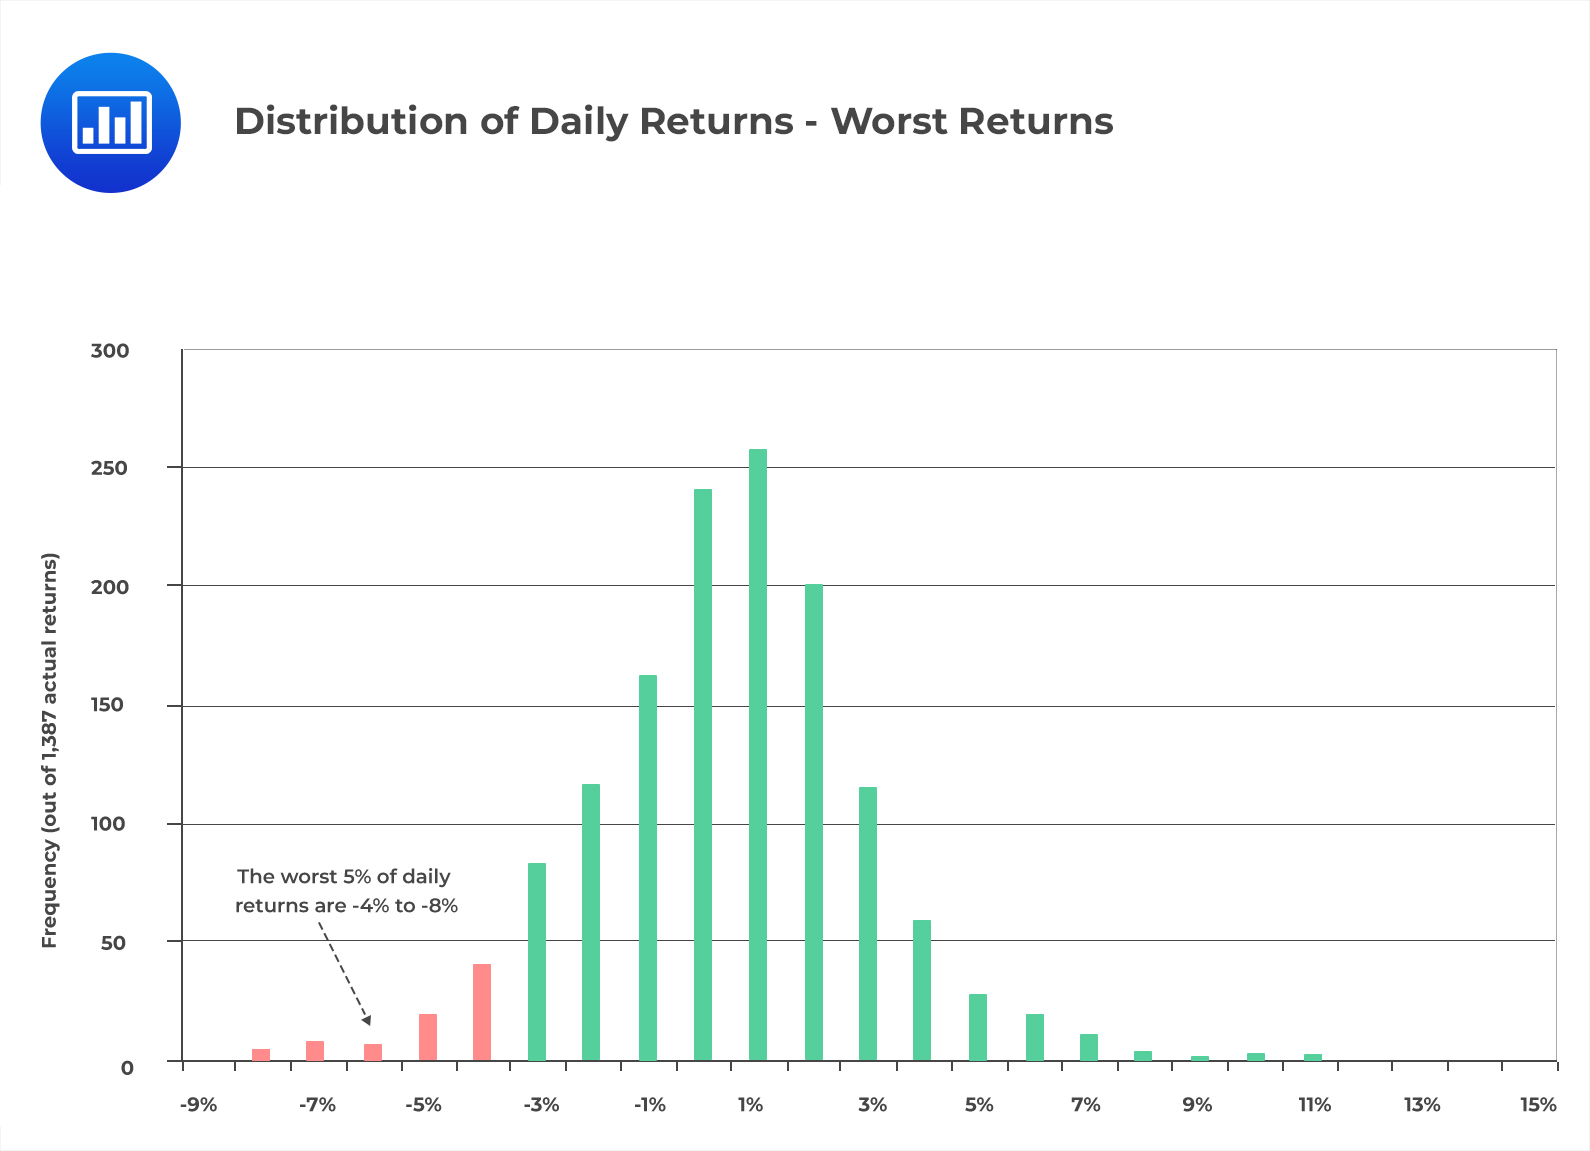
Consider the following histogram that represents the distribution of daily returns:
 $$ \textbf{(Harper, 2004)} $$
Notice that since returns are arranged from left to right, the worst returns are always on the left tail. We can deduce, therefore, that we are 95% confident that the expected worst daily loss will be 4%, at most.
Monte Carlo simulation is a method that randomly generates trials without providing any information about the underlying methodology. This method of VaR computation is somewhat similar to the historical simulation method. However, Monte Carlo simulation generates random numbers to estimate the return of an asset. It neither uses historical data of returns nor assumes a recurrence.
This procedure is repeated numerous times. The nth percentile estimates the n% VaR. The sample used and the distribution assumptions of the risk factors significantly affect the VaR estimate. With a large sample size, the Monte Carlo method produces the same results as the parametric method, provided the specified distribution and the parameters used are the same.
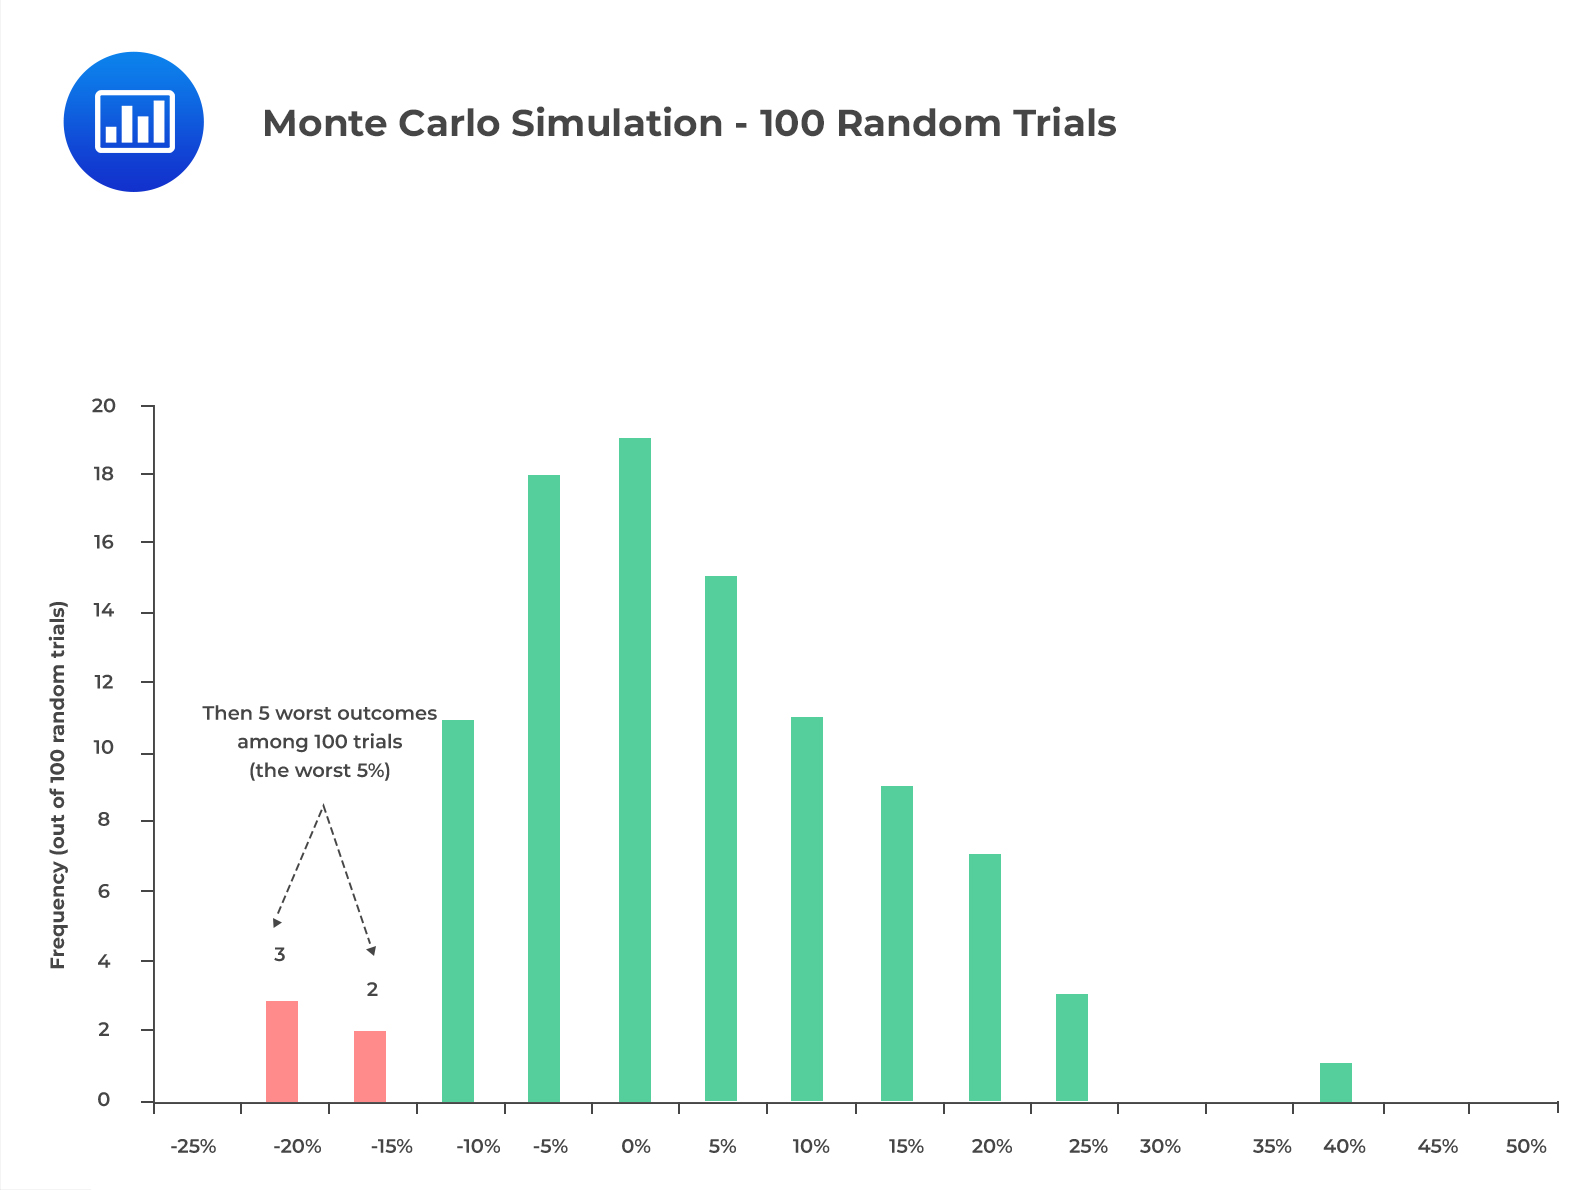
The following histogram represents monthly returns generated using a Monte Carlo Simulation of 100 random trials.
 $$ \textbf{(Harper, 2004)} $$
From the above histogram, we can conclude that we are 95% confident that the expected monthly loss will be 15%, at most.
Question
Which of the following statements is least likely true about the historical simulation method of estimating VaR?
- This method uses a lookback period to estimate VaR.
- This method assumes that the past performance of a portfolio is a good indicator of its performance in the near future.
- This method assumes that asset price returns and volatility follow a normal distribution.
Solution
The correct answer is C.
Unlike the Monte Carlo and parametric methods, the historical simulation method does not need any distributional assumptions to estimate VaR. This is because Monte Carlo uses historical data to perform the estimation.
A is incorrect. Historical simulation method’s VaR estimates depend on the lookback period and, therefore, forecasts are highly dependent on the features of the sample data. This is the major drawback of the method.
B is incorrect. The historical simulation method assumes that the past performance of a portfolio is a good indicator of its performance in the near future. It involves reorganization of actual historical returns by putting them in order (from the worst to the best) and the assumption that the trend will repeat itself, from a risk perspective.
Reading 41: Measuring and Managing Market Risk
LOS 41 (b) Compare the parametric (variance-covariance), historical simulation, and Monte Carlo simulation methods for estimating VaR.
Strengthen your CFA Level II preparation with exam-style questions, QBank drills, and full mock exams designed to help you compare parametric, historical simulation, and Monte Carlo approaches to Value at Risk under exam conditions.
Offered by AnalystPrep


Get Ahead on Your Study Prep This Cyber Monday! Save 35% on all CFA® and FRM® Unlimited Packages. Use code CYBERMONDAY at checkout. Offer ends Dec 1st.