


Convergence Hypotheses
Convergence refers to a situation where countries with low per capita incomes grow... Read More

The production function shows that economic growth is mainly affected by increased labor and capital. The size of Labor is measured using the total number of hours available for work. The labor force is the proportion of the working population (age 16 to 64) who are either employed or unemployed but are willing to work. An increase in people available for work positively affects economic growth.
The long-term anticipation of the labor supply is determined by the growth rate of the working portion of the population. Population growth is dependent on fertility and mortality rates. The population growth rate is higher in developing countries compared to developed countries. Population growth increases the economy’s growth rate but does not affect an increase in per capita GDP.
The age mixture in the population is also crucial. When the population proportion over 65 years is more than those below 16 years, it is considered a demographic burden. For instance, in Japan, the elderly population (over 65 years) is more than those below 16 years of age.
Conversely, developing countries will experience a demographic boost if the population below 16 years decreases.
Labor force participation is the proportion of the working-age in the labor force. Labor force participation has increased in many countries due to women’s inclusion. Unlike population growth, labor participation increases the growth of per capita GDP.
A rising or fall in labor force participation is likely to reflect a movement to a higher or lower level of involvement than a permanent change. III.
Immigration increases economic and population growth, mainly in developed countries. The developed countries experience a slowing labor force, opting for immigration. For instance, the labor force has increased in the US, Ireland, and Spain due to increased immigration over the past ten years.
The average hours worked affect the contribution of labor to the overall output. Average hours worked are very sensitive to the business cycle. In developed countries, the long-term trend has been towards shorter work weeks due to collective bargaining agreements, growth of temporary and part-time work, legislation, the impact of the wealth effect, and high tax rates on labor income. This causes high-income countries to value leisure more than labor income.
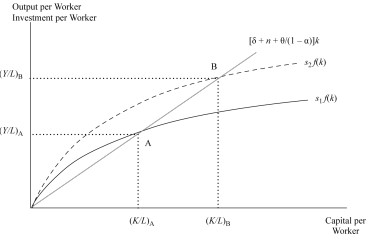
A high saving rate leads to a higher capital to-labor ratio (k) and labor productivity (y) due to more savings or investments at each output level.
Graphically, a high saving rate shifts the \(sf(k)\) curve upwards, hence the equilibrium points.
When the depreciation rate drops, the equilibrium capital to-labor ratio and output per worker decreases since a given gross saving rate creates less capital accumulation. Graphically, it increases the slope of the required investment and hence changes the equilibrium position.
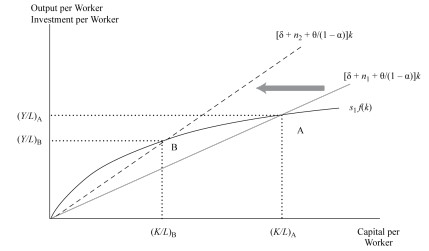
When the growth rate of the labor force increases, the equilibrium capital to-labor ratio decreases since the corresponding rise in the steady-state growth rate of capital is necessary. Graphically, when the slope of the required investment increases, it also shifts the equilibrium positions.
When there is a rise in the growth rate of TFP, the steady-state capital-to-labor ratio and output per worker is reduced for a provided size of labor and TFP. Graphically, the effect is the same as that of labor force growth.
An economy experiences a higher or slower growth relative to a steady state when transitioning to stable growth alignment.
Using Eq 1, Eq 2, and Eq 3, we can present the growth rate of output per capita as:
$$ \frac{{\Delta y}}{y}=\frac{\theta}{1-\alpha}+\alpha s\left(\frac{Y}{K}-{\Psi}\right)=\frac{\theta}{1-\alpha}+\alpha s\left(\frac{y}{k}-{\Psi}\right)\ldots\ldots\ldots\ldots..(Eq\ 5) $$
And growth to labor ratio as:
$$ \frac{{\Delta k}}{k}=\frac{\theta}{1-\alpha}+s\left(\frac{Y}{K}-{\Psi}\right)=\frac{\theta}{1-\alpha}+s\left(\frac{y}{k}-{\Psi}\right)\ldots\ldots\ldots\ldots..(Eq\ 6) $$
The second equality of (Eq 5) and (Eq 6) is true since the definition of \(y\) and \(k\), and it implies that \(\frac{Y}{K}=\frac{y}{k}\)
Graphically, the relationships in the Neoclassical growth theory is are shown below
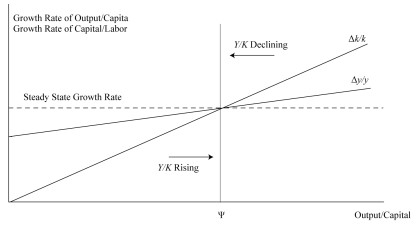
When the output to-capital ratio is higher than the equilibrium level \((\Psi)\), Eq 5 and Eq 6 are positive. Moreover, the growth rates of the production per capita and the capital to-labor ratios are higher than the steady state \(\left[\frac{\theta}{1-\alpha}\right]\). This represents a situation where the actual savings/investments are higher than the required investment. The trend rate of capital deepeningrate of capital deepening causes the trend in per capita output.
Conversely, if the output to-capital ratio is below the steady state, the actual investment is insufficient to maintain the capital-to-labor ratio trend. Besides, the output per capita and capital to-labor ratios grow more slowly.
Capital Accumulation
In the long run, capital accumulation will affect growth but not the level of output. A growing economy will always move towards a steady state of growth. The growth rate of output is not dependent on the capital accumulated.
Capital Deepening vs. Technology
For long-term sustainable growth to occur, an economy cannot rely on capital-deepening investments alone. Diminishing marginal returns will occur when the increase of some inputs is not the same as other inputs. Without improvements in TFP per capita output, labor productivity growth will reduce. Because of diminishing marginal returns to capital, only growth in technology will lead to the sustainable growth of potential GDP per capita.
Convergence
The high marginal productivity of capital and high saving rates in developing countries should make the growth rates of such countries higher than that of developed countries. Therefore, a convergence of per capita incomes should exist between developed and developing countries over time.
Effects of savings on growth
In the short run, higher savings will lead to an increase in the economy’s growth rate, and the growth exceeds the steady-state growth rate, but once the transition period is over, it returns to a balanced state. Higher levels of productivity are experienced during the transition period. Once steady-state growth is reached, the economy no longer depends on the high savings rate.
Endogenous growth theory explains technological progress rather than taking it as an external (exogenous) factor. According to the model, self-sufficient economic growth results from the model’s outcome, and the economy does not converge to an equilibrium position of the growth rate. In contrast with the neoclassical model, there is no diminishing marginal capital for the whole economy. Therefore, a permanent increase in the saving rate increases economic growth.
The production function in the endogenous growth theory’s production function is a straight line (unlike that of the neoclassical model, which is curved) given by:
$$ y_e=f\left(k_e\right)=ck_e\ldots\ldots\ldots\ldots\ldots(Eq\ 7) $$
Where:
\(e\)=denotes endogenous growth model and
\(k_e\)=capital per worker.
\(y_e\)=output per worker (proportional to capital per worker).
\(c\)=constant marginal product of capital in the whole economy.
The endogenous growth model postulates that the output-to-capital ratio \((c)\) and the output per worker \((y_e)\) grows at the same pace as the capital per worker \((k_e)\). Hence, faster (slower) accumulation of capital results in faster(slower) growth in output per capita.
Now, if (Eq 7) is in (Eq 2), we get:
$$ \frac{{\Delta}y_e}{y_e}=sc-\delta-n $$
Note that the right-hand side of the above equation is a constant implying that it applies to both the long-run and the short-run growth rates. Moreover, an increased saving rate \((s)\) results in a permanently high growth rate. The equation above is the result of the endogenous growth theory.
Question
An economy with a per capita income constant growth rate of 4%, a saving rate of 20%, an output-to-capital ratio of 0.65, depreciation of 10%, and a labor force growth rate of 1.5%. The saving rate increased by 4.5%. According to endogenous growth theory, the new steady growth rate is closest to:
- 4.325%
- 4.252%
- 4.425%
Solution
The correct answer is C.
From the information given in the question,
\(s = 0.02 + 0.045=0.245\)
\(\delta=0.1, n=0.015\) and
Output-to-capital ratio (which is constant for endogenous growth theory), \(c = 0.65\)
Under the endogenous growth theory, the new growth rate of the per capita income is given by:
$$ \frac{{\Delta}y_e}{y_e}=sc-\delta-n=0.245\times0.65-0.10-0.015=0.04425=4.425\% $$
Reading 9: Economic Growth
LOS 9 (g) Explain how demographics, immigration, and labor force participation affect the rate and sustainability of economic growth.
Review how demographics, immigration, and labor force participation affect economic growth with CFA Level 2 study notes, practice questions, mock exams, and video lessons designed to strengthen your exam preparation.
Offered by AnalystPrep


Get Ahead on Your Study Prep This Cyber Monday! Save 35% on all CFA® and FRM® Unlimited Packages. Use code CYBERMONDAY at checkout. Offer ends Dec 1st.