Historical Scenario Analysis

Historical Scenario Analysis

Historical scenario analysis is a form of backtesting that examines the risk and performance of an investment strategy at different structural breaks and structural regimes. The most common types of regime changes are from economic expansion to recessions and from high-volatility to low-volatility.
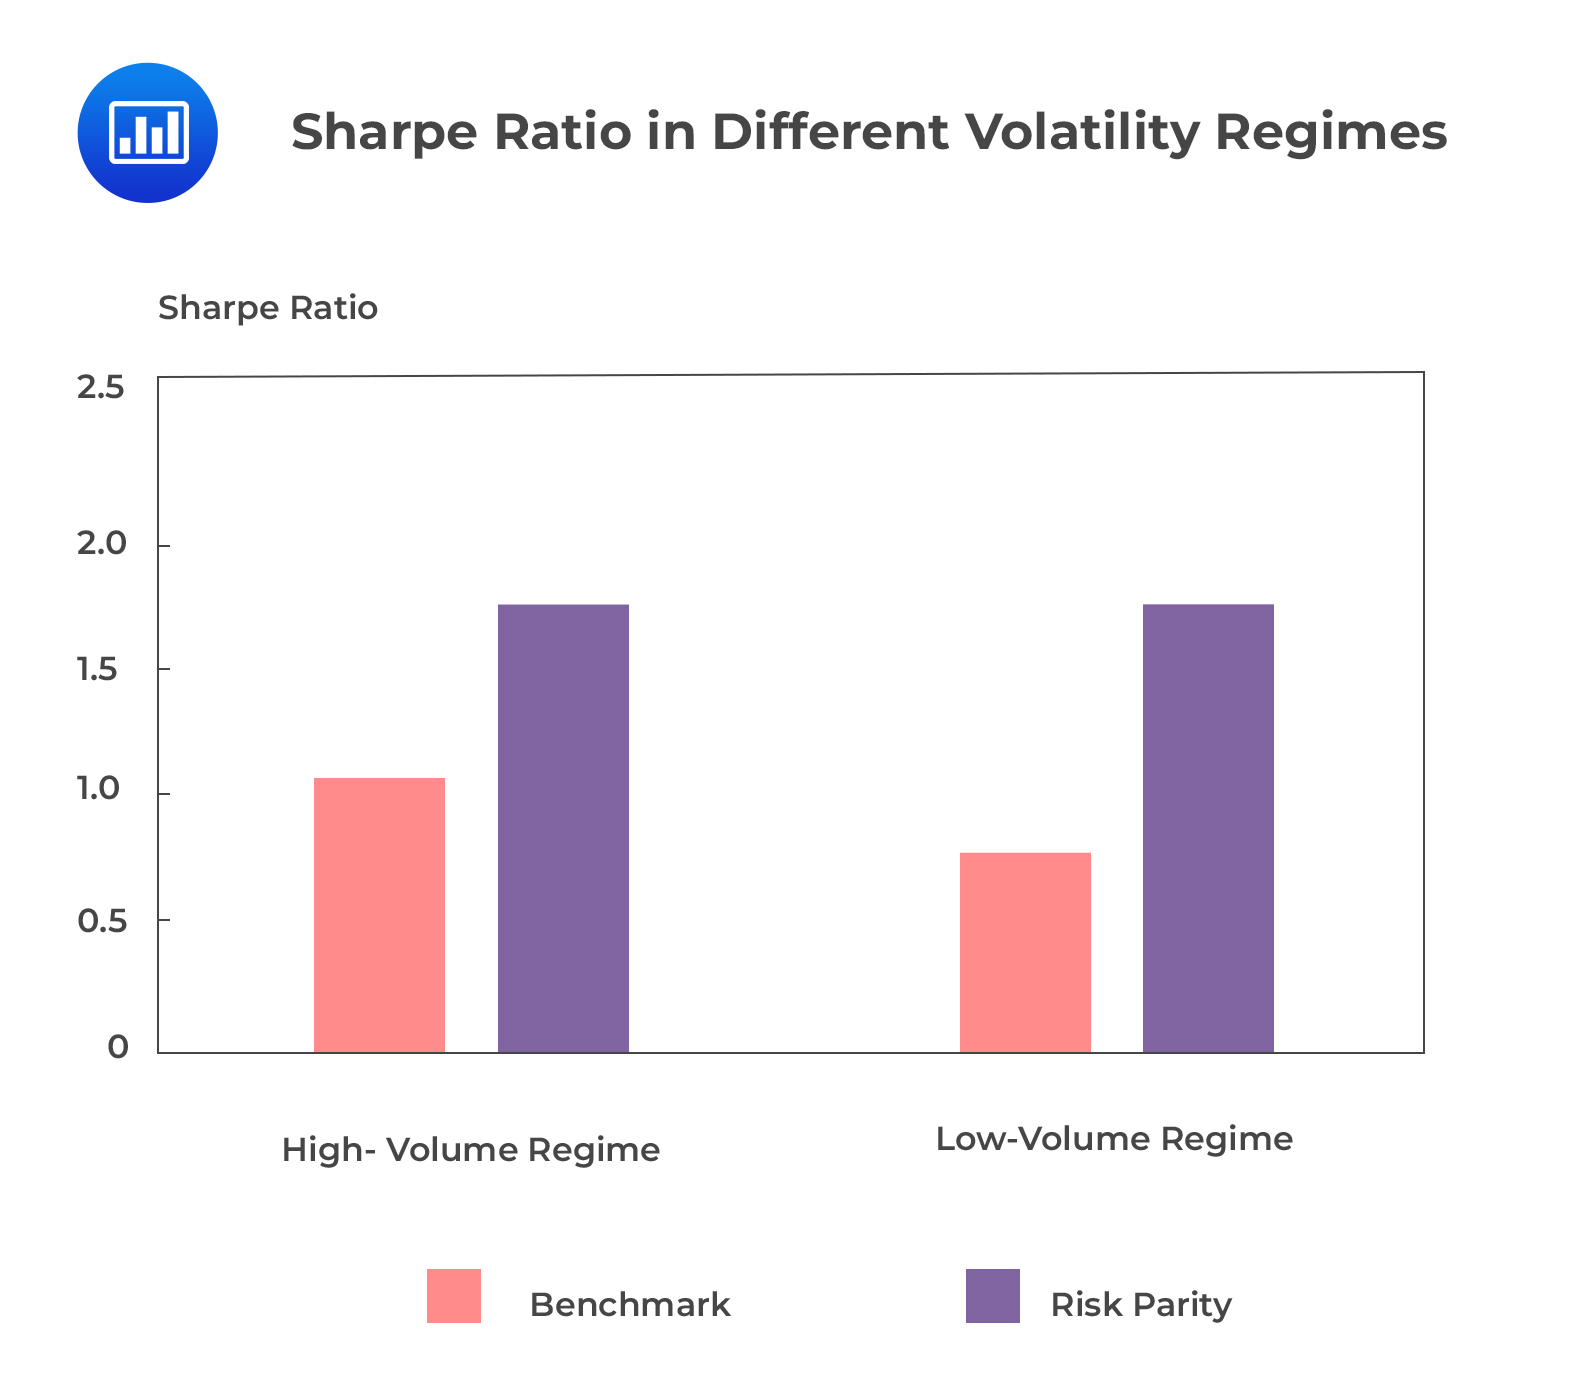
  1. High-volatility and low-volatility regimes: To illustrate this, we will use the VIX index, which gauges options implied volatility on the S&P 500 index. A five-year moving average will be computed to convert the VIX into a volatility regime indicator. The periods when the VIX is below its five-year moving average are the low-volatility regime periods.
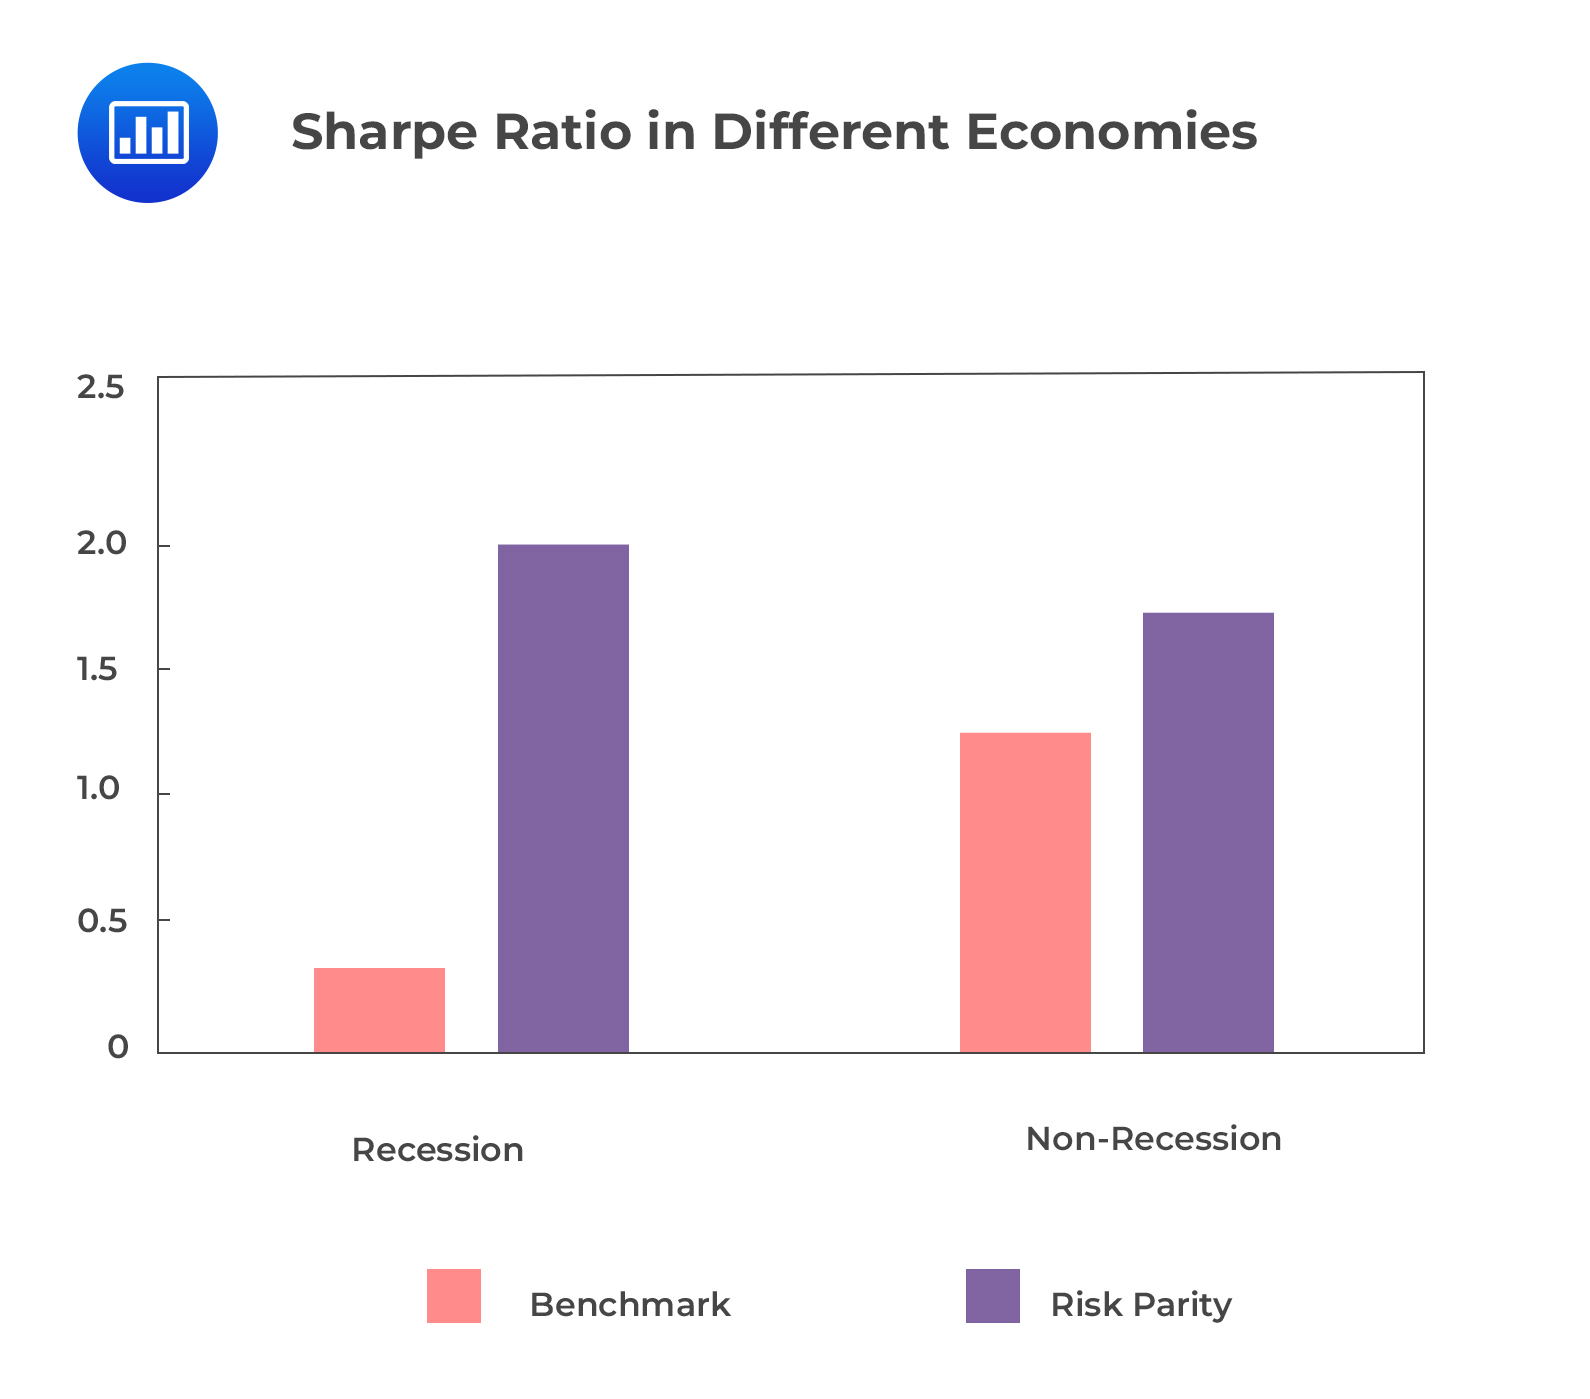
  2. Expansions and recessions: We will use the risk parity allocation strategy that the USA created in 1993 to illustrate expansions and recessions. The beginning and end of the recession are observed in hindsight.
    Sharpe Ratio in Different Economies

These two regimes can examine the risk parity and benchmark portfolio:

  • The RP strategy is strong in a recession, while the benchmark strategy performs negatively in a recession.
  • The BM strategy struggles in low-volatility regimes, while the RP strategy performs well in both high and low volatility.
  • The BM and RP strategies have higher standard deviations in a non-recession environment.
  • The BM has lower average returns in a recession, which is indicated by excess kurtosis and negative skewness.
  • Lastly, the RP strategy also has lower average returns in the recession regime with lower kurtosis and volatility than the BM strategy.

Question

Mark Jayden conducted a historical scenario analysis to examine the effect of regime changes on his portfolio. He observed that the portfolio had negative skewness and a fat tail to the left in a recession regime. Which of the following is the conclusion that Jayden will most likely make about the his portfolio?

  1. Lower average returns.
  2. Higher average returns.
  3. Cannot be determined.

Solution

The correct answer is A.

Excess kurtosis and negative skewness indicate lower average returns in a recession regime.

B is incorrect. Low kurtosis and positive skewness indicate a higher average return in a recession regime.

C is incorrect. It can be determined that excess kurtosis and negative skewness indicate lower average returns.

Reading 42: Backtesting and Simulation

LOS 42 (e) Evaluate and interpret a historical scenario analysis.

Shop CFA® Exam Prep

Offered by AnalystPrep

Featured Shop FRM® Exam Prep Learn with Us

    Subscribe to our newsletter and keep up with the latest and greatest tips for success
    Shop Actuarial Exams Prep Shop Graduate Admission Exam Prep


    Daniel Glyn
    Daniel Glyn
    2021-03-24
    I have finished my FRM1 thanks to AnalystPrep. And now using AnalystPrep for my FRM2 preparation. Professor Forjan is brilliant. He gives such good explanations and analogies. And more than anything makes learning fun. A big thank you to Analystprep and Professor Forjan. 5 stars all the way!
    michael walshe
    michael walshe
    2021-03-18
    Professor James' videos are excellent for understanding the underlying theories behind financial engineering / financial analysis. The AnalystPrep videos were better than any of the others that I searched through on YouTube for providing a clear explanation of some concepts, such as Portfolio theory, CAPM, and Arbitrage Pricing theory. Watching these cleared up many of the unclarities I had in my head. Highly recommended.
    Nyka Smith
    Nyka Smith
    2021-02-18
    Every concept is very well explained by Nilay Arun. kudos to you man!
    Badr Moubile
    Badr Moubile
    2021-02-13
    Very helpfull!
    Agustin Olcese
    Agustin Olcese
    2021-01-27
    Excellent explantions, very clear!
    Jaak Jay
    Jaak Jay
    2021-01-14
    Awesome content, kudos to Prof.James Frojan
    sindhushree reddy
    sindhushree reddy
    2021-01-07
    Crisp and short ppt of Frm chapters and great explanation with examples.