Predicting Fraud by Investment Managers
After completing this reading, one should be able to: Explain the use and... Read More
After completing this reading, you should be able to:
Stocks with high book-to-market ratios, also called value stocks, have low prices relative to their net worth. On the other hand, stocks with low book-to-market ratios, also called growth stocks, are costly relative to their book value.
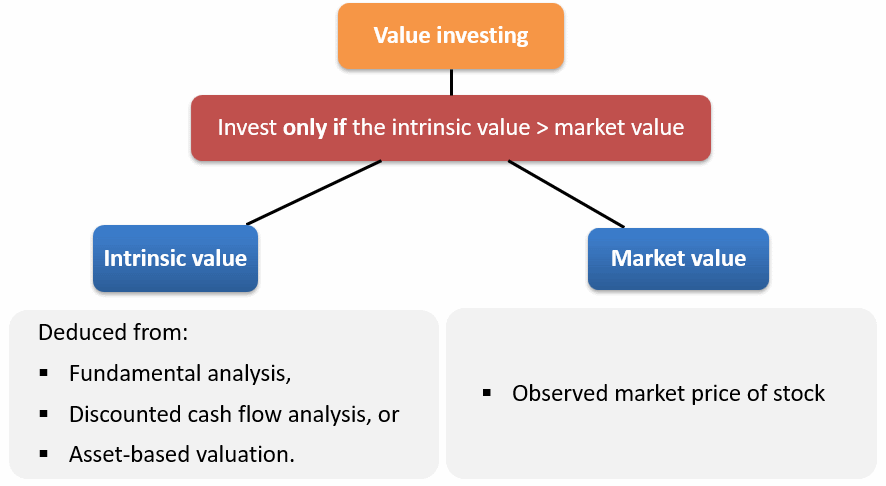
Value investing is an investment strategy in which investors are interested in buying stocks at a price lower than their true worth. Value investing usually does averagely well but may lose money, especially during a financial crisis.
 Forms of Value Investing
Passive screening: In this form, companies are put through various investment screens such as low price-to-earnings (PE) ratios, easily marketable assets, low risk, among others. The companies that pass the screens are categorized as suitable investments.
Contrarian value investing: Here, an investor buys assets that other investors are not interested in, mostly because of their poor past performances.
Activist value investing: An investor buys equity in undervalued or poorly managed companies to implement a significant change in the company.
Assets returns are typically affected by risk factors that offer premiums to compensate investors for bearing losses during bad times. Risk factors are categorized into macro and fundamental-based factors and investment-style factors.
The macro and fundamental-based factors include economic growth, volatility, inflation, among others. The investment-style factors include both static factors, such as the market, and dynamic factors.
The value premium is the higher risk-adjusted return of value stocks over growth stocks. Fama and French defined the value premium as the difference in returns between high book-to-market stocks and low book-to-market stocks, also referred to as HML.
All assets carry an element of risk. However, the amount of risk differs from one asset to another. Risky assets such as equities and currencies possess a higher risk relative to less risky assets such as government bonds. Risky assets are thus more volatile compared to less risky assets.
During times of low economic growth, risky assets perform poorly while the less risky assets tend to perform well. Investors who can comfortably weather recessions should invest more in risky assets such as equities. This means that they can enjoy higher returns in the long run, compensating for losses incurred during periods of low growth.
Investors not willing or able to bear significant losses during recessions should hold less risky assets such as government bonds. Their portfolio will most likely perform much better during recessions but worse in the long run. This is the price the investor pays for low exposure to growth risk.
Generally, all assets tend to perform poorly during periods of high inflation. High inflation is typically bad for both stocks and bonds. Bonds have fixed payments, and, therefore, high inflation leads to a lower bond value. However, it is not clear why stocks also tend to perform poorly in high inflation as they are not a stream of fixed cash flows but represent productive companies.
Volatility is a statistical measure of the rate at which prices increase or decrease for a given set of securities. Higher volatility, in most cases, implies that the security carries a high risk. The CBOE Volatility Index, or VIX, is used to represent equity market volatility. Stock returns tend to decrease as the VIX (equity volatility) increases. “Leverage effect” is this negative relationship that exists between volatility and returns.
Apart from stocks, the return of many assets and strategies are also negatively affected by increased volatility. In times of high volatility, the poor fairing of currency strategies is usually common. Investors who dislike volatility risk can purchase volatility protection. Traders can also hold derivative contracts. Significant downward movements of assets that pay off in times of high volatility often accompany periods of high volatility.
Several other macro factors have been studied extensively and deserve attention from asset owners. Some of these risk factors include the following:
The movements of macro variables and asset prices across the business cycle are explained by a class of real business cycle models that are developed in macroeconomics. There is a variation of macro variables and asset prices in these models across the business cycle, as a rational response of firms and agents adjusting to real shocks.
Productivity shock is a risk that affects the output of a company. Stock prices decline with falling productivity. Productivity shocks are positive during rising productivity, making the stock prices to increase. Productivity shocks and stock returns are therefore strongly correlated.
The new generation of dynamic stochastic generated equilibrium (DSGE) macro models has productivity as one of its sources of shocks. The economy is dynamic in DSGE models, and changes in economic variables are attributed to the actions of agents, technologies, and institutions or markets. The setting of asset prices happens from the complex interaction of all these players and technologies. With DSGE models, we can think about the transmission of shocks from these factor risks across the economy. The action of policy players is a crucial part of DSGE models.
Demographic risk is also a crucial risk that long-term investors face. The same way a productivity shock is a shock to the firm’s production, demographic risk can be interpreted as a shock to labor output. In economic overlapping generations (OLG), demography is a factor. Expected returns are affected by the demographic composition, as predicted by several OLG models. For this to occur, the following two main avenues are suggested by theory:
Higher risk premiums are necessary for the compensation of the investors bearing it if the political risk is significant. Until the onset of the financial crisis, political risk was of concern to emerging markets only. However, developed economies are also exposed to this type of risk.
There are two ways in which investors may mitigate volatility risk.
Selling volatility or buying protection produces high and stable payoffs during stable times. However, at least once every decade, there is a substantial financial crash where sellers of volatility experience large and negative payoffs. If investors sell volatility before a crisis and fail to anticipate a crash like the one of 2008-2009, then many assets will be exposed to volatility risk resulting in abysmal returns.
Market risk is the single risk factor in the capital asset pricing model (CAPM). The market factor is tradeable via low-cost index funds, stock futures, and exchange-traded funds. Some macro risk and fundamental risk factors are also tradeable. However, macro factors, such as economic growth and inflation, are not usually directly traded.
The Fama and French model is the best-known example of a tradeable multifactor model. Note that investment factors and dynamic factors are used interchangeably. The Fama and French model is a multifactor model that captures the effects of these factors.
The Fama-French three-factor model is an example of a tradeable multifactor model developed by Fama and French in 1993. It explains asset returns using three factors, which include the traditional CAPM market risk factor, and two additional factors that represent a size effect and a value or growth effect.
$$ \text{E}\left( { \text{R} }_{ \text{i} } \right) ={ \text{R} }_{ \text{f} }+{ \beta }_{ \text{i,MKT} }\text{E}\left( { \text{R} }_{ \text{m} }-{ \text{R} }_{ \text{f} } \right) +{ \beta }_{ \text{i,SMB} }\text{E}\left( \text{SMB} \right) +{ \beta }_{ \text{i,HML} }\text{E}\left( \text{HML} \right) $$
Where:
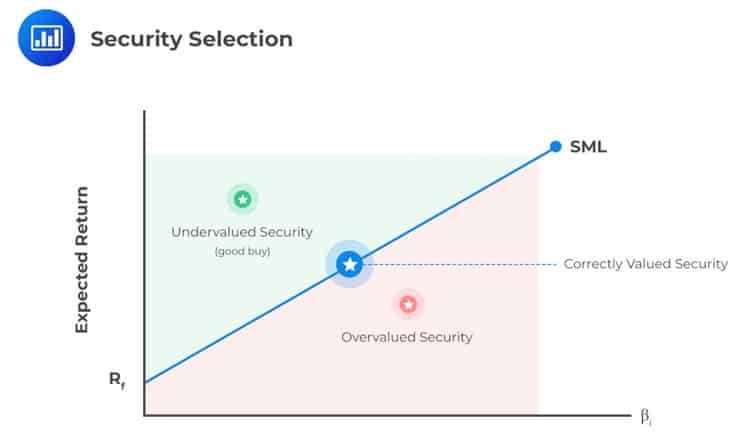
Under poor market conditions, stocks with high exposures to the market factor, that is, a high beta, \(\beta_{\text i,\text{MKT}}\), tend to perform poorly. CAPM predicts that stocks with high betas will give higher average returns than the market portfolio. This provides compensation to investors for losses when bad times hit.
The SMB factor refers to the difference in returns of small stocks minus big stocks. SMB is the short form of small-minus-big, where small and big refers to the market capitalization of the stocks. The SMB is designed to capture the outperformance of small firms relative to large firms.
The HML factor refers to the returns of a portfolio of high book-to-market stocks minus one of low book-to-market stocks. The book-to-market ratio is obtained by dividing book value by the market capitalization or taking the inverse of equity value after it is normalized by book value.
The SMB and HML betas in the FFM are centered around zero, and the market is both size- and value-neutral. Therefore, the average stock has market exposure but not size or value tilts. The market may be affected by macro factors, such as GDP growth, inflation, among others.
A value strategy involves going long on stocks that have low prices and shorting stocks with high prices.
 These prices are, in most cases, normalized by book value. Therefore, value stocks are the ones with low prices relative to book value. Growth stocks, on the other hand, have high prices relative to book value. The value premium is robust in relation to size. For the past 50 years, gains have been produced by value firms, apart from several notable periods where they have lost money.
If stock \(i\) is a value stock, then it has a positive HML beta, \({ \beta }_{ \text{i,HML} }\), and thus, averagely perform better than growth stocks. The expected return on stock \(i\) is adjusted upward by the term \({ \beta }_{ \text{i,HML} } \text{E}\left(\text{HML}\right)\) of the FFM equation with respect to the CAPM. The Fama-French model, thus, nudges stock \(i\)’s risk premium upward to account for its “valueness.” However, for a growth stock, the HML beta is negative, and thus the HML term adjusts the returns downwards.
Value stocks either perform well together or perform poorly together. Various risk factors such as investment growth, labor income risk, non-durable or luxury consumption, and housing risk explain the value premium. The betas of value stocks increase during bad economic times, exposing value firms to risk.
Behavioral theories of the value premium include overextrapolation or overreaction.
Past growth rates often get over extrapolated into the future by investors. Generally, high growth rates are often witnessed in growth firms. For example, since Apple Inc has achieved significant growth in the past by developing must-have products, investors may assume Apple’s significant growth in the future.
Since growth firms have had high growth rates, investors overestimate their growth prospects, making the firms expensive. On the other hand, value stocks are cheap as investors underestimate their growth prospects. Overextrapolating the prices of growth firms reflects excessive optimism. The hurdle with this is that if the growth does not occur, prices decline, leading to low returns for growth firms relative value firms.
The two psychological biases employed by Barberries and Huang include loss aversion and mental accounting.
Momentum is a strategy involving going long on stocks that have upward-trending returns over the past six-to-twelve months (the winners) and short on stocks with downward-trending returns over the same period (the losers).
The momentum factor refers to the tendency of winning stocks to continue performing and losing stocks to continue losing. WML is the momentum factor which stands for past winners minus past losers. It can also be called UMD, which refers to stocks that have gone up minus those that have gone down.
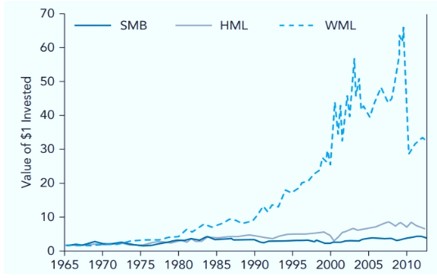
The following figure shows that the momentum returns are significantly high relative to the size and value. The cumulated returns are plotted from 1965 to 2011, for SMB, HML, and WML.
$$ \textbf{Figure 1: Returns to the HML, SMB and WML strategies} $$

Momentum is a positive feedback strategy where the stocks with high past returns are attractive. Momentum investors continue buying them, and the stocks continue going up. However, positive feedback strategies are fundamentally destabilizing and, therefore, subject to periodic crashes.
The momentum effect is used as an investment factor, and is added onto the FFM as follows:
$$ \text{E}\left( { \text{R} }_{ \text{i} } \right) ={ \text{R} }_{ \text{f} }+{ \beta }_{ \text{i,MKT} }\text{E}\left( { \text{R} }_{ \text{m} }-{ \text{R} }_{ \text{f} } \right) +{ \beta }_{ \text{i,SMB} }\text{E}\left( \text{SMB} \right) +{ \beta }_{ \text{i,HML} }\text{E}\left( \text{HML} \right) +{ \beta }_{ \text{i,WML} }\text{E}\left( \text{WML} \right) $$
As with the Fama-French model, the momentum beta, \(β_{(i,WML)}\), is centered around zero. WML is constructed so that winning stocks have positive momentum betas with their risk premiums. Loser stocks, on the other hand, have negative momentum betas, and consequently, their risk premiums are adjusted downward.
The following are the momentum risks:
According to behavioral theories, investors’ biasness in interpreting or acting on information gives rise to momentum. Good news on stock can generate momentum in two ways:
In both underreaction and overreaction causes of momentum, prices eventually revert to fundamental values in the long run.
Practice Question
John Salsborough, a fund manager, is holding a large amount of U.S. T-bills in its portfolio. In comparison, most other fund managers are attracted by value stocks and investment-grade corporate bonds.
Salsborough’s fund will most likely outperform other funds in an economic environment where there is:
A. High inflation, high economic growth, and high volatility.
B. Low inflation, high economic growth, and low volatility.
C. High inflation, low economic growth, and high volatility.
D. Low inflation, low economic growth, and low volatility.
The correct answer is C.
In times of high inflation and low economic growth, investments in government bonds will generate higher returns compared to equity investments. In other words, higher volatility increases the riskiness of equity investments.
Similarly, investment-grade corporate bonds generate a higher return when the economy is performing well. Therefore, Salsborough’s fund, which holds a large number of government bonds, will most likely outperform other funds in an economic environment where there is high inflation, low economic growth, and high volatility.