


Sources of Liquidity and Liquidity Pos ...
The degree to which a corporation can satisfy its short-term obligations using cash... Read More

Capital allocation describes the process companies use to make decisions on capital projects, i.e., projects with a lifespan of one year or more. It is a cost-benefit exercise that seeks to produce results and benefits greater than the costs of capital allocation efforts.
There are several steps involved in the capital allocation process. However, the specificity of the procedures a manager adopts depends on factors such as the manager’s position in the company, the size and complexity of the project being evaluated, and the company’s size.
The typical steps involved in the capital allocation process are:
Several essential decision criteria are used to evaluate capital investments. The two most comprehensive and well-understood measures of whether or not a project is profitable are the net present value (NPV) and the internal rate of return (IRR).
Moreover, Analysts can utilize consolidated financial statements to compute and evaluate the return on invested capital (ROIC). ROIC serves as a valuable overall return metric instead of a project-specific return measure.
The net present value (NPV) of a project is the potential change in wealth resulting from the project after accounting for the time value of money. The NPV for a project with one investment outlay made at the start of the project is defined as the present value of the future after-tax cash flows minus the investment outlay.
$$ \begin{align*}
NPV &= {CF}_0+\frac{{CF}_1}{{(1+r)}^1}+\frac{{CF}_2}{{(1+r)}^2}+\ldots+\frac{{CF}_T}{{(1+r)}^T} \\
NPV & =\sum_{t=0}^{T}\frac{{\rm CF}_t}{{(1+r)}^t}
\end{align*} $$
Where:
\({CF}_T\) = After-tax cash flow at time \(t\).
\(r\) = Required rate of return for the investment.
\({CF}_0\) = Investment cash flow at time zero.
Many projects have cash flow patterns in which outflows occur at the start of the project (at time = 0) and future dates. In these instances, a better formula to use is:
In other words, positive NPV investments increase wealth, while negative NPV investments decrease wealth.
Example: Net Present Value of a Project
Imagine Company A is thinking about investing $100 million in a project to expand its business. This project is expected to generate after-tax cash flows of $20 million yearly for the first three years and $33 million in the fourth and fifth year. If the project needs to earn at least an 8% return, what would the Net Present Value (NPV) be, and should the company go ahead with the investment?
$$ \begin{align*}
NPV & =-100+\frac{20}{{1.08}^1}+\frac{20}{{1.08}^2}+\frac{20}{{1.08}^3}+\frac{33}{{1.08}^4}+\frac{33}{{1.08}^5} \\
NPV & =-1.74 \text{ million} \end{align*} $$
The project should not be undertaken since the \(NPV \lt 0\).
The internal rate of return (IRR) is the discount rate that makes the net present value (NPV) of all cash flows from a particular project equal zero. For a project with one initial outlay, the IRR is the discount rate that makes the present value of the future after-tax cash flows equal to the investment outlay.
The IRR solves the equation:
$$ \sum_{t=0}^{T}\frac{{CF}_t}{{(1+IRR)}^t}=0 $$
It looks very much like the NPV equation except that the discount rate is the IRR instead of r, the required rate of return. Discounted at the IRR, the NPV is equal to zero.
The decision rule for the IRR is:
In instances where the outlays for a project occur at times other than time 0, a more general form of the IRR equation is:
$$ \sum_{t=0}^{T}\frac{{CF}_t}{{(1+IRR)}^t}=0 $$
Example: IRR of a project
Here is a follow-up on the above NPV example. Assume Company A is considering investing $100 million in a project to expand its business. This project is expected to generate after-tax cash flows of $20 million yearly for the first three years and $33 million in the fourth and fifth year. What is the Internal Rate of Return (IRR) for this project, and should the company go ahead with it if the required return rate is 8%?
Solve IRR in the following equation:
$$ -100+\frac{20}{\left(1+IRR\right)^1}+\frac{20}{\left(1+IRR\right)^2}+\frac{20}{\left(1+IRR\right)^3}+\frac{33}{\left(1+IRR\right)^4}+\frac{33}{\left(1+IRR\right)^5}=0 $$
The solution can be arrived at through trial and error. However, a more straightforward approach is to use a financial calculator using the following steps:
Step 1: Entering the Initial Cash Outlay
Press the Cash Flow [CF] key to open the cash flow register. The calculator should read CF0=, which tells you to enter the cash flow for time 0. Since you need to send cash out of the company to make the initial $100 investment, this value has to be negative. Type in -100 for CF0, and hit the [ENTER] key.
Step 2: Entering the Cash Inflows
Next, enter the cash flow values for the subsequent periods. This is done by hitting the down arrow once. The calculator should read CF1=. Type in the first cash flow amount, 20, and hit [ENTER]. The calculator should now say C01=20.
To enter cash flow from Year 2, hit the down arrow twice. The calculator should read CF2=. If it says F1=, hit the down arrow one more time.
Type in the second year’s cash flow, 20, and hit [Enter]. The calculator should read CF2=20. Hit the down arrow twice again and do the same thing for the third cash flow period, CF3.
Do this for the forth year 33 and the fifth year 33. i.e. C04 = 33 and C04 = 33.
Step 3: Calculating the IRR
Once the cash flow values have been fed into the calculator, you can calculate the IRR.
To do this, press the [IRR] key. The screen will read IRR=0.000. To display the IRR value for the data set, press the [CPT] key at the top left corner of the calculator. If you have followed this process correctly, the calculator will display the correct IRR. The IRR is computed to be 7.4%%. The project should not be undertaken since \(7.4\% \lt 8\%\).
Simply computing a project’s NPV and IRR to determine which of several projects to undertake is not always as straightforward as it seems. The IRR and NPV can produce different ranking outcomes whenever mutually exclusive projects are involved. Other challenges may occur.
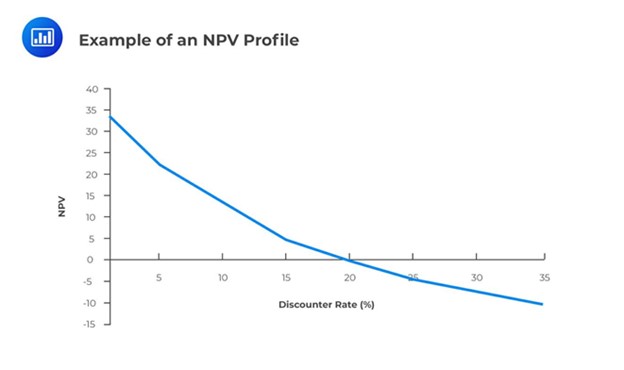
The NPV Profile illustrates a project’s NPV graphed as a function of various discount rates. The NPV values are graphed on the vertical or y-axis, while the discount rates are graphed on the horizontal or x-axis.
For independent, conventional projects, the NPV and IRR decision rules will draw the same conclusion on whether to invest. However, in the case of two mutually exclusive projects, sometimes the decision rules will draw different conclusions. For example, project X might have a more significant NPV than Project Y, but Project Y might have a larger IRR. This conflict usually stems from differences in the two projects’ cash flows, leading to a different ranking between the NPV and IRR. Whenever this conflict arises, the NPV, not the IRR, should be used to select which project to invest in.
Another circumstance that may cause mutually exclusive projects to be ranked differently according to NPV and IRR criteria is the scale or size of the project.
Although rare, a project can have more than one IRR or no IRR at all. Multiple IRRs, however, cannot occur for conventional projects with outlay followed by cash inflows. Still, they may occur for non-conventional projects with cash flows that change signs (negative, positive) more than once during the project’s life.
The net present value (NPV) and the internal rate of return (IRR) are both techniques that financial institutions or individuals can use when making major investment decisions. Each method has its strengths and weaknesses. However, the net present value method comes out on top, and here’s why. NPV and IRR yield the same investment decisions when dealing with independent projects. By independent, we mean that deciding to invest in one project does not rule out or affect investment in the other.
However, the challenge comes when the projects are mutually exclusive. If two or more projects are mutually exclusive, the decision to invest in one project precludes investment in all the others. With such projects, the IRR method may provide misleading results if used in isolation.
As seen, there are some problems associated with the IRR method:
Return on capital invested (ROIC), also known as return on capital employed (ROCE), measures the profitability of total capital invested by management.
The formula is as follows.
$$ \begin{align*}
ROIC & =\frac{{\text{After-tax operating profit}}_t}{\text{Average invested capital}} \\ & =\frac{\left(1-\text{Tax rate}\right)\times{\text{Operating profit}}_t}{{\text{Average total Long Term liabilities and equity}}_{t-1,l}}
\end{align*} $$
Working capital is not included in the total capital investment. Invested capital includes long-term liabilities and equity.
Benefits of ROIC
The link between ROIC is as follows:
$$ \begin{align*}
ROIC & =\frac{\text{After-tax operating profit}_t}{\text{Average invested capital}} \\ & =\frac{{\text{After-tax operating profit}}_t}{\text{Sales}}\times\frac{\text{Sales}}{\text{Average invested capital}} \\ &=\text{After-tax operating margin}\times \text{Capital turnover} \end{align*} $$
Therefore, two factors that influence ROIC are profit margin and turnover. This implies that a company with a high margin can have a low ROIC if the turnover is low and vice versa.
Example: Calculating ROIC
Consider the following excerpt of the balance sheet information of a company:
$$ \begin{array}{l|r|r}
\textbf{Liabilities and Equity} & \bf{20X1} & \bf{20X2} \\ \hline
\text{Accounts payable} & 37,500 & 52,800 \\ \hline
\text{Short-term debt} & 22,000 & 6,500 \\ \hline
\text{Long-term debt} & 113,000 & 107,500 \\ \hline
\text{Share capital} & 16,000 & 16,000 \\ \hline
\text{Retained earnings} & 150,000 & 162,500 \\ \hline
\text{Total liabilities and equity} & 338,500 & 345,300
\end{array} $$
If the company reported an operating profit in year 20X2 of 30,500, the ROIC for the year 20X2 if the tax rate is 30% is closest to:
$$ \begin{align*}
ROIC & =\frac{{\text{After-tax operating profit}}_t}{\text{Average invested capital}} \\ & =\frac{\left(1-\text{Tax rate}\right)\times{\text{Operating profit}}_t}{{\text{Average total Long Term liabilities and equity}}_{t-1,l}}
\\& =\frac{\left(1-0.3\right)\times30,500}{\frac{(113,000+16,000+150,000)+(107,500+16,000+162,500)}{2}}=0.07557\approx7.56\% \end{align*} $$
Question 1
You have been provided with the following cash flows for a capital project:
$$ \begin{array}{c|c|c|c|c|c|c}
\text{Year} & 0 & 1 & 2 & 3 & 4 & 5 \\ \hline
{\text{Cash flow } (\$)} & -50,000 & 10,000 & 10,000 & 15,000 & 15,000 & 15,000
\end{array} $$Given a required rate of return of 8 percent, the NPV and IRR of the project are closest to:
- NPV: $1,023; IRR: 10.64%.
- NPV: $974; IRR: 8.68%.
- NPV: $2,400; IRR: 7.12%.
Solution
The correct answer is B.
$$ \begin{align*}
NPV &=-50,000+\frac{10,000}{{1.08}^1}+\frac{10,000}{{1.08}^2}+\frac{15,000}{{1.08}^3}+\frac{15,000}{{1.08}^4}+\frac{15,000}{{1.08}^5} \\
NPV & =-50,000+9259.26+8573.39+11,907.48+11,025.45 \\ & +10,208.75 \\ &=\$974.33 \text{ million}
\end{align*} $$Question 2
In an NPV profile, the point at which the profile crosses the x-axis is best described as:
- The project’s IRR.
- The point at which the NPV is highest.
- The point at which the discount rate = 0% and the NPV is the sum of the undiscounted cash flows for the project.
Solution
The correct answer is A.
At the horizontal axis, the NPV = 0, and by definition, this occurs whenever the discount rate is the IRR.
Question 3
Suppose you have three independent projects – X, Y, and Z. Assume the hurdle rate is 12% for all three projects. Their NPVs and IRRs are shown below.
$$ \begin{array}{c|c|c|c}
& \text{Project X} & \text{Project Y} & \text{Project Z} \\ \hline
\text{NPV} & \$20,000 & \$21,400 & \$23,000 \\ \hline
\text{IRR} & 20\% & 32\% & 18\%
\end{array} $$Assuming the projects are mutually exclusive, which of the following is the most economically feasible project?
- Z
- X
- Y
Solution
The correct answer is A.
$$ \begin{array}{c|c|c|c}
& \text{Project X} & \text{Project Y} & \text{Project Z} \\ \hline
\text{NPV} & \$20,000 & \$21,400 & \$23,000 \\ \hline
\text{IRR} & 20\% & 32\% & 18\% \\ \hline
\text{Decision} & \text{Accept} & \text{Accept} & \text{Accept}
\end{array} $$If the IRR criteria is used, all three projects would be accepted because they would all increase shareholders’ wealth. Their NPVs are all positive, and the three are all acceptable.
However, only one would be chosen if the projects are mutually exclusive. If one were to pick one project based on internal rates of return of the projects, one would go for Y. This is because its IRR is the highest compared to the other projects.
This decision would be wrong when we consider the sizes of the NPVs of the projects. While Y has the highest IRR, its NPV is lower than Z’s. The best decision would be to go for the project with the highest NPV, and that is project Z. Therefore, if projects are mutually exclusive, the NPV method should be applied.
Strengthen your ability to evaluate capital budgeting, dividend policy, and value creation with structured CFA Level I practice.


Get Ahead on Your Study Prep This Cyber Monday! Save 35% on all CFA® and FRM® Unlimited Packages. Use code CYBERMONDAY at checkout. Offer ends Dec 1st.