


CFA Exam Prep Resources: Useful Links ...
Welcome! You’re here because you’re serious about your CFA journey. Whether you’re just... Read More

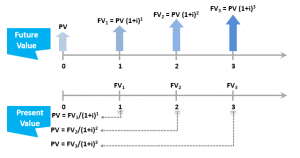
A timeline is an physical illustration of the amount and the timing of cash flows associated with an investment project.
Some of the applications of a timeline include:
The time value of money (TVM) is used in calculation of Future Values and Present values of investments, annuities, perpetuities, retirement planning, and mortgage payments. The time value of money (TVM) is based on the concept that money you have now is worth more than the identical sum in the future due to its potential earning capacity.
An illustration of a timeline of future values and present values is as follows:
Capital budgeting in corporate finance involves analyzing the concepts of net present value (NPV) and internal rate of return (IRR). We use NPV and IRR in determining the right project (in case of a single project) or the correct sequence of projects (in case of multiple projects) using NPV and IRR.
NPV and IRR help us in selecting the best possible project. For instance, when we have multiple projects, we will sort the various NPVs in descending order, such that we select the project with the highest positive NPV.
Note: we reject a project with a negative NPV.
We calculate the Net Present Value (NPV) using the formulae given below:
$$\begin{align*}NPV=&\sum_{t=1}^n\frac{CF_t}{(1-r)^t}-Outlay\end{align*}$$
Where,
\(CF_t\)= after-tax cash flow at time t
\(r\)= required rate of return for the investment
\(Outlay\)= Initial Investment Cashflow
Assuming Company XYZ is considering investing in a four-year project characterized with an initial investment of $100, an annual after-tax operating cash flows of $20 and a terminal after-tax operating cash flow of $33 at a required rate of return on 8%. Determine whether the project is worth investing in.
We know that,
$$\begin{align*}NPV=&\sum_{t=1}^n\frac{CF_t}{(1-r)^t}-Outlay\end{align*}$$
Thus,
$$\begin{align*}{NPV}=&\frac{20}{1.08^1}+\frac{20}{1.08^2}+\frac{20}{1.08^3}+\frac{33}{1.08^4}-100\\=&18.519+17.147+15.1877+24.256-100\\=&-$24.201 million\end{align*}$$
We realize that the NPV of this project is negative; therefore, we reject it.
A timeline can be used to illustrate this calculation, as shown below:
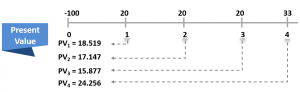
The timeline implies that at year zero, we have a cash outflow of $100 (the initial investment), while at year one, two, three, and four, we have a cash inflow of $20, $20, $20, $33, respectively.
Also, we can calculate the IRR using excel, where;
$$-100+\frac{20}{(1+IRR)^1}+\frac{20}{(1+IRR)^2}+\frac{20}{(1+IRR)^3}+\frac{33}{(1+IRR)^4}=0:IRR=-2.62\%$$
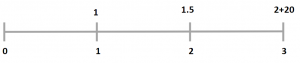
An equity valuation involves using the dividend discount model, the free cash flow model, and the residual income model to value a stock. These models rely on discounting the cash flows. The method of computing the equity valuation remains the same despite determining the different cash flows that change in the different models. After determining what these cash flows are, you will put them on a timeline and then discounted them back to time zero. The application of the timeline is the same across all three models.
By applying the timeline we see that;
Where;
$$\begin{align*}V_0&=\frac{1.0}{1.1}+\frac{1.5}{1.1^2}+\frac{(2.0+20)}{1.1^3}\\&= 18.67\end{align*}$$
According to this calculation, the stock should be valued at €18.67; thus, if in the market, the value is higher than €18.67, then we should not buy that stock because it is overvalued. However, if the stock market value is less than €18.67, it means that it is undervalued, and we should go ahead and buy that stock.
Bond valuation is a method used to determine the theoretical fair value of a particular bond. It involves calculating the present value of a bond’s expected future coupon payments, or cash flow, and the bond’s value upon maturity, or face value.
Regardless of the type of bond we are dealing with, the valuation occurs in the timeline only. The bond valuation is similar to equity valuation, only that we take the coupons as the cashflow.
The timeline below illustrate bond valuation:
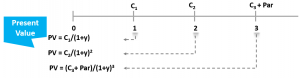
Where:
\(C\)= Coupon on the bond, i.e., what the issuer is giving
\(Y\)= Yield to Maturity (YTM), i.e., minimum rate that we require, given the risk
The value of the bond depends on the relationship between the Coupon of the bond (C) and Yield to Maturity (Y), where:
The different types of derivative pricing and valuation include:
All of these types are valued using the timeline. However, the complexity could increase when dealing with options and swaps, but the fundamental mathematical concept is the timeline of discounted cashflows.
Assuming that:
What is the correct forward price?
Applying the timeline we have:
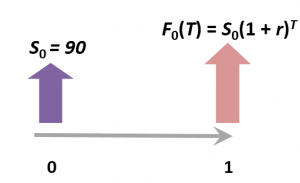
Therefore, Forward Pricing Equation is given as:
$$\begin{align*}{F_0(T)}=&{S_0(1+r)^t}\end{align*}$$
Where:
\(F_0(T)\)= Forward pricing
\(s_0\)= spot price
\(t\)= time
\(r\)= risk-free rate
Thus,
$$\begin{align*}=&90(1+0.04)^1\\=&93.6 \text{dollars}\end{align*}$$
Master timelines and calculations for CFA and FRM exams with our study notes, practice questions, and mock exams.
Offered by AnalystPrep
Welcome! You’re here because you’re serious about your CFA journey. Whether you’re just... Read More

Evolution of Portfolio Theory In theory, we could form a portfolio made up... Read More
Get Ahead on Your Study Prep This Cyber Monday! Save 35% on all CFA® and FRM® Unlimited Packages. Use code CYBERMONDAY at checkout. Offer ends Dec 1st.
