


Five Reasons Why You Should Pursue A C ...
Financial certifications are a great way to enhance your C.V and help you... Read More

You rarely get to measure an entire population.
You estimate.
But how much trust should you place in that estimate?
That question sits at the heart of statistical inference. And the tool we use to answer it is called a confidence interval.
Whether you are analyzing investment returns, interpreting survey data or preparing for the CFA® or FRM® exam, confidence intervals help you quantify uncertainty instead of ignoring it. This article will walk you through the definition, formula, step-by-step calculation, interpretation, visual intuition and exam relevance in one place.
Let’s build this properly.
A confidence interval is an interval computed from sample data using a procedure that, in repeated sampling, contains the true population parameter, a stated proportion of the time (for example, 95%).
That population parameter could be:
You do not usually observe the entire population. Instead, you take a sample and calculate a sample statistic such as the sample mean.
But that sample mean is only an estimate. If you drew a different sample, you would likely get a slightly different value. That natural variation comes from sampling variability.
This is where the sampling distribution enters the picture.
When you repeatedly draw samples of the same size and compute the sample mean each time, those sample means form a sampling distribution. For the sample mean, that sampling distribution is centered at the true population mean and it has a standard deviation called the standard error.
The standard error measures how much the sample mean tends to fluctuate from sample to sample.
The larger the sample size, the smaller the standard error. That is why bigger samples give tighter estimates.
A confidence interval combines:
The result is a range that says, in effect:
“Here is my best estimate and here is the margin of error around it.”
That margin of error is simply: Critical value × Standard error.
This is statistical inference in action. You move from a sample to a statement about the broader population parameter.
This is where most people get confused.
Let’s clear it up properly.
What 95 Percent Confidence Actually Means
Suppose you calculate a 95% confidence interval for a population mean.
It does not mean there is a 95% probability that the true parameter lies inside your specific interval.
Once the interval is calculated, the population parameter is either inside it or it is not. There is no probability attached to that fixed truth.
Instead, the 95% refers to the method.
If you repeated the sampling process over and over using the same sample size and procedure, about 95% of the confidence intervals you construct would contain the true population parameter.
It is a long-run frequency statement.
That is the core idea behind frequentist statistics.
What It Does Not Mean
It does NOT mean:
It simply reflects how reliable your procedure is across many repetitions.
Quick Interpretation Summary
A 95% confidence interval means that if we repeatedly sampled from the same population and constructed intervals in the same way, about 95% of those intervals would contain the true population parameter. It does not assign a probability to the parameter itself.
If you understand this clearly, you are already ahead of many exam candidates and even many professionals.
For a confidence interval for a population mean, if the population standard deviation (sigma) is known and the sampling distribution of the mean is normal (or the sample size is large enough for a normal approximation), the formula is:
Let’s break this down carefully.
is the sample mean
is the population standard deviation
is the sample size
is the critical value from the standard normal distribution
is the standard error
The standard error measures the variability of the sampling distribution of the mean.
The critical value is determined by the confidence level.
Common z-scores:
The margin of error equals: z × Standard error
The confidence interval is: Sample mean ± Margin of error
You can see the structure clearly. The sample mean sits at the center. The margin of error determines how wide the interval is.
Figure 1: 95% Confidence Interval Under Normal Distribution
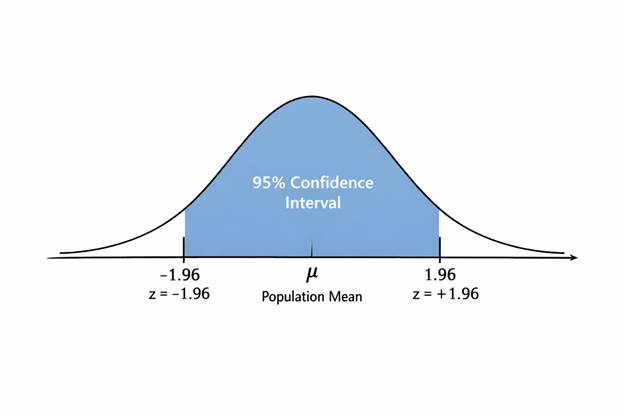
This visual reinforces that the confidence level corresponds to area under the normal curve.
Let’s calculate one properly.
Suppose:
Step 1: Identify the Sample Mean
= 50
Step 2: Identify the Standard Deviation
= 10
Step 3: Choose the Confidence Level
95%
Step 4: Find the Critical Value
For 95%, z = 1.96
Step 5: Compute the Standard Error
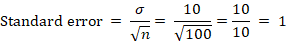
Step 6: Compute the Margin of Error
Step 7: Construct the Interval


Final answer:
Interpretation
Using this method, if we repeatedly drew samples of size 100 from the same population and built intervals in the same way, about 95% of those intervals would contain the true population mean. This particular interval is [48.04, 51.96].
Sample mean = 75
Population standard deviation = 8
Sample size = 64
Confidence level = 95%
The answer should be: [73.04, 76.96]
This mirrors what an online confidence interval calculator would produce but now you understand every step behind it.
So far, we assumed the population standard deviation is known. That is rare in most circumstances.
When the population standard deviation is unknown, we estimate it using the sample standard deviation s. In that case, we use the t-distribution.
The formula becomes:
The t-distribution:
When do we use z- and t-critical values?
Use a critical value when:
The population standard deviation (sigma) is known, and the sampling distribution of the mean is normal (or a normal approximation is appropriate)
Use a critical value when:
The population standard deviation is unknown and you replace it with the sample standard deviation (s), using degrees of freedom n minus 1
As the sample size increases, the t distribution approaches the normal distribution, so and
critical values become very similar for large samples.
Most examples you see are two-sided confidence intervals.
They look like:
This produces both an upper and lower bound.
A one-sided confidence interval provides only:
Example:
We are 95% confident the true mean return is at least 6%.
In this case, the critical value is different because all the confidence level is placed in one tail of the distribution.
For a 95% one-sided interval, the z critical value is 1.645 (because all of alpha is in one tail). If you are using the distribution, the one-sided critical value depends on the degrees of freedom,
.
CFA exam questions sometimes test this depth. If a question asks for an upper bound only, that signals a one-sided interval.
Understanding this prevents costly mistakes.
Confidence intervals and hypothesis testing are deeply connected.
Suppose you conduct a two-sided hypothesis test at α = 0.05.
That corresponds to a 95% confidence level.
If the null hypothesis value lies outside the 95% confidence interval, you reject the null hypothesis at the 5% significance level.
If it lies inside, you fail to reject.
So:
This relationship is heavily tested in quantitative methods section of the CFA and FRM exams.
Hypothesis testing gives you a yes or no decision.
Confidence intervals give you a range estimate.
Both rely on:
Understanding their connection strengthens your statistical reasoning.
Figure 2: Confidence Interval Formula Components
CI = x̄ ± z (σ / √n)
Where:
x̄ = sample mean
z = critical value
σ = population standard deviation
n = sample size
σ / √n = standard error
Seeing the formula labeled like this improves retention and time on page.
This is where the generic math sites stop and we begin.
In CFA Level I Quantitative Methods and FRM Part I Quantitative Analysis, confidence intervals are tested in several ways.
Common Exam Appearances
Typical Traps
Candidates often memorize formulas but fail interpretation questions.
For example:
“Which of the following statements correctly interprets a 95% confidence interval?”
The correct answer will reference repeated sampling and long-run frequency.
If you want deeper mastery, reviewing Quantitative Methods notes and hypothesis testing frameworks is essential. Confidence intervals rarely appear in isolation.
Even professionals make these errors.
Mistake 1: Thinking 95% Means 95% Probability
This is the most common misunderstanding. Probability applies to the method, not the parameter.
Mistake 2: Confusing Population and Sample
The interval estimates a population parameter, not the sample statistic.
Mistake 3: Using the Wrong Distribution
Choosing z instead of t when population standard deviation is unknown.
Mistake 4: Misinterpreting Overlapping Intervals
Two overlapping confidence intervals do not automatically imply no significant difference.
Mistake 5: Ignoring Assumptions
Confidence intervals rely on:
Ignoring assumptions weakens conclusions.
Confidence intervals appear everywhere.
In Finance
An analyst estimates average annual return of a fund as 8% with a 95% confidence interval of [6.5%, 9.5%].
That range reflects estimation uncertainty and risk.
In Business
A company estimates customer satisfaction score at 4.3 with a margin of error of 0.2.
That margin of error directly informs decision-making.
In Healthcare
A vaccine effectiveness estimate of 92% with interval [88%, 95%] communicates precision and reliability.
These are not academic exercises. They influence policy, capital allocation and strategy.
At its core, statistical inference is about making decisions under uncertainty.
Confidence intervals quantify that uncertainty.
They incorporate:
They transform a single point estimate into an informative range.
Instead of pretending precision, they acknowledge reality.
And that is powerful.
Confidence intervals are more than a formula. They are a disciplined way of expressing uncertainty.
They connect sampling distribution, standard error, critical value and confidence level into one coherent framework.
If you understand:
Then you are not just memorizing statistics. You are thinking statistically.
That shift is what separates average candidates from high scorers.
Confidence intervals may look simple on the surface. But once you truly understand them, they become one of the most powerful tools in quantitative analysis.
And if you can explain what 95% really means without hesitation, you are already ahead of most people searching for this topic.
Confidence intervals are not just theoretical constructs tucked away in a Quantitative Methods chapter. They are examinable, practical and often decisive in determining whether you walk out of the CFA Level I exam confident or uncertain. Understanding the mechanics is important but applying them accurately under exam pressure is what truly separates strong candidates from the rest.
If your goal is not merely to recognise formulas but to internalise when and how to use them, structured practice becomes essential.
That is where AnalystPrep’s comprehensive CFA preparation resources come in. We have designed the platform to reinforce conceptual clarity and exam readiness. We provide:
Whether you are beginning your Quantitative Methods preparation or refining your understanding ahead of exam day, AnalystPrep’s CFA packages are built to support every stage of your preparation journey.
Explore the full range of CFA study resources and strengthen your command of confidence intervals and every other examinable topic with preparation designed for serious candidates.
Build confidence in confidence intervals with structured practice and exam-level questions.
Offered by AnalystPrep
Financial certifications are a great way to enhance your C.V and help you... Read More
Exam Postponements in 2020 In 2020, Coronavirus disrupted the normal functioning of the... Read More

Get Ahead on Your Study Prep This Cyber Monday! Save 35% on all CFA® and FRM® Unlimited Packages. Use code CYBERMONDAY at checkout. Offer ends Dec 1st.

