


Default Probability, Credit Spreads an ...
For credit valuation adjustments (CVA) and debt valuation adjustments (DVA) in the qualification... Read More

After completing this reading, you should be able to:
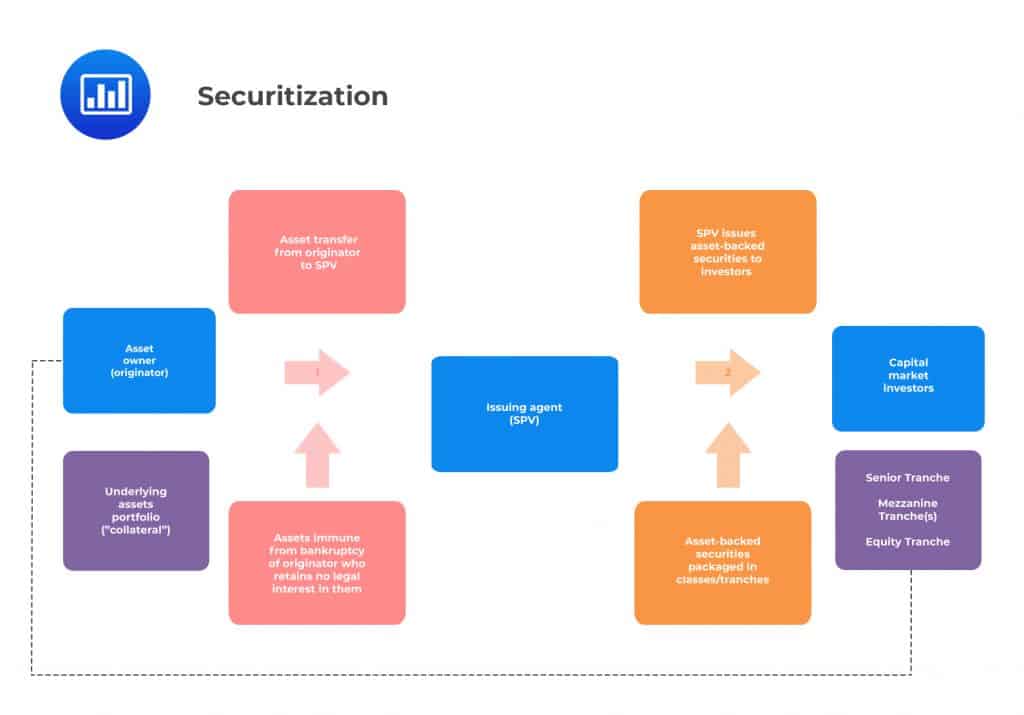
Securitization can broadly be defined as the sale of assets, which generate cash flows, from the institution that owns them to another company that has been specifically set up for the purpose, and the issuing of notes by this second company. These notes are backed by cash flows from the original assets sold.
 Securitization is a perfect example of innovation in financial markets. It allows institutions to convert assets that are not readily marketable into rated securities that are tradable in the secondary market. Such securities include residential mortgages, credit card receivables, or car loans. Further, securitization offers investors an opportunity to gain exposure to assets that would otherwise be impossible to access.
Securitization results in the creation of asset-backed bonds. These are debt instruments formed after pooling loan assets on which interest is payable, either on a fixed or floating basis. It is these interest payments that service the new bond issue. It is general market practice to use the terms mortgage-backed securities to refer to bonds backed by mortgages, and asset-backed securities to refer to bonds backed by a range of other assets such as credit card receivables.
There are various reasons why a stakeholder in the financial market may get involved in securitization. We start with financial institutions.
Securitization helps banks to diversify their funding mix and reduce the cost of funding. Banks usually rely on a mix of retail, interbank, and wholesale funding avenues. No single bank wants to be too reliant on a single or a few sources of funding because such a situation exposes the bank to high risk in times of market turmoil. But how exactly does securitization help reduce funding costs?
The securitization process results in distinct credit ratings for the originating bank and the credit rating of the entity set up to issue notes. It de-links the credit ratings of the two. The entity set up to issue notes to investors (SPV/SIV/trust) is often bankruptcy-remote but may also retain emergency credit support lines to the originating bank. For this reason, the entity enjoys a credit rating that’s superior to that of the originating bank.
As such, most of the notes issued by SPVs will have a higher rating than bonds issued directly by the originating bank. That means that investors in notes will be prepared to accept a return that’s a bit lower than they otherwise would if the bank were to issue securities directly. In practice, the secondary ABS market tends to be less liquid compared to the corporate bond market, and investors often incorporate a premium for that. However, to the originating institution, the cost of issuing debt is still lower in the ABS market because of the SPV’s higher rating.
Securitization also helps to eliminate the issue of maturity mismatches. Banks fund long-term assets such as residential mortgages with short-term liabilities such as customer deposits and repo funds from fellow banks. Securitization sorts this out because the originating bank receives funding from the sale of the assets, and the economic maturity of the issued notes almost always matches that of the assets.
Under Basel rules, banks must maintain a minimum capital level for their assets, in relation to the risk of these assets. An SPV is not subject to these rules and needs only such capital as is economically required based on the nature of the assets it contains.
Originating banks cannot obtain 100% regulatory capital relief when they transfer assets off the balance sheet onto an SPV. That’s because to reduce conflict of interest, investors will often demand that a bank retains a ‘first-loss’ piece out of the issued notes. However, their regulatory capital charge reduces significantly after the securitization.
Reducing the amount of capital that has to be used to support the asset pool via securitization can also help a bank to improve its return-on-equity (ROE) value. Such an improvement is generally received warmly by shareholders.
Once an originating bank has securitized assets, its credit risk exposure on those assets is reduced considerably. If the bank ends up not retaining a ‘first-loss’ piece out of the issued notes, then the exposure is removed entirely.
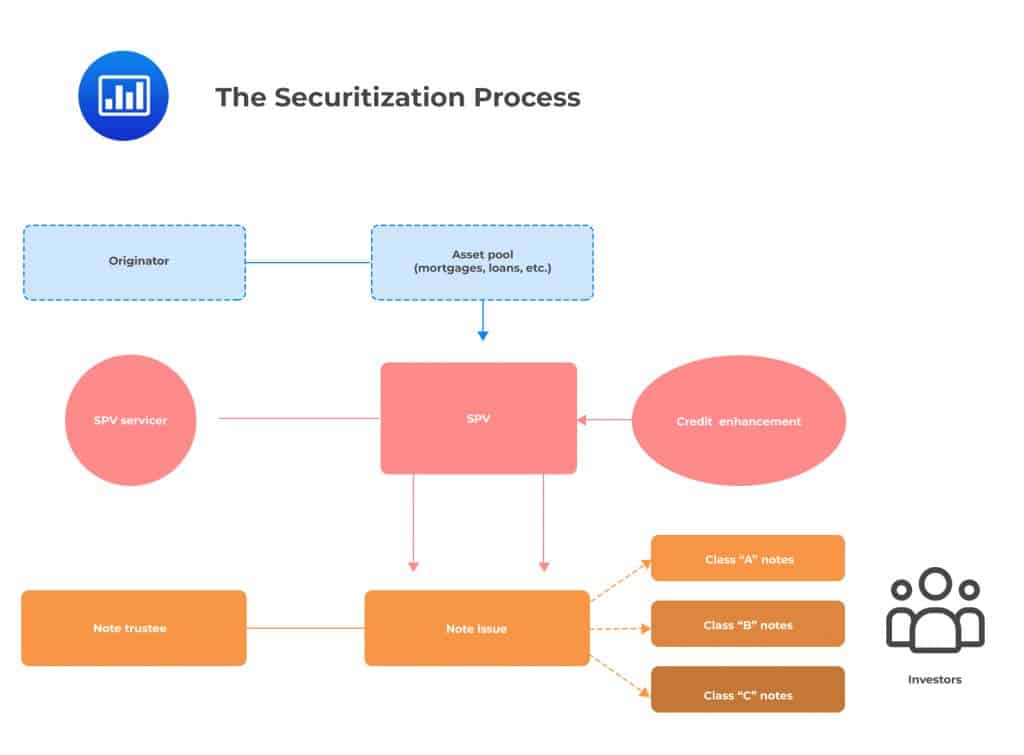
A number of participants are involved in the securitization process. In most cases, the process begins with the originator. This is the institution that owns the pool of assets such as mortgages, auto loans, or receivables that it wishes to repackage and sell. An issuer will then acquire these assets.
The issuer is often a firm specially set up to facilitate the securitization process. It is usually set up as an SPV that is domiciled offshore. For the sale to be considered a “true sale,” the issuer must have a legal identity that is distinct from the originator. The assets being securitized permanently shift from the originator’s balance sheet to that of the SPV. The SPV is set up such that it is bankruptcy-remote, meaning that the underlying asset pool is held separately from the other assets of the originator. In effect, the SPV and its assets are protected from insolvency or bankruptcy of the originator. In other words, the originator’s credit rating and financial status become almost irrelevant to the bondholders when assets are held within an SPV framework.
To further boost the credit quality of the SPV, the process of securitization often involves credit enhancements. The term refers to methods used to improve the credit profile of the SPV to make the securitized assets on sale more marketable. One form of credit enhancement occurs in the form of a third-party guarantee of performance. Notes issued by an SPV that has obtained a third-party guarantee are often rated at investment grade and up to AAA-grade.
To ensure that the originator secures lower-cost funding, any securitization structure is set up such that the liability side of the SPV – the issued notes – carries a lower cost than the asset side of the SPV. In other words, the compensation paid to investors will be less than the total inflow from the underlying pool of assets. That way, the originator is able to lock in cheaper funding that it would struggle to obtain in the unsecured market. This can especially be beneficial to originators with lower credit ratings.
When choosing the location of an SPV, originators look at factors such as taxation, operating costs, legal requirements, and investor considerations. Taxation is particularly a significant factor because SPVs are subject to different tax treatments in different countries. To secure favorable tax treatment, most originators set up SPVs either in areas that have set up SPV-friendly business legislation such as Dublin or the Netherlands or in offshore business centers such as Jersey or the Cayman Islands. In these jurisdictions, all cash flows, both received and paid out by the SPV, attract low or no tax.
An SPV may be designated as a corporation or a trust. A common characteristic of trusts and corporations is that they are created by law to allow people to accomplish business or personal goals. They have the authority to act like a “legal person” to safeguard the interests of the principal – in this case, bondholders. An SPV set up as a corporation implies that the bondholder is represented by directors who have the authority to bind the SPV by signing contracts. In an SPV set up as a trust, bondholders are represented by trustees who have pretty much the same roles as directors.
In the U.S, accounting regulations allow SPVs to be set up only as trusts and not as corporations because only the latter is deemed to establish sufficient ring-fencing of the SPV from the originator. The trustee is the agency services department of a bank such as Citibank, or a specialist Trust company such as Wilmington Trust. In Europe, accounting regulations allow SPVs to be structured as corporations.
The underwriter, sometimes known as the structuring agent, is the financial engineer behind the securitization structure. The underwriter is often, but not always, a large financial intermediary. Typically, the underwriter aggregates the underlying loans and designs the securitization structure, including things such as coupon rates, tranche sizes, and triggers. In some cases, the underwriter may also be the originator as the two roles have a natural overlap.
The underwriter bears warehousing risk, the risk that the deal will not be completed and consequently, the value of the accumulated collateral still on its balance sheet will fall.
Rating agencies help investors to assess the riskiness of an investment by assigning credit ratings to various tranches engineered. Attachment points and the subordination structure are key cogs in the rating process. When companies are planning to issue a non-securitized bond, rating agencies have little influence over creditworthiness and are not involved in the structuring process. When issuing securitizations, however, rating agencies are usually more engaged in the structuring process and do more than just opining on creditworthiness.
Although the ratings under a securitization structure may be based entirely on the credit quality of the pool and the liability structure, they may also reflect any third-party guarantees typically provided by monoline insurance companies. As mentioned before, the third-party guarantees timely repayment of bond principal and interest in exchange for insurance premiums.
The servicer, sometimes called the custodian, collects principal and interest from the loans in the collateral pool and disburses the same to the liability holders. At the same time, the servicer disburses fees to the underwriter and itself. Servicers may also be actively involved in the monitoring of the collateral pool. If a loan in a pool is in distress, for example, the servicer may have the authority to evaluate possible options, including extending the term of the loan or foreclosing.
 Main SPV Structures
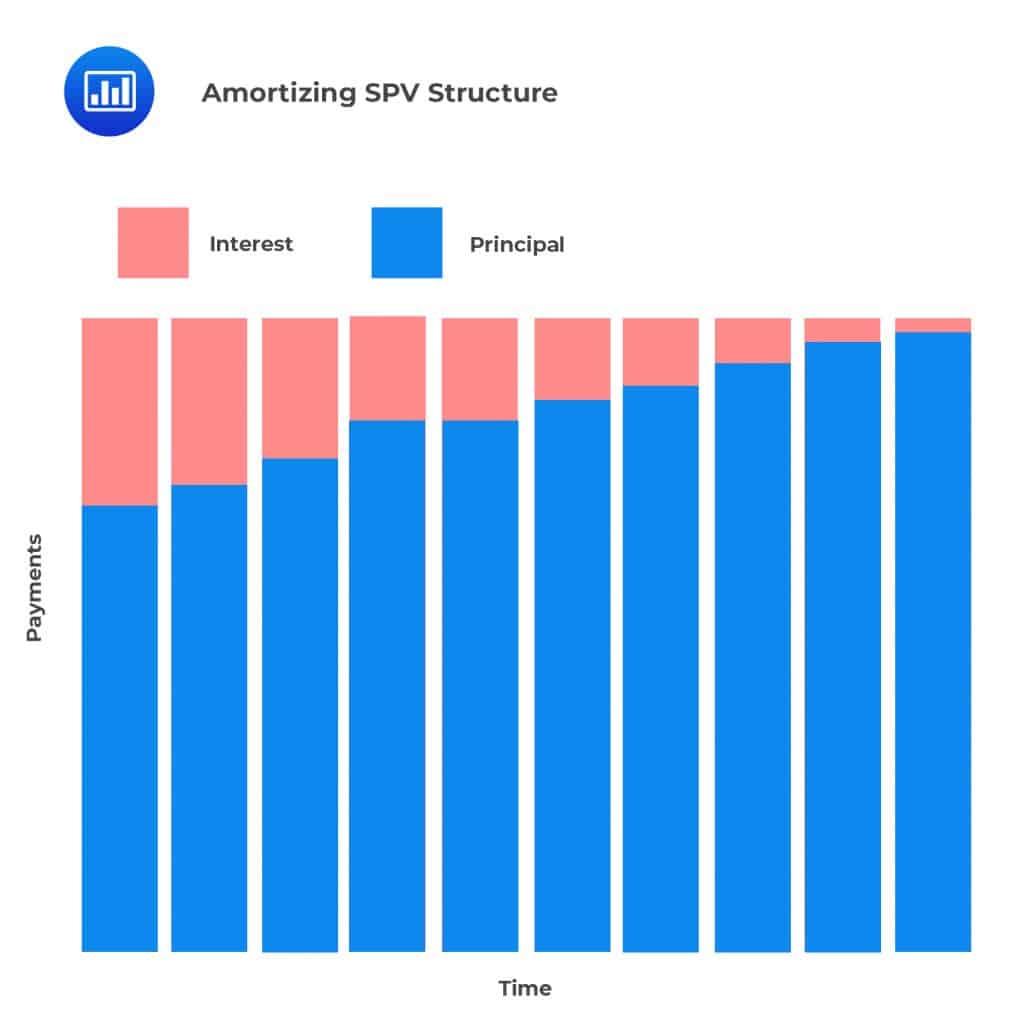
In an amortizing structure, an amortization schedule is adopted, where investors receive principal and interest payments over the life of a product. Amortizing structures are common when cash flows from the underlying pool of assets also follow an amortization schedule, e.g. residential mortgages, consumer loans, and commercial mortgages.
Amortized structures, also called pass-through structures, are priced and traded based on expected maturity and weighted-average life (WAL) – the time-weighted period during which the principal is outstanding. As expected, a WAL approach has to take the prepayment rate which has the potential to increase or decrease the rate at which investors receive the principal into account.
 Revolving Structures
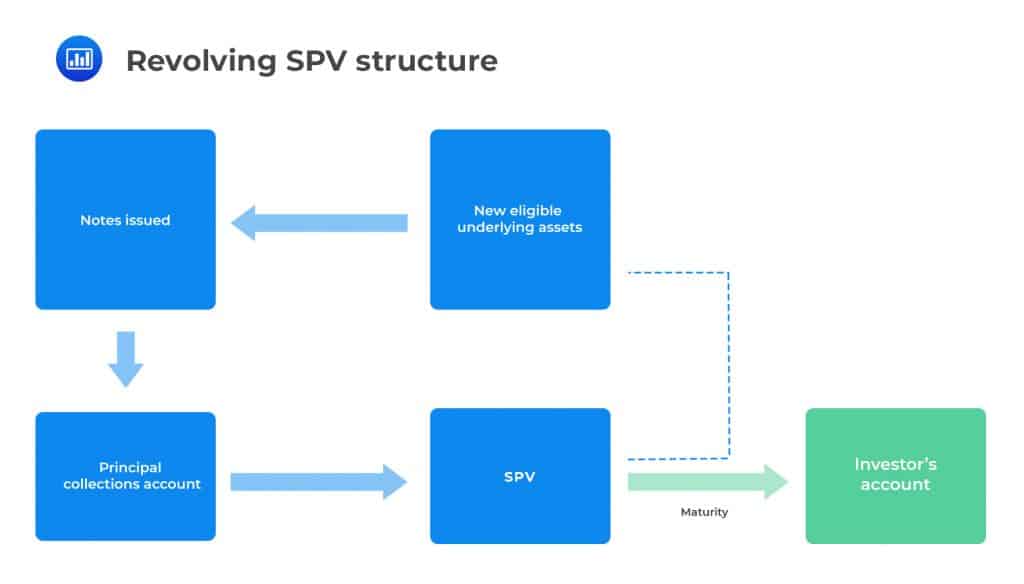
In a revolving structure, the principal collections are plowed back into the SPV to finance the purchase of new assets that fulfill the necessary criteria (as opposed to being used to repay the investor). This type is typically adopted when the accounts included in the securitization pool have balances that grow or decline over the life of the ABS. Accounts that exhibit this characteristic are often built upon short-dated assets such as credit card receivables and auto loans.
The revolving period usually terminates prior to the maturity of the ABS after which principal payments are repaid in an amortizing manner. In some structures, the principal may also be paid as a lump sum.
 Master Trust
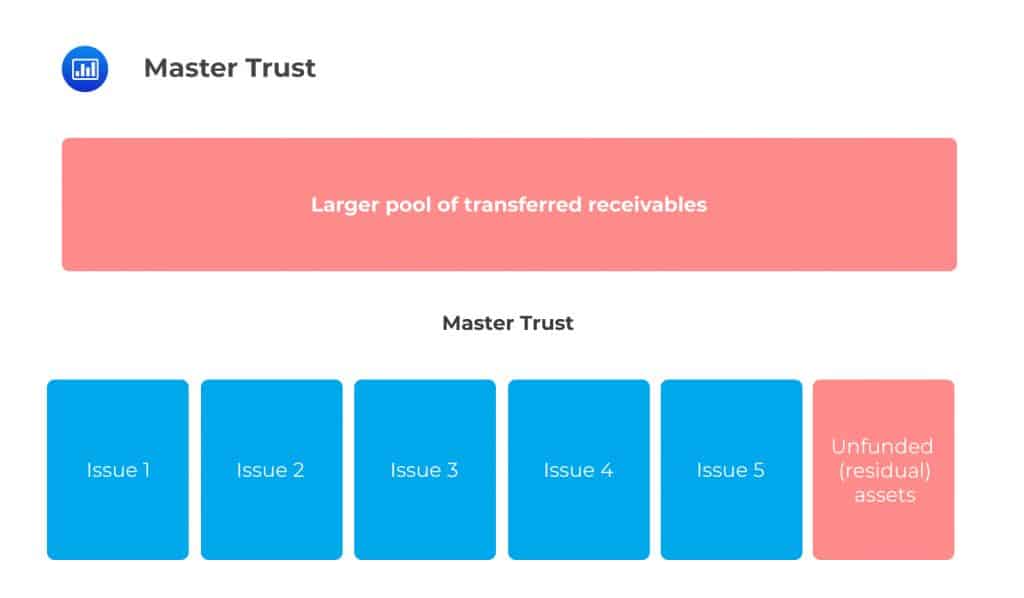
In a master trust, the originator sets up a large fund in which they transfer a huge chunk of receivables, much larger than the size of the funding raised from investors.
From this larger fund, the originator can then create multiple notes issuances simultaneously or successively such that at a given point in time, the sum of all issues, plus any residuals held in the larger fund, equals the assets initially transferred to the larger fund. At any point in time, the amount of notes issued to investors is much smaller than the size of assets in the pool. In this structure, the originator may hold a residual amount of assets until maturity or until an investor is found. In other words, notes are issued out of the pool based on investor demand.
The master trust acts as some sort of a going concern to which the originator keeps channeling assets and holds a seller share, i.e., a portion of the assets not funded (taken up by investors).
 Over-collateralization, First-loss Piece, Equity Piece, and Cash Waterfall Within the Securitization Process
A cash waterfall structure is an obligation settlement mechanism whereby all the cash that is generated by the asset pool is paid in order of payment priority. Lower-tiered creditors receive principal payments only after the higher-tiered creditors have been paid back in full. An independent third-party agent is usually employed to run ‘tests’ on the vehicle to determine whether there is sufficient cash available to pay all obligations. If the first coverage test passes, then interest payments are made to subordinate tranche levels. If the test fails, then the vehicle will start to pay off the notes, starting from the senior notes.
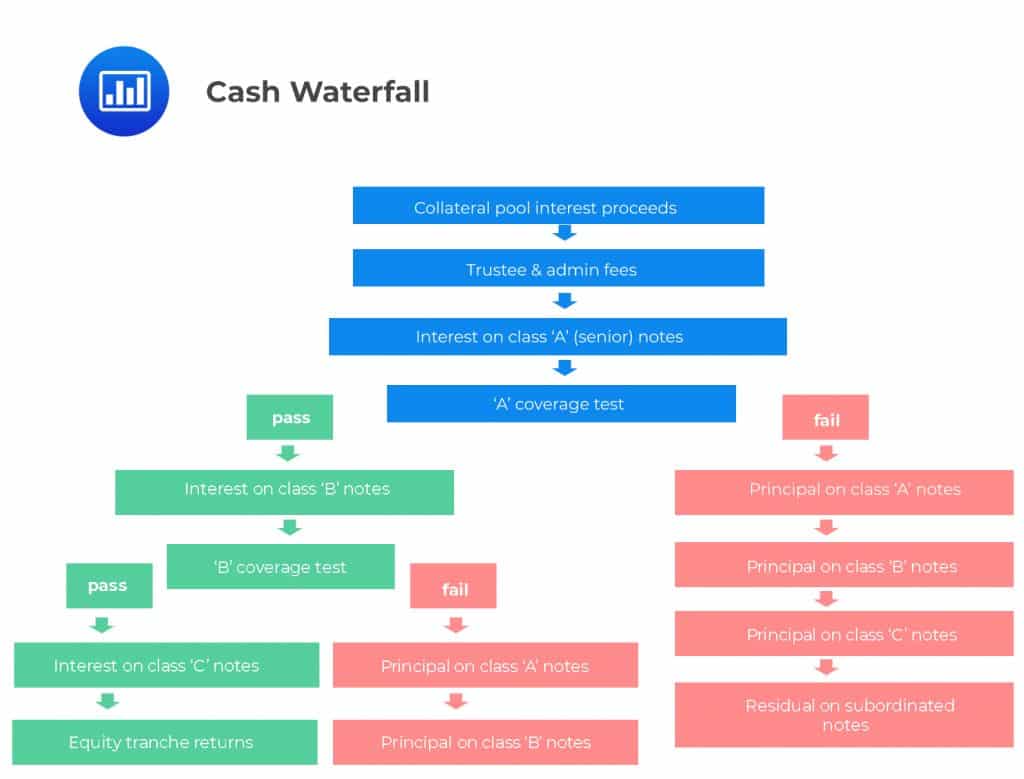 The most junior tranche, also called the equity tranche, offers the highest interest rate (or highest spread if the rate is floating) but ranks last during cash flow distribution. It’s also the first tranche to absorb any loss that may be incurred. For this reason, it is sometimes referred to as the first-loss piece. It is usually unrated and the originator maintains ownership of a part of it as a way to mitigate conflict of interest and instill confidence among senior bondholders.
As previously mentioned, credit enhancement refers to methods used to improve the credit profile of the SPV to make securitized assets more marketable. The lower the quality of the assets being securitized, the greater the need for credit enhancement.
Credit enhancement takes the following forms:
This involves the securitizing firm (originator) transferring assets to the SPV whose nominal value exceeds the face value of securities issued to investors. This ensures that the structure has some loss absorption capacity.
Monoline insurance companies guarantee timely repayment of bond principal and interest in exchange for insurance premiums. The claims-paying rating and reputation of the insurance company are important in determining the overall rating of the issue.
The structure of a set of securitized assets also provides credit enhancement. Class ‘B’ and class ‘C’ notes are subordinates to class ‘A’ notes. The class B note’s right to its proportional share of cash flows is subordinated to the rights of the senior (class ‘A’) noteholders. Similarly, class C note’s right to its proportional share of cash flows is subordinated to the rights of class ‘A’ and class ‘B’ noteholders.
The step-up margin is the rate by which the issue margin increases. This event usually occurs on the scheduled maturity date when the issuer is expected to call the notes and return the principal and pay any interest accrued to the investor. If a note pays LIBOR + 100 pbs, for example, a step-up clause may require the issuer to increase the margin by an additional 100 bps on the call date. The step-up feature is used to guarantee an investor that the potential for extension of the notes beyond the expected maturity date is low and they will get their money back as promised. It is used to convince them from the outset that the issuer considers the economic cost of paying a higher coupon as unacceptable and that the issuer would seek to refinance by exercising the call option.
Excess spread is the difference between the cash flows collected and the payments made to all bondholders. For instance, let the interest rate received on the underlying collateral be 11%, and the coupon on the issued structured security be 10% (including fees). In this case, the excess spread is 1%. The excess spread is a built-in margin of safety that protects the pool (and originator) from losses and also creates room for the absorption of expenses. Its presence can actually improve the ratings on the structured product being assembled and make the resulting security more attractive to investors.
If there’s any surplus after losses and expenses have been absorbed, it is not made available for distribution to investors immediately. Instead, it is held in a reserve account to cover future losses. Any monies in the reserve account after all obligations have been settled end up benefiting the originator.
The performance of a portfolio of ABS or MBS products depends, to a large extent, on the ability of the individuals who have been issued with the underlying facilities (consumer debt or mortgages) to pay off their obligations. There are specific performance measures used for different asset classes.
Some banks, such as American Express and Bank of America, specialize in the provision of credit cards. Since most of their loans are unsecured, the ABS market became the primary vehicle to fund their investments. Credit card pools have certain unique characteristics:
The following performance measures are used to analyze the performance of credit card ABS:
A credit card is considered delinquent if the holder lapses on their monthly payments. Although being 30 or 60 days late is considered delinquent, it takes 90 days or three months of relapse before a bank declares a credit card officially delinquent. Once a credit card is declared delinquent, it is reported to credit default reporting agencies. The bank may take further actions in an attempt to recoup its investment.
The delinquency ratio is measured as the value of credit card receivables overdue for more than 90 days as a percentage of total credit card receivables. The ratio provides an early indication of the quality of the credit card portfolio. The average delinquency ratio has been hovering around 2% in the last couple of years. It was highest in 2009 when it stood at 2.97%. Credit card banks strive to keep the ratio as low as possible.
The delinquency ratio is considered an indicator of potential future charge-offs.
The default ratio refers to the total amount of credit card receivables written off during a period as a percentage of the total credit card receivables at the end of that period.
The delinquency ratio and the default ratio provide an assessment of the credit loss on the pool and are normally tied to triggers for early amortization. For this reason, ABS investors will want to be kept abreast of these ratios throughout the life of the transaction.
The monthly payment rate (MPR) is calculated as the percentage of monthly principal and interest payments divided by the total credit card receivables pool.
Suppose that an ABS originated by a credit card bank has the following values:
$$ \begin{array}{l|c|c|c|c|c} \textbf{Date} & {\textbf{Total} \\ \text{outstanding} \\ \text{credit card} \\ \text{receivables}} & {\text{Current} \\ \text{receivables}} & {\text{Over 30} \\ \text{days past} \\ \text{due}} & {\text{Over 60} \\ \text{days past} \\ \text{due}} & {\text{Over 90} \\ \text{days past} \\ \text{due}} \\ \hline {\text{31st May} \\ \text{2020}} & $ \text{60,000,000} & $ \text{50,000,000} & $ \text{6,500,000} & $ \text{2,500,000} & $ \text{1,000,000} \\ \end{array} $$
$$ \begin{align*} \text{Payments (principal + interest) received during the month of May} & = $1,500,000 \\ \text{Amount written off during the month of May} & = $500,000 \\ \end{align*} $$
Calculate the delinquency ratio, default ratio, and monthly payment rate for this ABS as of 31st May 2020.
$$ \begin{align*} \textbf{Delinquency ratio} & =\cfrac { \textbf{receivables over 90 days past due} }{ \textbf{total credit card receivables}} =\cfrac { $1,000,000 }{ $60,000,000 } =1.67\% \\ \textbf{Default ratio} & =\cfrac { \textbf{amount of credit card receivables written off} }{ \textbf{total credit card receivables}} =\cfrac { 500,000 }{ $60,000,000 } =0.83\% \\ \textbf{Monthly payment rate} & =\cfrac { \textbf{monthly payments} }{ \textbf{total credit card receivables}} =\cfrac { $1,500,000 }{ $60,000,000 } =2.5\% \end{align*} $$
The MBS securitization market is known for its diversity, with a wide range of mortgage pools being offered to investors.
Portfolios can offer varying duration as well as both fixed- and floating-rate debt. Most agency MBS structures adopt a pass-through mechanism where investors simply purchase a share in the cash flow of the underlying loans. Conversely, non-agency MBS have senior and tranched subordinated classes with principal losses in reverse order.
The following performance measures are used to analyze the performance of an MBS:
The debt service coverage ratio (DSCR) is a performance tool that measures the ability of a borrower to repay the outstanding debt associated with commercial mortgages. It is determined by dividing net operating income (NOI) by the total amount of debt payments.
$$ \text{DSCR}=\cfrac { \text{Net operating income} }{ \text{Total debt service} } $$
Net operating income is the income or cash flows left after paying all operating expenses.
Total debt service refers to all costs related to servicing a company’s debt. This often includes interest, principal payments, and other obligations.
A DSCR of less than 1.0 indicates that the underlying asset pool of commercial mortgages does not generate sufficient cash flows to cover the total debt payment.
An MBS issued by a Texas-based bank has net operating income from its portfolio of commercial mortgaged properties amounting to $120,500,000. Notes issued to investors attract total debt payments (principal and interest) of $115,500,000. Calculate the debt service coverage ratio, DSCR.
$$ \text{DSCR}=\cfrac { \text{Net operating income} }{ \text{Total debt service} } =\cfrac { $120,500,000 }{ $115,500,000 } =1.04 $$
A ratio of 1.04 implies that the underlying asset pool of commercial mortgages does generate sufficient cash flows to cover the total debt payment.
The weighted average coupon (WAC) is the average gross interest rate of the underlying mortgages in a mortgage-backed security. It is obtained by multiplying the mortgage rate on each loan by its balance. The WAC will change over time as the mortgages underlying the security are repaid. Even then, at any point in time when compared to the net coupon payable to investors, it gives us an indication of a pool’s ability to pay.
Assume that an MBS is composed of 5 different bundles of mortgages with a principal balance of $80 million. The table below gives the outstanding balance and coupon rate of each bundle:
$$ \begin{array}{l|c|c} \textbf{Bundle} & \textbf{Principal balance} & \textbf{Coupon rate} \\ \hline \text{A} & $\text{10 million} & \text{7.5%} \\ \hline \text{B} & $\text{15 million} & \text{8.0%} \\ \hline \text{C} & $\text{13 million} & \text{6.0%} \\ \hline \text{D} & $\text{22 million} & \text{7.0%} \\ \hline \text{E} & $\text{20 million} & \text{6.5%} \\ \end{array} $$
Calculate the weighted average coupon.
$$ \begin{array}{l|c|c|c} \textbf{Bundle} & \textbf{Principal balance} & \textbf{Coupon rate} & \textbf{Contribution} \\ \hline \text{A} & $\text{10 million} & \text{7.5%} & {\frac {(7.5\% × $10)}{$80} = 0.9375\%} \\ \hline \text{B} & $\text{15 million} & \text{8.0%} & {\frac {(8.0\% × $15)}{$80} = 1.5\%} \\ \hline \text{C} & $\text{13 million} & \text{6.0%} & {\frac {(6.0\% × $13)}{$80} = 0.975\%} \\ \hline \text{D} & $\text{22 million} & \text{7.0%} & {\frac {(7.0\% × $22)}{$80} = 1.925\%} \\ \hline \text{E} & $\text{20 million} & \text{6.5%} & {\frac {(6.5\% × $20)}{$80} = 1.625\%} \\ \hline \textbf{Weighted} & \textbf{Average} & \textbf{Coupon} & \textbf{6.9625%} \\ \end{array} $$
The weighted average maturity (WAM) is the weighted average number of months until the final payment of all the mortgages backing a mortgage security. It is calculated by multiplying the weight of each MBS pool by the time until maturity. The higher the WAM, the longer it takes for all of the holdings in the portfolio to mature.
Suppose an MBS is composed of 5 different bundles of mortgages with a principal balance of $80 million. The table below gives the outstanding balance and maturity date of each bundle:
$$ \begin{array}{l|c|c} \textbf{Bundle} & \textbf{Principal balance} & \textbf{Maturity} \\ \hline \text{A} & $\text{10 million} & \text{60 days} \\ \hline \text{B} & $\text{15 million} & \text{240 days} \\ \hline \text{C} & $\text{13 million} & \text{200 days} \\ \hline \text{D} & $\text{22 million} & \text{360 days} \\ \hline \text{E} & $\text{20 million} & \text{300 days} \\ \end{array} $$
Calculate the weighted average maturity.
$$\begin{array}{l|c|c|c} \textbf{Bundle} & \textbf{Principal balance} & \textbf{Maturity} & \textbf{Contribution} \\ \hline \text{A} & $\text{10 million} & \text{60days} & {\frac {(60 × $10)}{$80} = 7.5} \\ \hline \text{B} & $\text{15 million} & \text{240 days} & {\frac {(240 × $15)}{$80} = 45} \\ \hline \text{C} & $\text{13 million} & \text{200 days} & {\frac {(200 × $13)}{$80} = 32.5} \\ \hline \text{D} & $\text{22 million} & \text{360 days} & {\frac {(360 × $22)}{$80} = 99} \\ \hline \text{E} & $\text{20 million} & \text{300 days} & {\frac {(300 × $20)}{$80} = 75} \\ \hline \textbf{Weighted} & \textbf{Average} & \textbf{Maturity} & \textbf{259} \\ \end{array} $$
Naturally, longer securities are more volatile than shorter securities. As such, a WAM calculated on the stated maturity date recognizes the potential liquidity risk for each security in the portfolio. On the other hand, a WAM calculated using the reset date captures the shortening effect of prepayments on the term of the loan.
The weighted average life is the estimated average number of years during which each principal dollar will be outstanding. It is calculated by summing up the time to maturity multiplied by a pool factor using the following formula:
$$ \text{WAL}=\sum { \left( \cfrac { \text{a} }{ 365 } \right) } \times \text{PF}\left( \text{t} \right) $$
The example below details the calculation of WAL where we start with an initial outstanding balance for the entire pool of $89,529,530. The pool factor PF(t), measures how much of the outstanding original loan principal remains after repayments.
$$ \textbf{Pool factor, PF(t)} = \cfrac {\text{Outstanding principal balance} }{ \text{original principal balance} } $$
$$ \textbf{Example: Weighted Average Life} $$
$$\begin{array}{l|c|c|c|c|c|c}\begin{array}[c]{@{}l@{}}\textbf{Payment}\\ \textbf{Dates}\end{array} & \begin{array}[c]{@{}l@{}}\textbf{Actual}\\ \textbf{days, a}\end{array} & \textbf{PF(t)} & \begin{array}[c]{@{}l@{}}\textbf{Principal}\\ \textbf{paid}\end{array} & \begin{array}[c]{@{}l@{}}\textbf{Outstannding} \\ \textbf{balances}\end{array} & \textbf{a/365} & \textbf{a/365*PF(t)} \\ \hline 21/11/2003 & 66 & 1.00 & & 89,529,500.00 & 0.1808 & 0.1808 \\26/01/2004 & 91 & 0.94 & 5,058,824 & 84,470,588.00 & 0.2493 & 0.2344 \\26/04/2004 & 91 & 0.89 & 4,941,176.00 & 79,529,412.00 & 0.2493 & 0.2219 \\26/07/2004 & 91 & 0.83 & 4,823,529.00 & 74,705,882.00 & 0.2493 & 0.2069 \\25/10/2004 & 91 & 0.78 & 4,705,882.00 & 70,000,000.00 & 0.2493 & 0.1945 \\24/01/2005 & 91 & 0.73 & 4,588,235.00 & 65,411,765.00 & 0.2493 & 0.1820 \\25/04/2005 & 91 & 0.68 & 4,470,588.00 & 60,941,176.00 & 0.2493 & 0.1695 \\25/07/2005 & 91 & 0.63 & 4,352,941.00 & 56,588,235.00 & 0.2493 & 0.1571 \\24/10/2005 & 92 & 0.58 & 4,235,294.00 & 52,352,941.00 & 0.2521 & 0.1462 \\24/01/2006 & 90 & 0.54 & 4,117,647.00 & 48,235,294.00 & 0.2466 & 0.1332 \\24/04/2006 & 91 & 0.49 & 4,000,000.00 & 44,235,294.00 & 0.2493 & 0.1222 \\24/07/2006 & 92 & 0.45 & 3,882,353.00 & 40,352,941.00 & 0.2521 & 0.1134 \\24/10/2006 & 92 & 0.41 & 3,764,706.00 & 36,588,235.00 & 0.2521 & 0.1033 \\24/01/2007 & 90 & 0.37 & 3,647,059.00 & 32,941,176.00 & 0.2466 & 0.0912 \\24/04/2007 & 91 & 0.33 & 3,529,412.00 & 29,411,765.00 & 0.2493 & 0.0823 \\24/07/2007 & 92 & 0.29 & 3,411,765.00 & 26,000,000.00 & 0.2521 & 0.0731 \\24/10/2007 & 92 & 0.25 & 3,294,118.00 & 22,705,882.00 & 0.2521 & 0.0630 \\24/01/2008 & 91 & 0.22 & 3,176,471.00 & 19,529,412.00 & 0.2493 & 0.0548 \\24/04/2008 & 91 & 0.18 & 3,058,824.00 & 16,470,588.00 & 0.2493 & 0.0449 \\24/07/2008 & & & 16,470,588.00 & & & \\ & & & & & \textbf{WAL} & \bf{2.5747}\end{array}$$
Prepayment is undoubtedly one of the key issues an investor in MBSs would want to keep an eye on. Prepayments speed up principal repayments and also reduce the amount of interest paid over the life of a mortgage. Therefore, they can adversely affect the amount and timing of cash flows.
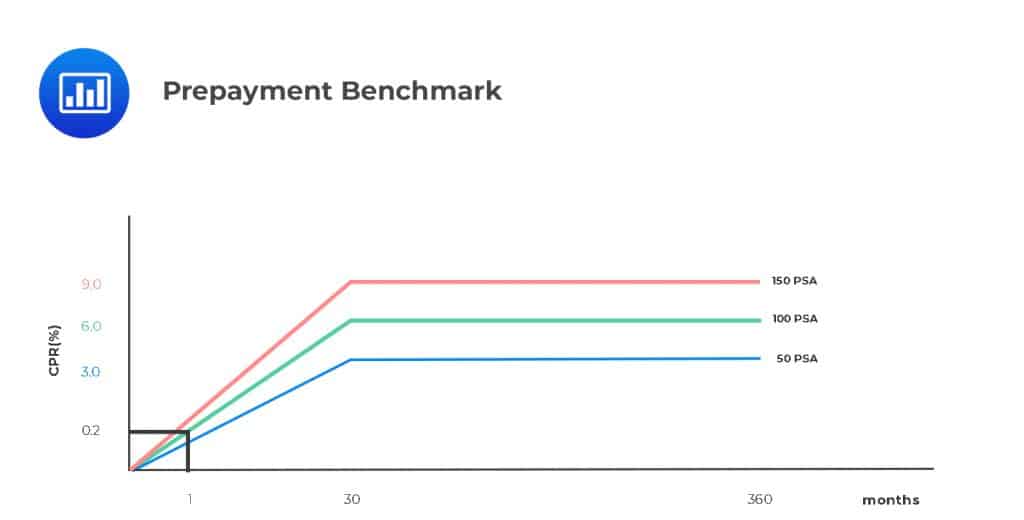
Markets have adopted two main benchmarks that are used to track prepayment risk – the conditional prepayment rate (CPR) and the Public Securities Association (PSA) prepayment benchmark.
The CPR is a proportion of a loan pool’s principal that is assumed to be paid off ahead of time in each period. It measures prepayments as a percentage of the current outstanding loan balance. It is always expressed as a percentage, compounded annually. For example, a 5% CPR means that 5% of a pool’s outstanding loan balance pool is likely to prepay over the next year. It is estimated based on historical prepayment rates for past loans with similar characteristics as well as future economic prospects.
The CPR can be converted into a single monthly mortality rate (SMM) as follows:
$$ \text{SMM}=1-{ \left( 1-\text{CPR} \right) }^{ \frac { 1 }{ 12 } } $$
SMM is in effect the amount of principal on mortgage-backed securities that is prepaid in a given month.
Note: This also implies that:
$$ \text{CPR}=1-{ \left( 1-\text{SMM} \right) }^{ { 12 } } $$
And,
Prepayment for month i (in $) = SMM (beginning balance – scheduled principal repayment in month i)
The Public Securities Association model prepayment benchmark is one of the models used to estimate the monthly rate of prepayment. It is based on the assumption that rather than remaining constant, the monthly repayment rate gradually increases as a mortgage pool ages. The PSA is expressed as a monthly series of CPRs. The model assumes that:
A mortgage pool whose prepayment speed (experience) is in line with the assumptions of the PSA model is said to be 100% PSA. Similarly, a pool whose prepayment experience is 1.5 times the CPR under the PSA model is said to be 150% PSA (or 150 PSA).
Practice Question
An asset-backed security is said to be 200 PSA. What is SMM for the 20th month?
- 4%.
- 8%.
- 0.69%.
- 0.35%.
The correct answer is C.
The PSA model assumes that the CPR is 0.2% for the first month after origination, increasing by 0.2% every month up to 30 months.
CPR (month 20) at 100 PSA = 20 × 0.2% = 4%.
200 PSA implies that CPR (month 20) = 2 × 4% = 8%.
SMM = 1 – (1 – CPR)1/12 = 1 – (1 – 0.08)1/12 = 0.6924%.
Practice securitization structures, asset-backed securities, mortgage-backed securities, and credit enhancement techniques with study notes, practice questions, video lessons, and mock exams.
Offered by AnalystPrep


Get Ahead on Your Study Prep This Cyber Monday! Save 35% on all CFA® and FRM® Unlimited Packages. Use code CYBERMONDAY at checkout. Offer ends Dec 1st.