


Volatility Derivatives and Variance Sw ...
Volatility as an Asset Class Volatility is considered a distinct asset class by... Read More

This strategy aims to reduce portfolio return volatility, enhancing the predictability of future portfolio values. For large portfolios, it can help immunize specific liabilities.
The simplest approach involves purchasing a zero-coupon bond with the same face value and maturity as the liability. It results in a Macaulay duration of zero due to the absence of cash flow, reinvestment, or price risk.
This metric represents the weighted average time to receive all bond cash flows. For zero-coupon bonds with a single payment at maturity, Macaulay duration equals the bond’s maturity.
Price Risk – Only exists when selling a bond prior to its maturity date. This is the risk that the price of the security will move adversely and cause the investor to realize a capital loss.
Reinvestment Risk – The risk that subsequent cash flows will earn less than prior cash flows due to falling interest rates after having been used to purchase an identical security (assumed reinvestment).
Macaulay duration is the tipping point at which price and reinvestment risk cancel one another out.
It’s the Macaulay duration divided by (1+ Periodic Interest Rate) and offers a more accurate measure of short-term interest rate sensitivity.
Dispersion and convexity are required to make a more accurate calculation of portfolio statistics when changes in the yield curve are unknown, also known as structural risk.
Dispersion – speaks to the range of possible outcomes that can be seen for a given portfolio statistic. It could include range, variance, standard deviation, etc. Duration is a linear measure and alone will not be completely accurate, especially for larger moves. Convexity added with duration is what allows for more accurate calculations.
$$ \text{Convexity} = \frac {(\text{Macaulay duration} + \text{Macaulay duration}^2 + \text{dispersion}) }{ (1 + \text{Periodic Rate})^2} $$
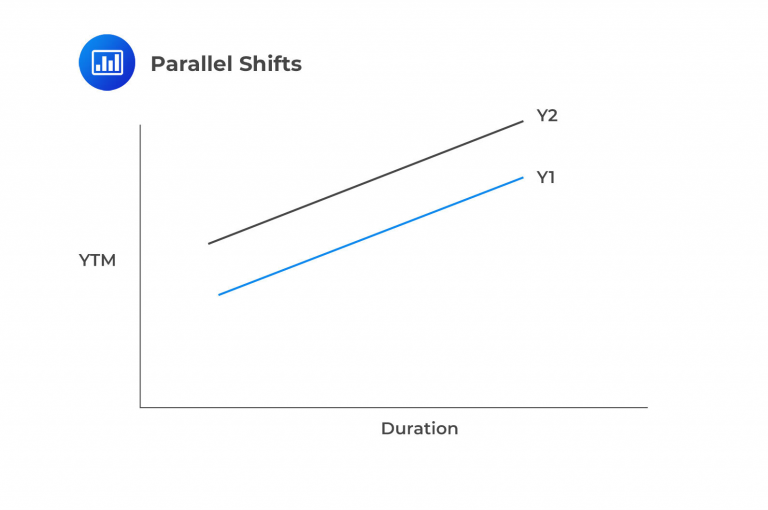
A parallel shift up means interest rates at all maturities increase together. This can benefit a portfolio with a higher dispersion than the liability. For instance, to duration match a 5-year liability, a manager might combine 10-year notes with 1-year treasuries (creating a barbell portfolio) to make the average duration match the liability. However, this duration matching without cash flow matching presents a structural risk. A parallel yield increase would lead to a decline in the value of a fixed-income portfolio, as shown below.
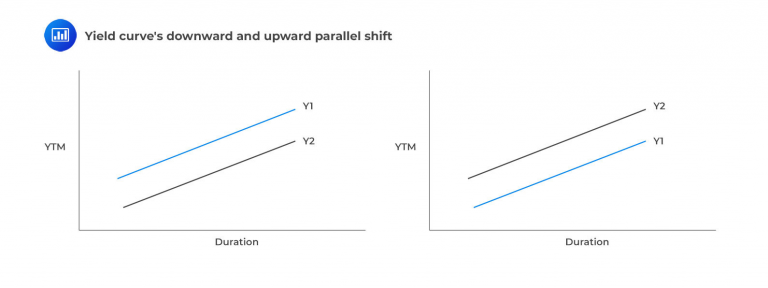
A parallel yield shift down indicates that rates at every maturity on the curve will simultaneously decrease. This shift is lower in interest rates will send the value of the duration-matched portfolio up, as rates and prices have an inverse relationship. This is the simplest kind of shift to analyze. Provided that the portfolio has a convexity equal to or slightly above that of the liabilities, the risks of the immunization strategy are low.
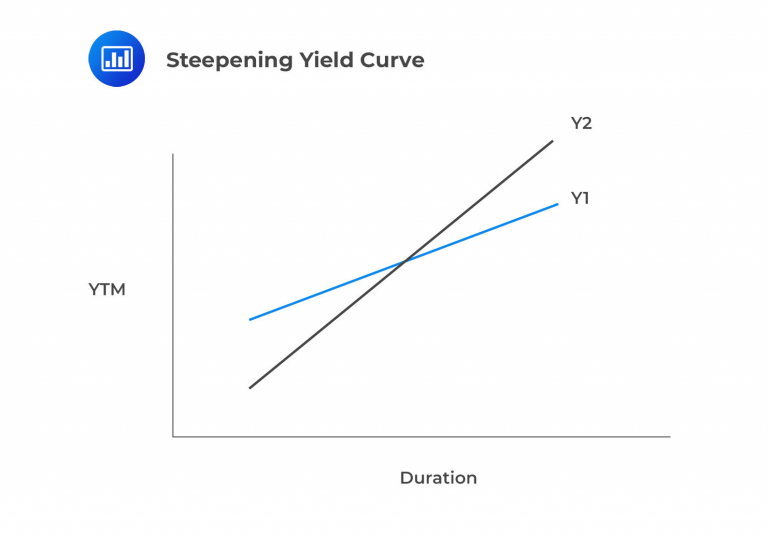
Indicates that long-term rates will rise and or short-term rates will fall. Things become slightly more complicated in the case of steepening or flattening yield curves. As shown below, a steepening of the curve sends longer maturity, and hence higher duration bonds in portfolio lower. This effect is more powerful than the increase in value for the low-duration bonds of a barbell strategy. This causes a loss in market value to the immunization portfolio while the present value of the liability is unchanged in the middle.
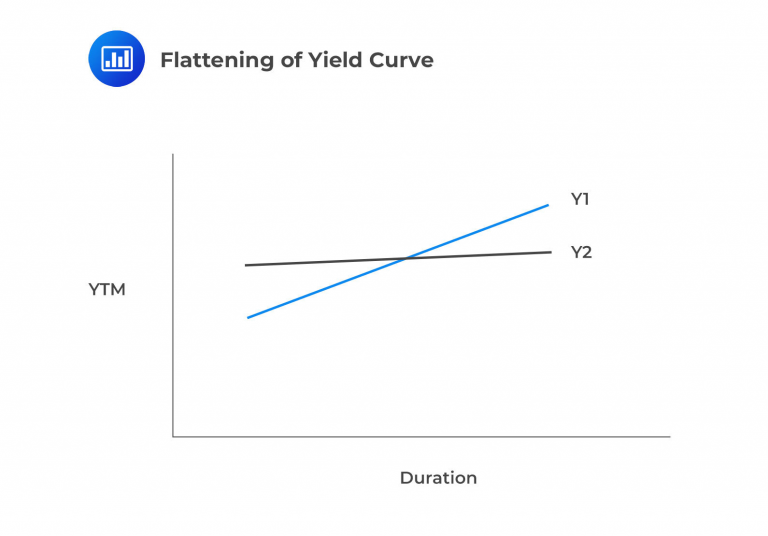
A flattening yield curve suggests that long-term rates will decrease while short-term rates rise. This results in the market value increasing, making the present value of assets exceed that of liabilities. It’s a positive outcome but doesn’t guarantee full future liability funding. This is because the portfolio’s internal rate of return (IRR) tends to decrease below a single point in the middle duration with a flatter curve. A flattening yield curve is also associated with a decline in economic activity.
A positive butterfly twist suggests that both long- and short-term rates will increase while medium-term rates will decrease. In this scenario, the market value of the immunizing portfolio will decrease due to rising long-term and high-term yields. Meanwhile, the present value of liabilities will increase as middle-duration yields fall, causing the present value of the liabilities to rise. When the present value of assets surpasses that of liabilities, it’s not a favorable outcome for this strategy. However, it doesn’t guarantee that the liability won’t be funded (depending on portfolio IRR). Structural risk is certainly a concern. 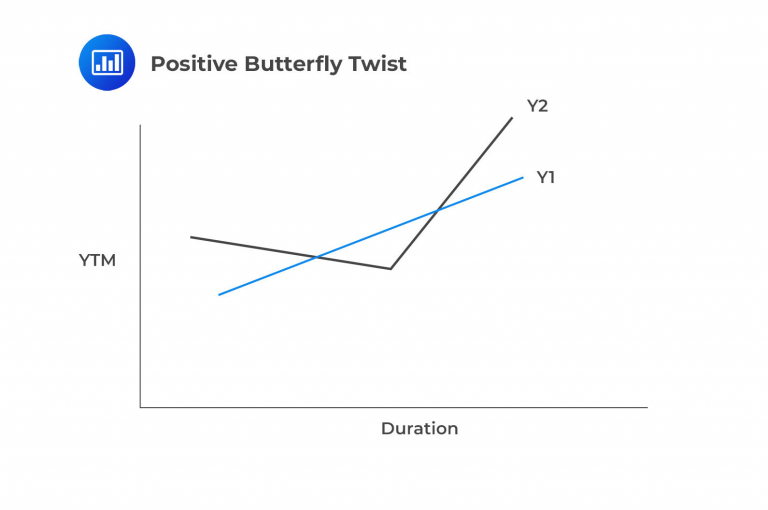
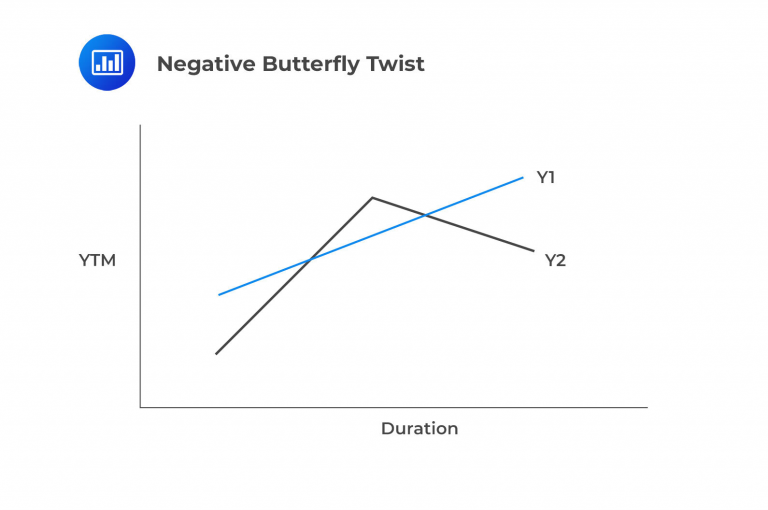
A negative butterfly twist occurs when both long-term and short-term rates decline while medium-term rates increase. Unlike a positive butterfly twist, a negative one leads to an increase in the market value of the immunizing portfolio as both short-duration and high-duration yields decrease. This causes the market value of assets in the barbell portfolio to rise. In the middle duration range, the present value of the liability decreases as the corresponding interest rate increases. When the present value of assets exceeds that of liabilities, it’s once again a positive sign for the strategy, although success isn’t guaranteed.
Rules for immunizing a single liability:
The first two rules can be implemented using money duration alone. Money duration matches assets and liabilities by measuring the price change of the asset or liability for a given change in interest rates. It is measured in basis point value, often referred to as ‘bip’ value in finance. This is also known as the price value of a basis point.
$$ BPV = MD \times V \times 0.0001 $$
Where:
\(BPV\) = Basis point value.
\(MD\) = Modified duration.
\(V\) = Security value.
Question
Which of the following is most likely representative of a flattening of the yield curve?
- Long-term rates falling; short-term rates rising.
- Long-term rates rising; short-term rates falling.
- Increase in consumer sentiment.
Solution
The correct answer is A.
It represents a scenario where long-term rates are falling and short-term rates are rising, which is indicative of a flattening yield curve.
B is incorrect. If long-term rates rise while short-term rates fall, it will typically lead to a steeper yield curve, not a flattening one.
C is incorrect. It is unrelated to changes in the yield curve. Consumer sentiment represents the attitudes and confidence of consumers but does not directly impact the yield curve. Therefore, it is not a relevant factor for determining the shape of the yield curve.
Reading 20: Liability-Driven and Index-based Strategies
Los 20 (b) Evaluate strategies for managing a single liability
Offered by AnalystPrep


Get Ahead on Your Study Prep This Cyber Monday! Save 35% on all CFA® and FRM® Unlimited Packages. Use code CYBERMONDAY at checkout. Offer ends Dec 1st.