


Estimating the Parameters of a Simple ...
While conducting a regression analysis, we start with the dependent variable whose variation... Read More

The F-test determines whether all the independent variables help explain the dependent variable. It is a test of regression’s overall significance that involves testing the null hypothesis that all the slope coefficients in the regression are jointly equal to zero against the alternative hypothesis that at least one slope coefficient is not equal to 0:
\(H_{0}: b_{1}=b_{2}=…=b_{k}=0\) versus \(H_{a}:\) at least one \(b_{j}≠0\)
It is imperative to understand that we cannot use the t-test to determine whether every slope coefficient is zero. This is because individual tests do not account for interactions among the dependent variables.
The following inputs are required to determine the test statistic for the null hypothesis.
i. The total number of observations, \(n\).
ii. The total number of slope coefficients to be estimated, \(k+1\), where \(k\) = number of slope coefficients.
iii. The Residual Sum of Squares (SSE), which is the unexplained variation.
iv. The Regression Sum of Squares (RSS), which is the explained variation.
The F-statistic (which is a one-tailed test) is computed as:
$$\begin{align*}F&=\frac{\bigg(\frac{RSS}{k}\bigg)}{\bigg(\frac{SSE}{n-(k+1)}\bigg)}\\&=\frac{\text{Mean Regression Sum of Squares (MSR)}}{\text{Mean Squared Error (MSE)}}\end{align*}$$
Where:
A large value of F implies that the regression model does a good job in explaining variation in the dependent variable. On the other hand, the value of F will be zero when the independent variables do not explain the dependent variable at all.
The F-test is denoted as \(F_{k, (n-(k+1))}\). The test should have \(k\) degrees of freedom in the numerator and \(n-(k+1)\_ degrees of freedom in the denominator.
We reject the null hypothesis at a given significance level, \(α\), if the calculated value of \(F\) is greater than the upper critical value of the one-tailed \(F\) distribution with the specified degrees of freedom.
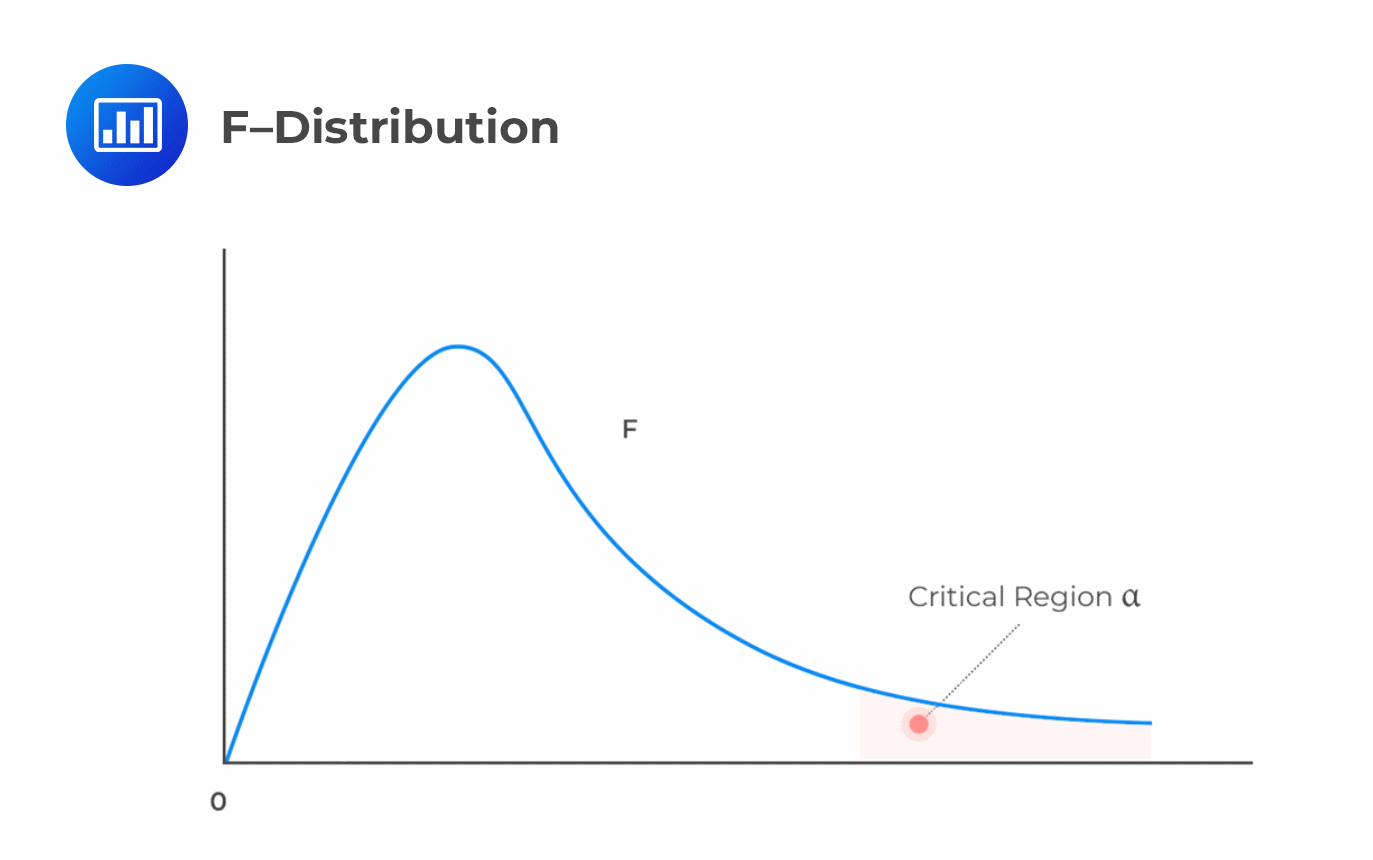
Reject \(H_0\) if F-statistic \(>F_{c}\) (critical value)
The following ANOVA table presents the output of the multiple regression analysis of the price of the US Dollar index on the inflation rate and real rate of interest.
$$\textbf{Exhibit 1: ANOVA Table} $$
$$\small{\begin{array}{c|c|c|c|c|c}\hline{}& \textbf{df} & \textbf{SS} & \textbf{MS} & \textbf{F} & \textbf{Significance F}\\ \hline\text{Regression} & 2 & 432.2520 & 216.1260 & 7.5405 & 0.0179\\ \hline\text{Residual} & 7 & 200.6349 & 28.6621 & {}& {}\\ \hline\text{Total} & 9 & 632.8869 & & &{}\\ \hline\end{array}}$$
Test the null hypothesis that all of the independent variables are equal to zero at the 5% significance level.
We test the null hypothesis:
\(H_{0}: \beta_{1}=\beta_{2}=0\) versus \(H_a\): at least one \(b_j≠0\).
Number of slope coefficients \((k)=2\).
Degrees of freedom in the denominator = \(n-(k+1)=10-(2+1)=7\).
RSS = 432.2520
SSE = 200. 6349
Thus,
$$\begin{align*}F&=\frac{\bigg(\frac{RSS}{k}\bigg)}{\bigg(\frac{SSE}{n-(k+1)}\bigg)}\\&=\frac{\frac{432.2520}{2}}{\frac{200.6349}{7}}\\&=7.5405\end{align*}$$
For \(\alpha=0.05\), the critical value of F with \(k= 2\) and \((n – k – 1) = 7\) degrees of freedom \(F_{0.05,2,7}\) is approximately 4.74.
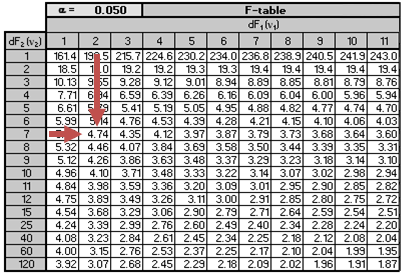
The calculated value of the F-test statistic, 7.5405, is greater than the critical value of F, 4. 737. We, therefore, reject the null hypothesis that coefficients of both independent variables equal 0.
Additionally, notice that from the ANOVA table, the column “Significance F” reports a p-value of 0.0179, which is less than 0.05. The p-value implies that the smallest level of significance at which the null hypothesis can be rejected is 0.0179.
Question
Adil Suleman, CFA, wishes to establish the possible drivers of a company’s percentage return on capital (ROC). Suleman identifies performance measures such as the profit margin (%), sales, and debt ratio as possible drivers of ROC.
He then regresses the ROC against the three independent variables: Sales, profit margin, and debt ratio. The output from a statistical software package is presented below:
- Observations: 25.
- The total sum of squares: 80.16.
- Sum of squared errors: 30.0545.
Suleman proceeds to test the null hypothesis at the 5% significance level that all three of the independent variables are equal to zero.
The F-statistic for testing whether the slope coefficient is equal to zero is closest to:
A. 11.67.
B. 18.67.
C. 19.56.
Solution
The correct answer is A.
$$\begin{align*}F&=\frac{\text{(Mean Regression Sum of Squares)}}{\text{Mean squared error}}\\&=\frac{(\frac{RSS}{k})}{(\frac{SSE}{n-(k+1)})}\end{align*}$$
$$\text{RSS}=\text{SST}-\text{SSE}$$
$$\begin{align*}\text{RSS}&=80.16-30.0545\\&=50.1055\end{align*}$$
$$\begin{align*}\text{Mean Regression Sum of Squares}&=\frac{50.1055}{3}\\&=16.7018\end{align*}$$
$$\begin{align*}\text{Mean Squared Error}&= \frac{30.0545}{25-3-1}\\&=1.4312\end{align*}$$
$$\begin{align*}F&=\frac{16.7018}{1.4312}\\&=11.67\end{align*}$$
Reading 2: Multiple Regression
LOS 2 (g) Calculate and interpret the F–statistic, and describe how it is used in regression analysis.
The F-statistic is a core CFA Level II Quantitative Methods concept. Candidates may be tested on overall regression significance, ANOVA interpretation, joint hypothesis testing, and whether independent variables explain variation in the dependent variable.
Build confidence with the CFA Level II prep course featuring guided lessons, practice questions, and full mock exams.
Access CFA Level II practice questions, video lessons, and study notes covering regression analysis, F-tests, model significance, and quantitative methods.
Offered by AnalystPrep


Get Ahead on Your Study Prep This Cyber Monday! Save 35% on all CFA® and FRM® Unlimited Packages. Use code CYBERMONDAY at checkout. Offer ends Dec 1st.