


Predicted Trend Value of a Time Series
A time series shows data on a variable’s outcome in different periods—for example,... Read More

Alpha: This is a financial risk ratio used in the prediction of returns obtained from holding an investment. It measures the value created by an active fund manager or an index provider. Investors prefer a positive and high alpha. A positive alpha implies that a share has outperformed its benchmark. A negative alpha, on the other hand, implies an underperformance relative to the benchmark. For example, an alpha of 5%, implies that a share has outperformed its benchmark by 5%.
Beta: This is a measure of how an investment responds to the changes in the equity market. It shows the volatility of an investment relative to the market. Beta exposure, like alpha, is measured relative to an index. A share’s beta value of 1.3, for instance, is expected to yield a 13% return given a benchmark return over the same period of 10%. Furthermore, a beta greater than 1 implies that the share in question is more volatile than the market (the benchmark).
Duration and convexity are the necessary sensitivity exposure measures for fixed-income securities and portfolios. Refer to the discussions below.
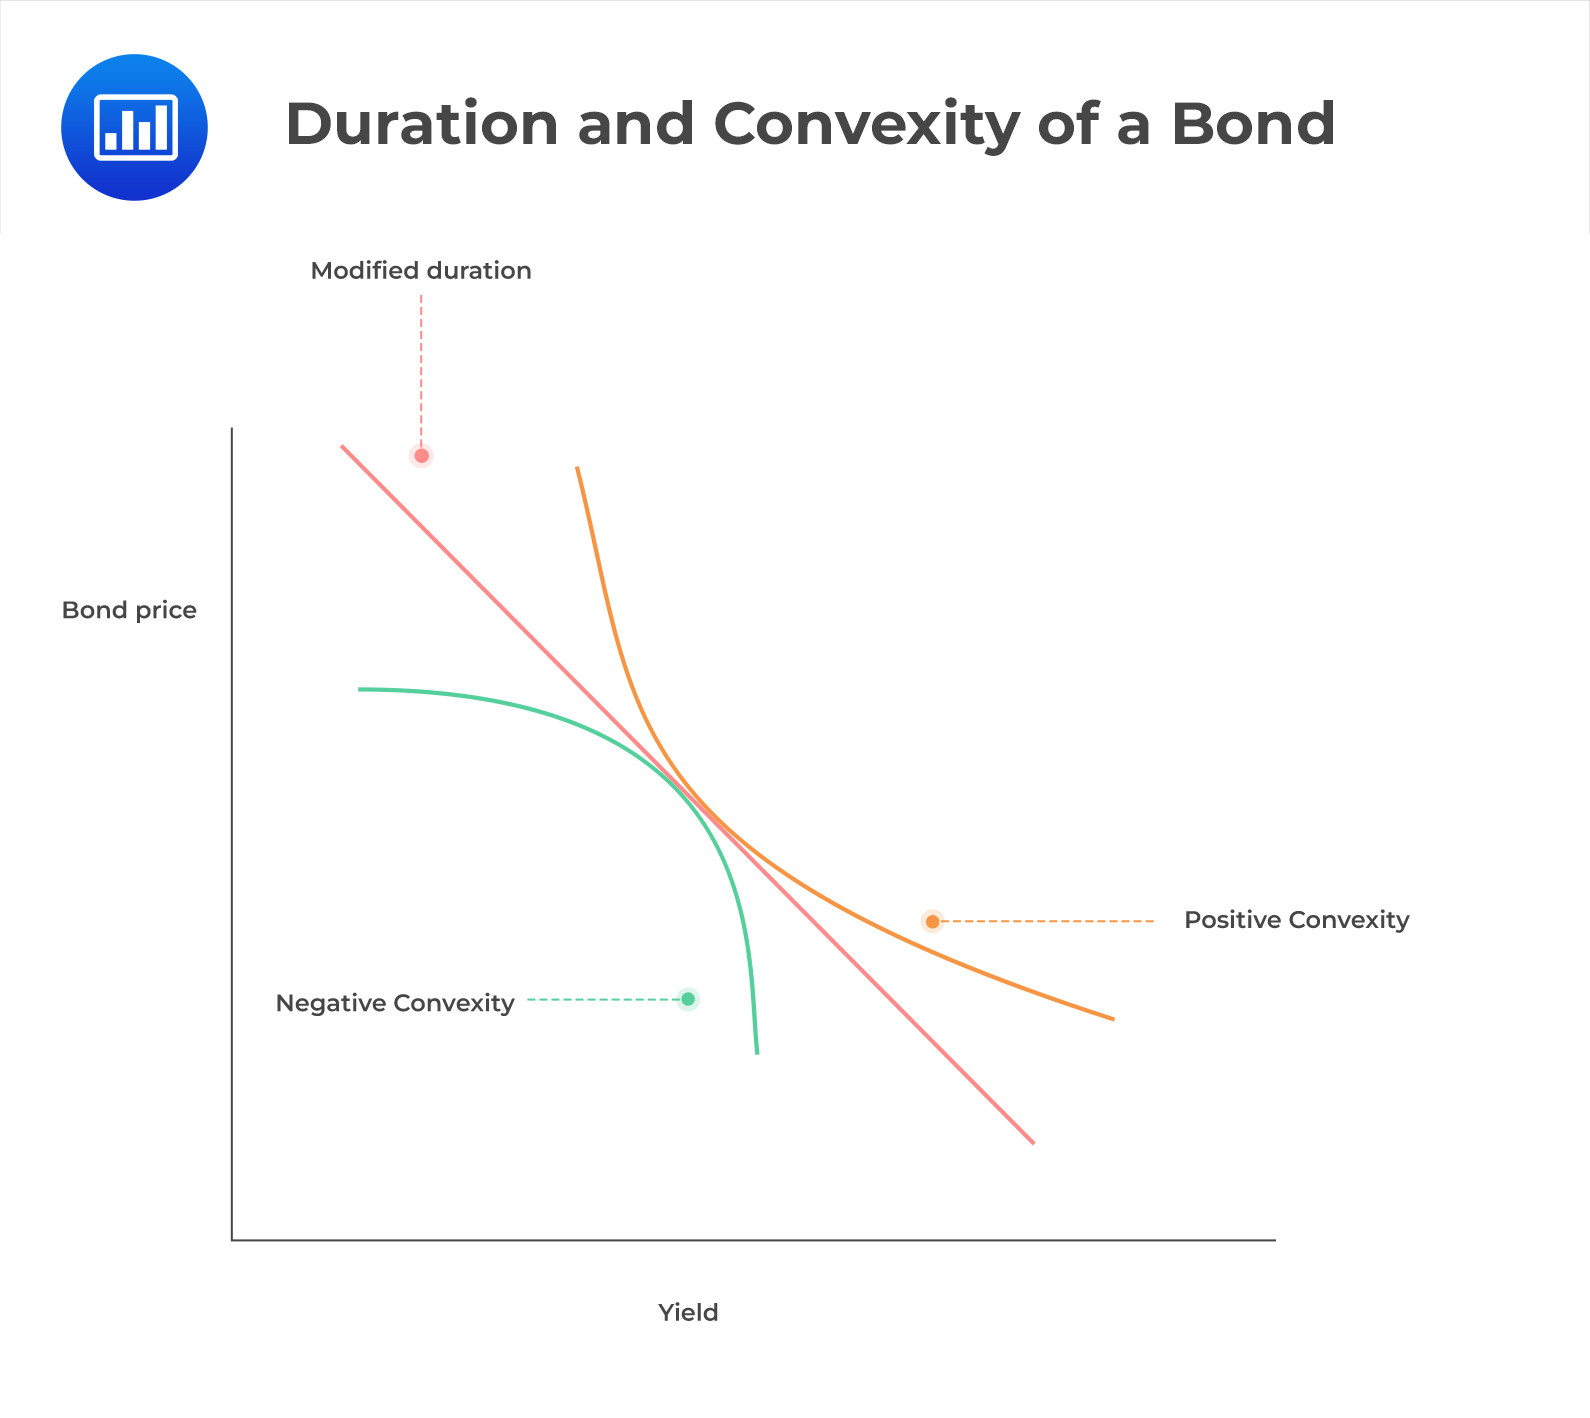
Duration measures the sensitivity of bonds to changes in interest rate. It estimates the interest rate volatility risk of a bond by giving a relation between changes in price to changes in yield.
Convexity relates to the interconnection between a bond’s price and its yield, relative to changes in interest rates. Convexity measures the degree of the curve in relation to bond prices and yields. It shows how the bond duration changes with changes in interest rate. Convexity helps managers to measure and manage exposure to market risk.
A negative convexity implies that duration increases with an increase in yield rate. In other words, bond price increases with an increase in yield rate and vice versa. In positive convexity, a fall in yield rate will make bond prices increase.
The following diagram demonstrates the duration and convexity of a bond:
 $$ \textbf{(Numericals, 2018)} $$
The option Greeks are a group of mathematical derivatives that aid the management or understanding of the risks in a portfolio. Option Greeks measure the sensitivity of an option’s price to its volatility or the price of the underlying asset. Let us now introduce the key option Greeks.
Delta measures how sensitive the price of an option is to changes in the price of the underlying asset (assuming all the other parameters remain constant). The delta value ranges from -1 to 1 (or -100% to 100% when measured in percentage). For example, the implication of an option that has a delta value of 50% is that a $100 increase in the price of the underlying asset corresponds to a 50% increase in the price of the option. The delta for an individual derivative is:
$$ \Delta=\frac{\delta P_o}{\delta P_a} $$
Where:
Gamma measures the sensitivity of the delta \((\Delta)\) of the option to price changes of the underlying asset. It is mainly used to assess the option’s delta. Gamma is given by:
$$ \Gamma=\frac{\delta\Delta}{\delta P_a} $$
Where:
It is the rate of change of the price of an option with respect to a change in the expected volatility of the underlying asset price. A portfolio with a low value of vega will be relatively insensitive to fluctuations in volatility. Therefore, an options’ trader will want to have a vega close to zero if they want the values of the options not to be affected by changes in volatility.
Vega is given by:
$$ \nu=\frac{\delta P_o}{\delta\sigma} $$
Where:
Vega is expressed in terms of price units such as dollars rather than decimals or percentages. An increase in vega corresponds to an increase in the value of an option.
The above option Greeks can be incorporated in the following equation:
$$ \text{Change in call price} = \text{delta} \left(\Delta P\right)+\frac{1}{2}\text{ gamma}\left(\Delta P\right)^2+\text{vega} \left(\Delta V\right) $$
Where:
Question
Clara Bush has $10,000 invested in a portfolio of 1,000 shares in Company A. Mark Wright, on the other hand, has $10,000 invested in a portfolio of 4,000 call options on shares in Company A. Each call option has a delta of 0.5. What is the percentage change in the value of each portfolio if the share price increases by 8%?
- Bush: 4%; Wright: 2%
- Bush: 8%; Wright: 0%
- Bush: 8%; Wright: 20%
Solution
The correct answer is C.
Company A share is worth $10, and its call option is worth $2.50. If the share price increases by 8% to $10.80, Clara Bush’s portfolio will be worth $10,800. This is an 8% increase in value.
On the other hand, Mark Wright’s portfolio consists entirely of call options. Given delta as 0.5, an increase of $1 of the share price will make the call option price increase by \(0.5\times$1=$0.5\), that is, from $2.50 to $3.00. Therefore, Wright’s portfolio will be worth \(4,00\times$3.00 =12,000\). A 20% increase in value.
Reading 41: Measuring and Managing Market Risk
LOS 41 (g) Demonstrate how equity, fixed-income, and options exposure measures may be used in measuring and managing market risk and volatility risk.
Review sensitivity risk measures, scenario risk measures, and how they compare to VaR with CFA Level 2 study notes, practice questions, mock exams, and video lessons designed to strengthen your exam preparation.
Offered by AnalystPrep


Get Ahead on Your Study Prep This Cyber Monday! Save 35% on all CFA® and FRM® Unlimited Packages. Use code CYBERMONDAY at checkout. Offer ends Dec 1st.