


Examination of the Quality of a Compan ...
The M-score is the score indicating the probability of earnings manipulation. (Refer to... Read More

Value at Risk (VaR) measures the probability of underperformance by providing a statistical measure of downside risk.
In the case of a continuous random variable, VaR can be computed as follows:
$$ VaR\left(X\right)=-t \text{ where } P\left(X < t\right)=p $$
VaR represents the maximum possible loss on a portfolio over a given period in the future, with a given degree of confidence. The degree of confidence is typically expressed as \(1-p\).
For instance, if an asset has a one-day 5% VaR of $7,500, then there is a 5% probability that the asset will fall in value by at least $7,500 over one day under normal market conditions. This can also be given in terms of a confidence level, that is, we are 95% (100% − 5%) confident that the asset will experience a loss of at most $7,500 in one day.
The following is an illustration of the 5% VaR of a hypothetical portfolio:
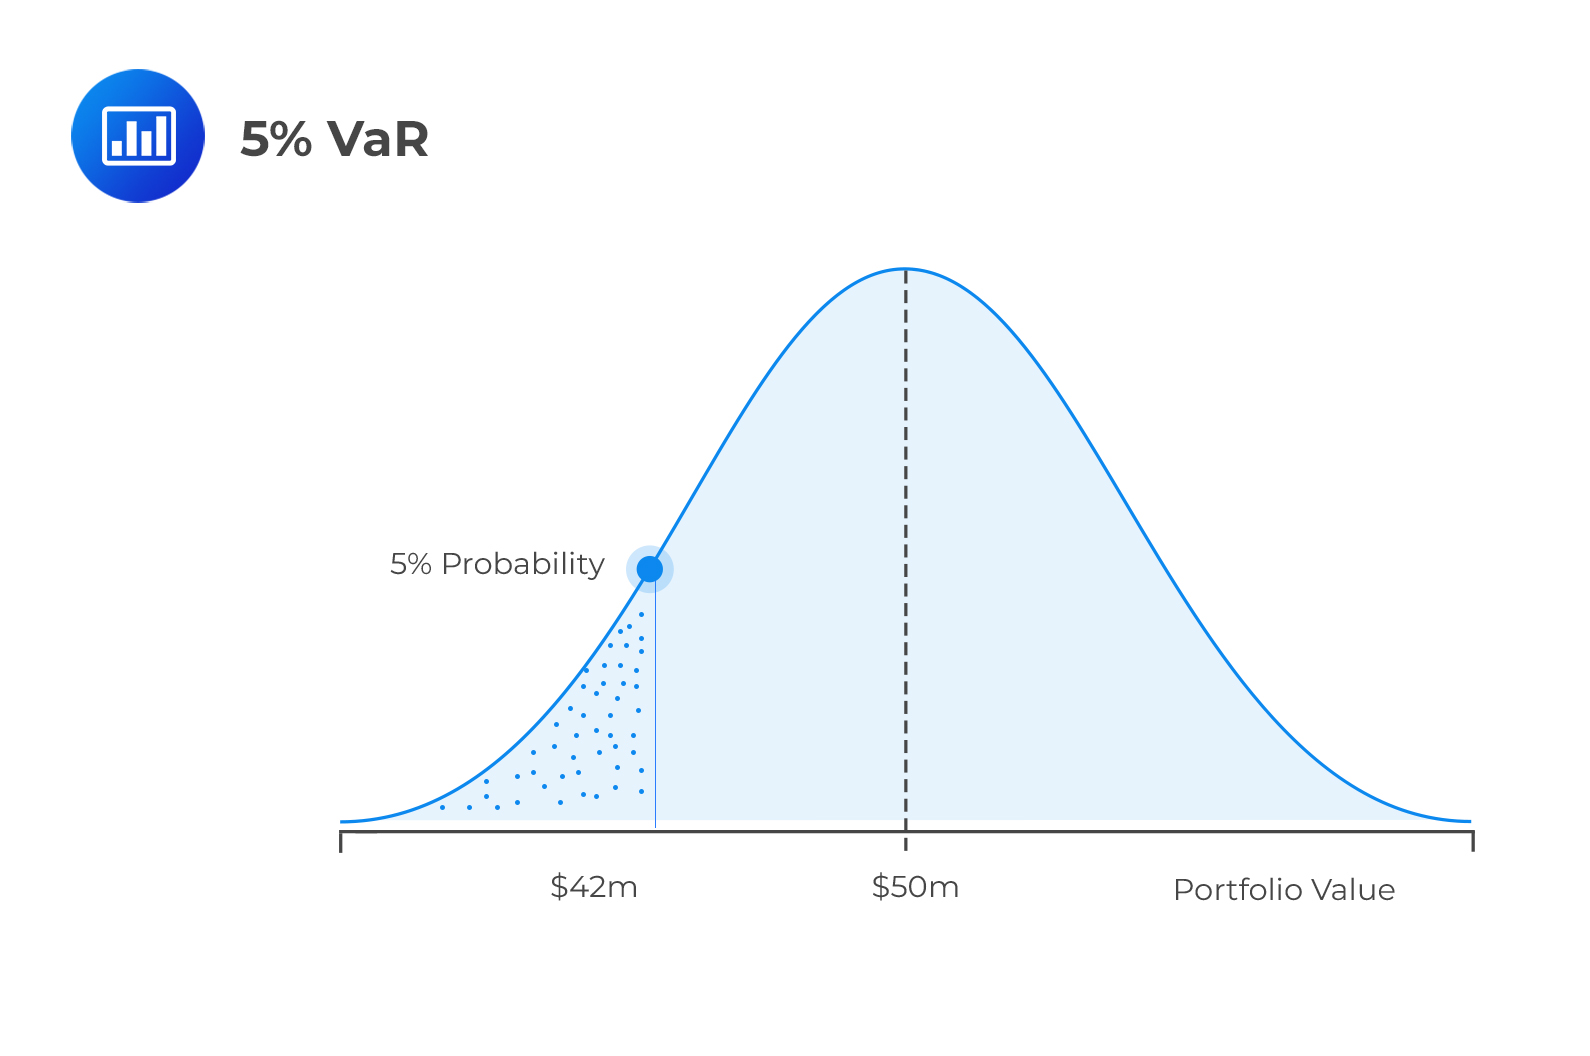 The above illustration shows that the portfolio’s expected return is $50m. Additionally, the probability of realizing a return of less than $42m is 5%.
Question
A hypothetical portfolio B has an annual 1% VaR of $45,000. Which of the following statements is most likely true about the portfolio?
- The expected minimum loss over one year, 1% of the time, is $45,000.
- There is a 99% probability that the expected loss over the next year is more than $45,000.
- The likelihood of losing $45,000 over the next year is 1%.
Solution
The correct answer is A.
An annual 1% VaR of $45,000 means that there is a 1% probability of a loss greater than $45,000.
B is incorrect. An annual 1% VaR of $45,000 means that there is a 99% probability that the portfolio will experience a loss of not more than $45,000 in one year.
C is incorrect. VaR does not specify the probability of losing a particular amount.
Reading 41: Measuring and Managing Market Risk
LOS 41 (a) Explain the use of value at risk (VaR) in measuring portfolio risk.
Offered by AnalystPrep


Get Ahead on Your Study Prep This Cyber Monday! Save 35% on all CFA® and FRM® Unlimited Packages. Use code CYBERMONDAY at checkout. Offer ends Dec 1st.