


Valuation, Intrinsic Value, and Source ...
Valuation Valuation is the process of estimating the worth of an asset-based on:... Read More

In an attempt to evaluate the quality of a company’s financial reports, an analyst seeks to answer these two questions:
The analyst follows the following fundamental steps to answer the two basic questions.
Step 1: Develop an understanding of the company, its industry, the accounting principles it uses and why such principles are appropriate, and why particular financial metrics matter.
Step 2: Gain an understanding of the management, including the terms of their compensation. Also, review the disclosures of related-party transactions and insider transactions.
Step 3: Identify outstanding areas of accounting that are exposed to subjectivity
Step 4: Compare the company’s current year financial statements and disclosures with those in the prior year’s report and identify significant differences. Furthermore, compare the company’s accounting policies with those of its adjacent competitors. Finally, use ratio analysis to compare the firm’s performance with that of the closest competitors.
Step 5: Check for warning signs of potential issues with the quality of the financial reports, as discussed in the previous learning outcome.
Step 6: For firms operating in multiple lines of business or for multinational firms, check for shifting of inventory, sales, and expenses to a specific part of the business that the firm wants to highlight. This is mainly a concern when a specific segment shows significant improvement while the consolidated financials show static or worsened growth.
Step 7: Use quantitative tools to gauge the likelihood of misreporting.
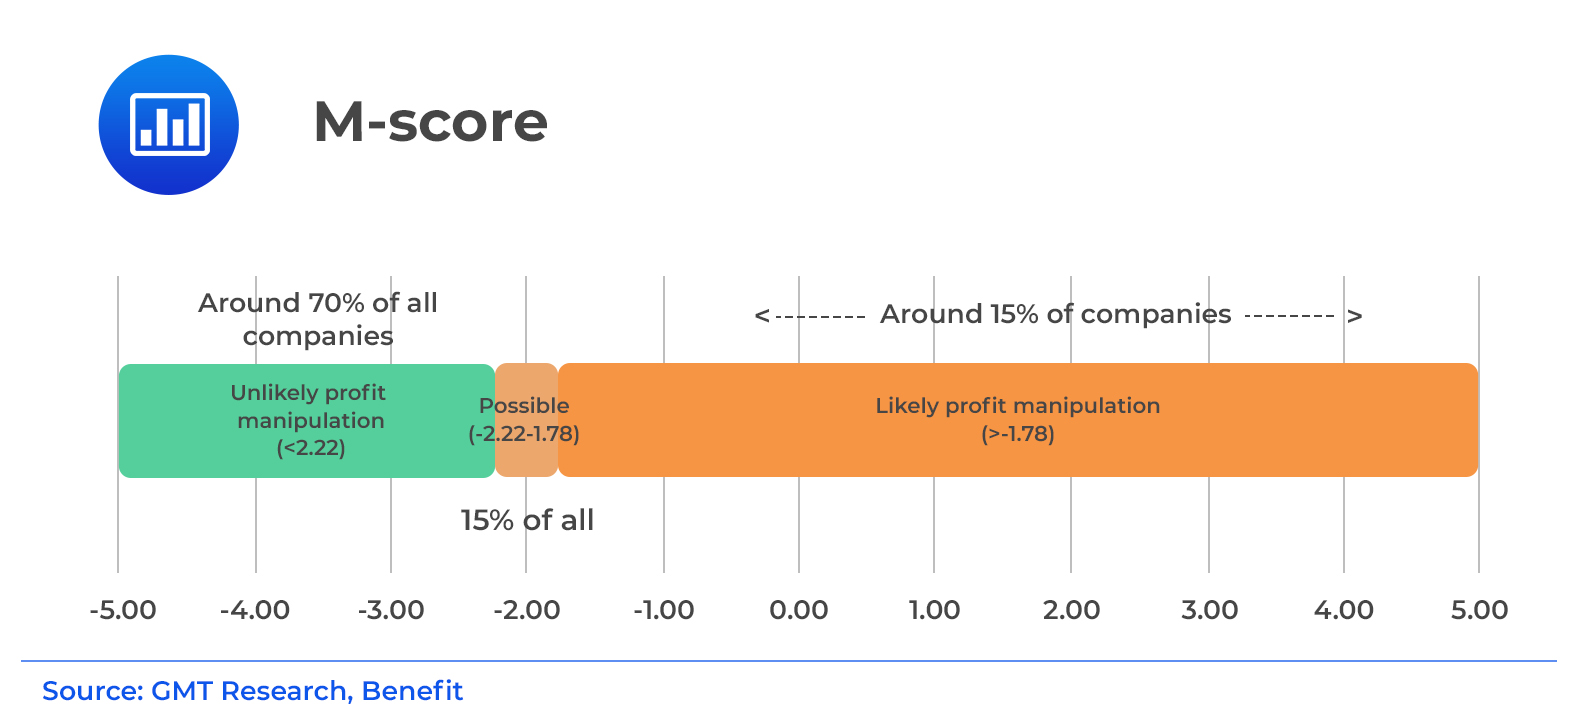
The Beneish model is a probit regression model that estimates the probability of earnings manipulation (M-score) using eight dependent variables. The M-score determines the probability of earnings manipulation. Higher M-scores, i.e., less negative numbers, indicate an increased probability of earnings manipulation.
 $$\begin{align*} \text{M-score} = & – \text{4.84 + 0.920 (DSR) + 0.528 (GMI) + 0.404 (AQI) + 0.892 (SGI)} \\ & \text{+ 0.115 (DEPI) – 0.172(SGAI) + 4.679 (Accruals) – 0.327 (LEVI)} \end{align*}$$
Where:
$$ \text{M-score = Score indicating probability of earnings manipulation} $$
$$ \text{DSR (days sales receivable index)} =\frac{\frac{\text{Receivables}}{\text{Sales}}}{\frac{\text{Receivables}_{t-1}}{\text{Sale}_{t-1}}} $$
A variation in the day’s sales receivable index (DSRI) could be indicative of inappropriate revenue recognition.
GMI (gross margin index) is the ratio of gross margin in year t – 1 to that in year t.
$$ \text{GMI}=\frac{\text{Gross Margin in year}_{t-1}}{\text{Gross Margin}_{t}} $$
A fall in margins makes companies susceptible to manipulating earnings.
AQI (asset quality index) is the ratio of non-current assets other than plant, property, and equipment to the total assets in year t relative to year t – 1.
$$\text{AQI}=\frac{[1-\frac{\text{PPE}_{t}+\text{CA}_{t}}{\text{TA}_{t}}]}{[1-(\frac{\text{PPE}_{t-1}+\text{CA}_{t-1}}{\text{TA}_{t-1}})]}$$
Where PPE is property, plant, and equipment; CA is current assets, and TA is total assets. Change in the percentage of assets other than in PPE and CA could indicate excessive capitalization of expenses.
SGI (sales growth index) is the ratio of sales in year t relative to year t – 1.
$$\text{SGI}=\frac{\text{Sales}_{t}}{\text{Sales}_{t-1}}$$
Managing the perception of continuing growth and capital needs from actual growth could predispose companies to manipulate sales and earnings.
DEPI (depreciation index) is the ratio of depreciation rate in year t – 1 to the corresponding rate in year t.
$$\text{DEPI}=\frac{\text{Depreciation Rate}_{t-1}}{\text{Depreciation Rate}_{t}}$$
Where:
$$\text{Depreciation rate}=\frac{\text{Depreciation}}{(\text{Depreciation}+\text{PPE})}$$
Deterioration in the depreciation rates could indicate understated depreciation as a means of manipulating earnings.
SGAI (sales, general, and administrative expenses index) is the ratio of SGA expenses (as a % of sales) in year t relative to year t – 1.
$$\text{SGAI}=\frac{\frac{\text{SGA}_{t}}{\text{Sales}_{t}}}{\frac{\text{SGA}_{t-1}}{\text{Sales}_{t-1}}}$$
An increase in fixed SGA expenses could predispose companies to manipulate earnings.
$$\text{Accruals}=\frac{\text{Income before extraordinary items-Cash from operations}}{\text{Total Assets}}$$
Higher accruals are indicative of earnings manipulation.
LEVI (leverage index) is the ratio of total debt to total assets in year t relative to year t – 1:
$$\text{LEV I}=\frac{\text{Leverage}_{t}}{\text{Leverage}_{t-1}}$$
Increasing leverage could predispose companies to manipulate earnings.
The M-score in the Beneish model is a regularly distributed random variable with a mean of 0 and a standard deviation of 1. Therefore, the probability of earnings manipulation can be calculated using the cumulative probabilities for a standard normal distribution or the NORMSDIST function in Excel.
The Beneish model depends on accounting data, which may not be fully reflective of the economic reality. A more in-depth analysis of underlying relationships can establish a better association between variables. Additionally, the predictive power of the Beneish model is decreasing over time. This is because earnings manipulators are just as aware as analysts of the power of quantitative models to screen for possible cases of earnings manipulation.
Although the Altman model is not directly linked to earnings quality, it was developed to evaluate the probability of bankruptcy. It relies on discriminant analysis to generate a Z-score using five variables.
$$\begin{align*}\text{Z-score}&=1.2(\frac{\text{Networking Capital}}{\text{Total Assets}}) +1.4(\frac{\text{Retained Earnings}}{\text{Total Assets}})\\ \\ &+3.3(\frac{\text{EBIT}}{\text{Total Assets}})+ 0.6(\frac{\text{Market Value of Equities}}{\text{Book Value of Liabilities}})\end{align*}$$
Each of the five variables is positively related to the Z-score. A higher Z-score is better (less likelihood of bankruptcy). Hence, higher values of the variables reduce the probability of bankruptcy under this model.
The Altman model is a single-period static model and, hence, does not capture the change in key variables over time. Furthermore, similar to the Beneish model, Altman’s model mostly uses accounting data. Other market-based data sources may provide more meaningful information for the evaluation of default risk.
Question
Two senior financial analysts for a large investment corporation are discussing the quantitative models used to gauge the likelihood of misreporting. One makes the following statements to the other one:
Statement 1: “An advantage of applying quantitative models is that they can dictate the cause and effect between model variables.”
Statement 2: “A disadvantage of using quantitative models is that their predictive power declines over time because many managers gained the skill of testing the detectability of manipulation tactics by using the model.”
Which of the above statements is (are) most likely correct?
A. Only Statement 1.
B. Only Statement 2.
C. Both Statement 1 and Statement 2.
Solution
The correct answer is B.
Earnings manipulators are just as aware as analysts of the power of quantitative models to screen for possible cases of earnings manipulation. A study showed that the predictive power of the Beneish model is declining over time. Many managers have picked up the ability to test the detectability of earnings manipulation tactics by using the model to anticipate analysts’ perceptions.
A and C are incorrect. Quantitative models cannot establish the cause and effect between model variables. They establish only associations between variables. Therefore this is an additional limitation.
Reading 15: Evaluating Quality of Financial Reports
LOS 15 (c) Describe how to evaluate the quality of a company’s financial reports.
Practice financial reporting quality analysis, earnings manipulation detection, ratio-based evaluation, and misreporting assessment techniques with study notes, practice questions, video lessons, and mock exams.
Offered by AnalystPrep


Get Ahead on Your Study Prep This Cyber Monday! Save 35% on all CFA® and FRM® Unlimited Packages. Use code CYBERMONDAY at checkout. Offer ends Dec 1st.