


Skewness
Skewness refers to the degree of deviation from a symmetrical distribution, such as... Read More

The z-test is the ideal hypothesis test to conduct in a normal distribution of a random variable. In addition, the variance of the population must be known. The z-statistic refers to the test statistic computed for hypothesis testing.
Testing H0: μ = μ0 using the z-test
Given a random sample of size n from a normally distributed population with mean μ and variance σ2, and a sample mean X̄, we can compute the z-statistic as:
$$ \text z-\text{statistic} =\cfrac {(\bar{X} – \mu_0)}{\left(\frac {\sigma}{\sqrt n} \right)} $$
Where:
\(\bar{X}\) is the sample mean.
\(μ_0\) is the hypothesized mean of the population.
\(σ\) is the standard deviation of the population.
\(n\) is the sample size.
Once computed, the z-statistic is compared to the critical value that corresponds to the level of significance of the test. For example, if the significance level is 5%, the z-statistic is screened against the upper or lower 95% point of the normal distribution (±1.96). The decision rule is to reject the H0 if the z-statistic falls within the critical or rejection region.
Academics carried out a study on 50 former United States presidents and found an average IQ of 135. You are required to carry out a 5% statistical test to determine whether the average IQ of presidents is greater than 130. (IQs are distributed normally, and previous studies indicate that σ = 25.)
Solution
First, you have to state the hypothesis:
H0: μ = 130
H1: μ > 130
Assuming the H0 is true, \(\frac {(\bar{X} – 130)}{\left(\frac {\sigma}{\sqrt n} \right)} \sim N(0,1)\).
The z-statistic is \(\cfrac {(135 – 130)}{\left(\frac {25}{\sqrt {50}} \right)} = 1.414\).
This is a right-tailed test. Therefore, we compare our test statistic to the upper 95% point of the standard normal distribution (1.6449). Since 1.414 is less than 1.6449, we do not have sufficient evidence to reject the H0. As such, it would be reasonable to conclude that the average IQ of U.S. presidents is not more than 130.
The t-test is based on the t-distribution. The test is appropriate for testing the value of a population mean when:
We compute a t-statistic with n – 1 degrees of freedom as:
$$ t_{n-1} = \cfrac {(\bar{X} – \mu_0)}{\left(\frac {s}{\sqrt n} \right)} $$
Where:
\(\bar{X}\) is the sample mean.
\(μ_0\) is the hypothesized mean of the population.
\(s\) is the standard deviation of the sample.
\(n\) is the sample size.
The annual rate of rainfall (cm) in a certain equatorial country over the last 10 years is given below:
{ 25 26 25 27 28 29 28 27 26 25 }
Financial analysts in the country wish to determine whether the average rate of rainfall has increased from its former value of 23. Carry out a statistical test at the 5% level.
Solution
As always, you should begin by stating the hypothesis:
H0: μ ≤ 23
H1: μ > 23
If we assume that the annual rainfall quantities are distributed normally and recorded independently, then:
$$ \cfrac {(\bar{X} – 23)}{\left(\frac {S}{\sqrt n} \right)} \sim t_{n- 1} $$
Please, confirm that X̄ = 26.6 and S = 1.43.
Therefore, our t-statistic = \(\cfrac {(26.6 – 23)}{\left(\frac {1.43}{\sqrt {10}}\right)} = 7.96\).
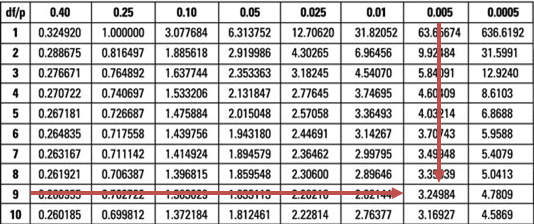
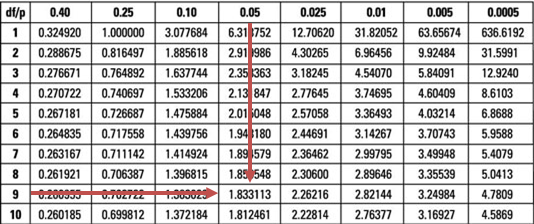
Our test statistic (7.96) is greater than the upper 95% point of the t0.05,9 distribution (1.833).
Therefore, we have sufficient evidence to reject the H0. As such, it is reasonable to conclude that the average annual rainfall has increased from its former long-term average of 23.
Question
What is the value of t in the example above if the level of significance is reduced from 5% to 0.5%, and does this change the decision rule?
- 2.02; it does not change the decision rule.
- 3.25; it does not change the decision rule.
- 3.25; it does change the decision rule.
Solution
The correct answer is B.
A quick glance at the t0.005,9 distribution when α = 0.5% gives a value of 3.25.
However, the evidence against the H0 is too strong since our test statistic (7.96) is still greater than 3.25. As such, the conclusion would remain unchanged.
(Note to candidates: You might also work out the solutions to the above examples and questions using p-values instead of critical values. The decision rules would remain unchanged provided you work out the p-values correctly.)
Practice hypothesis testing, test selection, and statistical inference with CFA Level I exam-style questions.


Get Ahead on Your Study Prep This Cyber Monday! Save 35% on all CFA® and FRM® Unlimited Packages. Use code CYBERMONDAY at checkout. Offer ends Dec 1st.