The Central Limit Theorem
The central limit theorem asserts that “given a population described by any probability... Read More
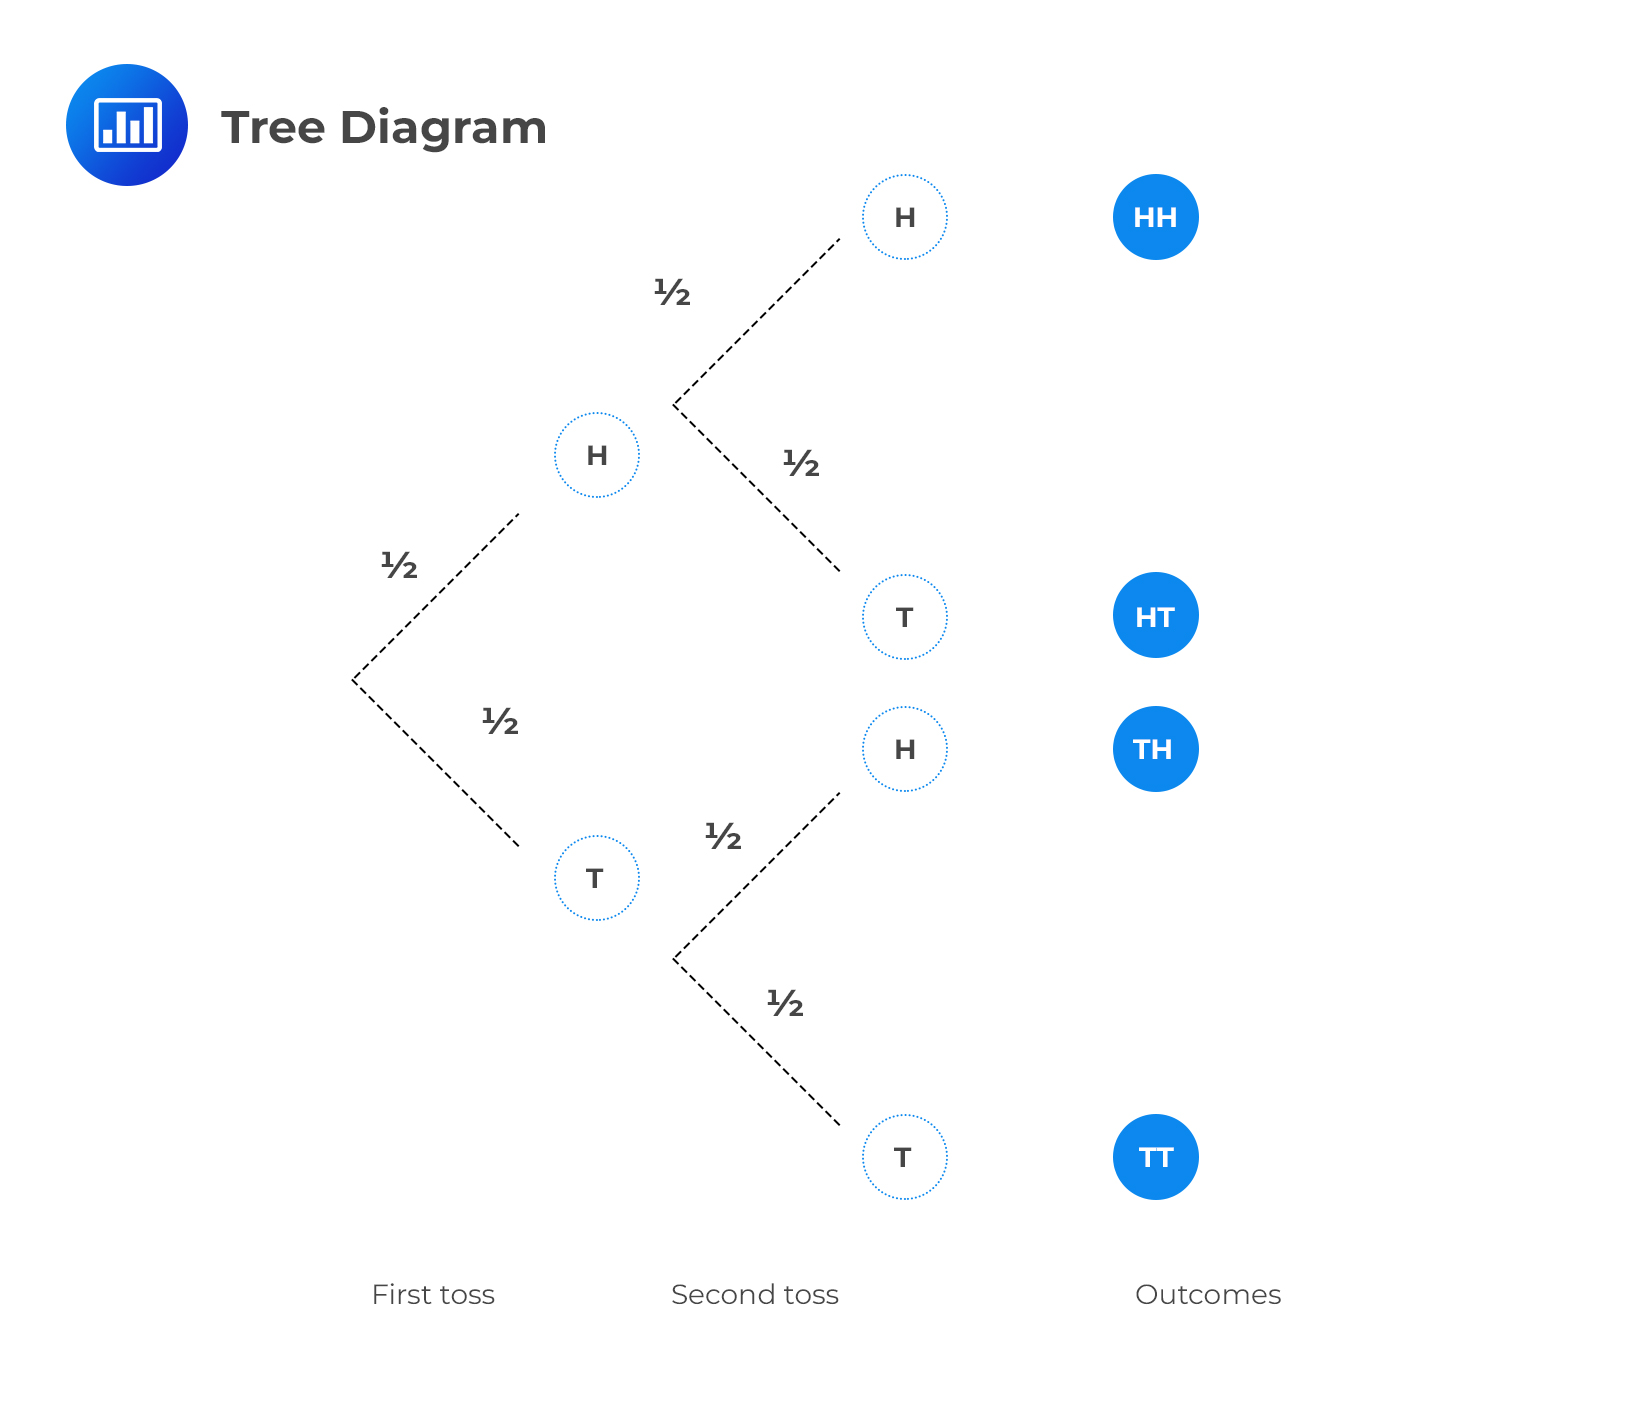
A tree diagram is a visual representation of all possible future outcomes and the associated probabilities of a random variable. Tree diagrams are particularly useful when we have several possible outcomes. They facilitate the recording of all the possibilities in a clear, uncomplicated manner. Each branch in a tree diagram represents an outcome.
Suppose we toss a fair coin twice. The first outcome will not affect the second outcome (the two events are independent). The first toss’ outcome can either be a head or a tail. Similarly, the outcome of the second toss can either be a head or a tail, regardless of the outcome of the first toss, since the coin has no memory! We can represent the probabilities in a tree diagram as follows:

Please, note the following:
To calculate probabilities, we go along the tree branches from left to right to get to the end and then multiply together any probabilities that we have passed. Therefore, the probability of getting two heads, i.e., \(HH\), is:
$$ \begin {align*}
\text P ( \text{HH}) & =\cfrac {1} {2} * \cfrac{1} {2} \\
& = \cfrac {1} {4} \\
\end {align*} $$
If we sum up the probabilities of all possibilities, we get 1. (The candidate can prove this.)
Question
Someone picks a card from an ordinary pack of 52 playing cards, without replacement. He then picks another one. Draw a probability tree and use it to calculate the probability of picking two red cards.
A. \( \frac{25} {102} \)
B. \( \frac{13} {51} \)
C. \( \frac{26} {51} \)
The correct answer is A.
Get Ahead on Your Study Prep This Cyber Monday! Save 35% on all CFA® and FRM® Unlimited Packages. Use code CYBERMONDAY at checkout. Offer ends Dec 1st.