Comparing Probability and Non-Probabil ...
The correlation between two variables measures the strength of the linear relationship between them. We wish to assess this relationship using the correlation coefficient. The assessment is based on whether the relationship occurs by chance or not.
Intuitively, if the correlation coefficient between two variables is zero, then there is no linear relationship between the variables. Otherwise, if we use the test of significance to determine whether there is a linear relationship, we will be inclined to whether the estimated correlation coefficient is significantly different from 0.
The null hypothesis is stated as:
$$H_0:\rho=0$$
That is, the correlation coefficient in the population is 0.
The alternative hypothesis is stated as:
$$H_a:\rho \neq 0$$
That is, the correlation coefficient is not equal to 0. Clearly, the hypothesis test for the correlation is a two-tailed test.
Assuming that the two variables are both normally distributed, the test statistic is given by:
$$ t=\frac{r\sqrt{n-2}}{\sqrt{1-r^2}}$$
Where
\(r\) = Sample Correlation.
\(n\) = Sample size.
The test statistic has a t-distribution with n-2 degrees of freedom (only if the null hypothesis is true). Let the critical value from the t-distribution table be \(t_c\). If the test statistic is greater than \(t_c\) or less than \(-t_c\), we reject the null hypothesis and uphold the alternative hypothesis. Otherwise, we fail to reject the null hypothesis.
A financial analyst wishes to test whether there is a linear relationship in the data used to analyze the stock return for a particular company. The analyst uses a sample size of 32 which has a sample correlation of 0.45. Calculate the test statistic and test the significance at the 5% significance level.
Solution
We know that the test statistic is given by:
$$ t=\frac{r\sqrt{n-2}}{\sqrt{1-r^2}}=\frac{0.45\sqrt{32-2}}{\sqrt{1-0.45^2}}=2.760$$
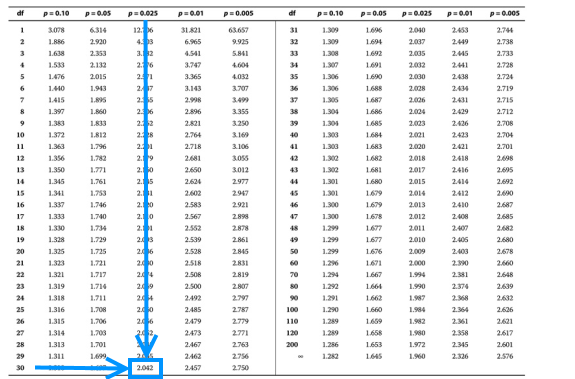
We need to evaluate the critical value from the t-distribution table. From the information given in the question, the number of degrees of freedom is 32-2=30 so that the crucial value is given by:
$$ t_{\frac{0.05}{2},32-2}= t_{0.025,30}=2.042$$

Since the test statistic is greater than the critical value (2.760>2.042), we reject the null hypothesis that the population correlation coefficient is 0, and thus, the correlation coefficient is significantly different from 0.
Question
The sample correlation between the US dollars (USD) monthly returns to Britain euros (EUR) is estimated to be 0.4565. This estimate is from sample data from January 2015 to December 2019. Assume you are an analyst; would you reject the null hypothesis that the population correlation equals to 0 and 5% significance level?
A. Yes.
B. No.
C. Not enough information to decide.
Solution
The correct answer is A
We need first to determine the sample size, n. From Jan 2015 to Dec 2019, we have five years which is equivalent to 60 months. From here, we can compute the test statistic.
$$ t=\frac{r\sqrt{n-2}}{\sqrt{1-r^2}}=\frac{0.4565\sqrt{60-2}}{\sqrt{1-0.4565^2}}=3.908$$
Using the t-distribution table, the critical value is given by:$$ t_{\frac{0.05}{2},60-2}= t_{0.025,58}=2.000$$
Since the test statistic is larger than the critical value, we reject the null hypothesis that the population correlation coefficient is 0.
Get Ahead on Your Study Prep This Cyber Monday! Save 35% on all CFA® and FRM® Unlimited Packages. Use code CYBERMONDAY at checkout. Offer ends Dec 1st.