


Calculation and Interpretation of Conf ...
Confidence interval (CI) refers to a range of values within which statisticians believe... Read More

The decision rule refers to the procedure followed by analysts and researchers when deciding whether to reject or not to reject a null hypothesis. We use the phrase “not to reject” because it is considered statistically incorrect to “accept” a null hypothesis. Rather, we can only assemble enough evidence to support it.
The decision to reject or not reject a null hypothesis is based on the distribution the test statistic assumes. This means that if the variable involved follows a normal distribution, we use the level of significance of the test to come up with critical values that lie along the standard normal distribution.
Note that prior to decision making, one must consider whether the test should be one-tailed or two-tailed. This is because the number of tails determines the value of α (significance level). The following is a summary of the decision rules under different scenarios.
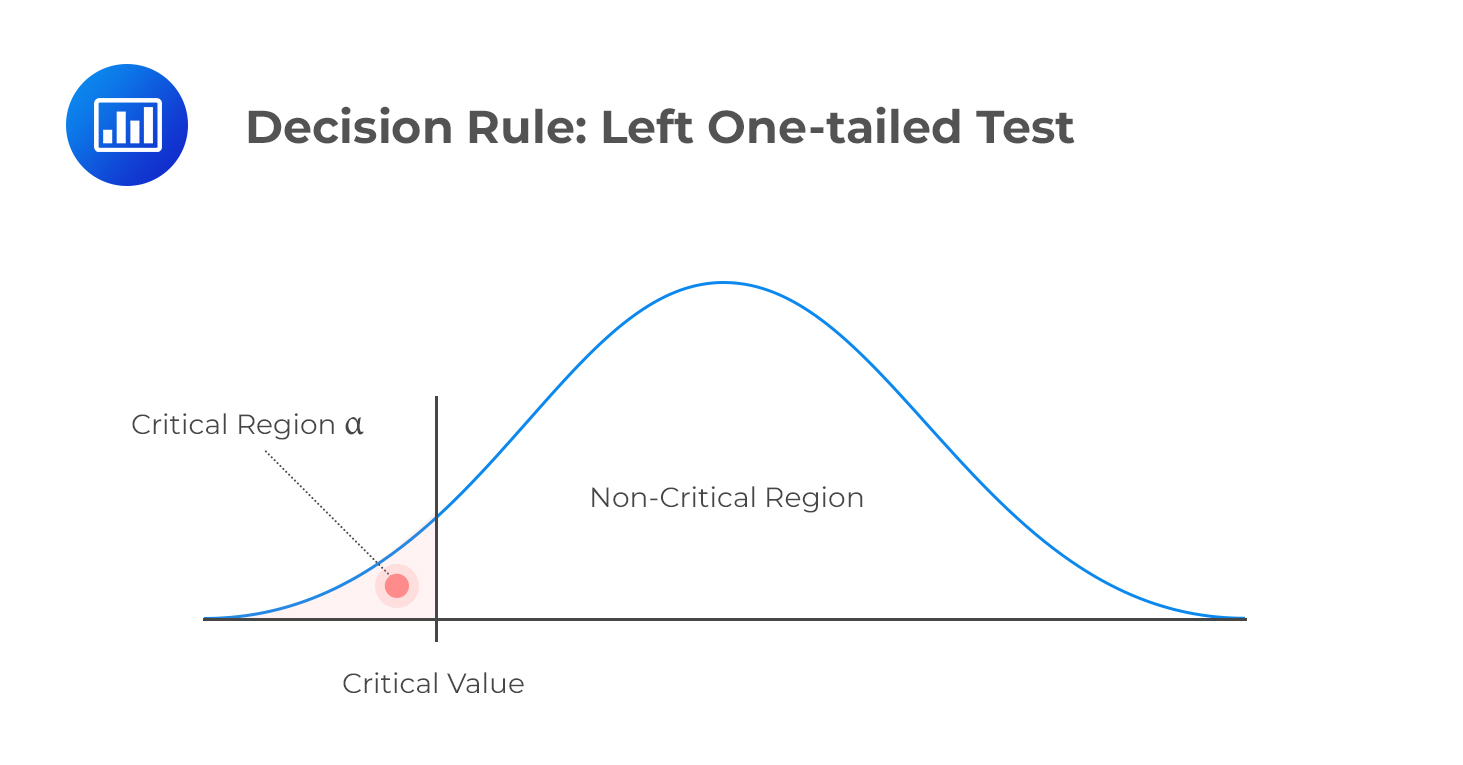
H1: parameter < X
Decision rule: reject H0 if the test statistic is less than the critical value. Otherwise, do not reject H0.
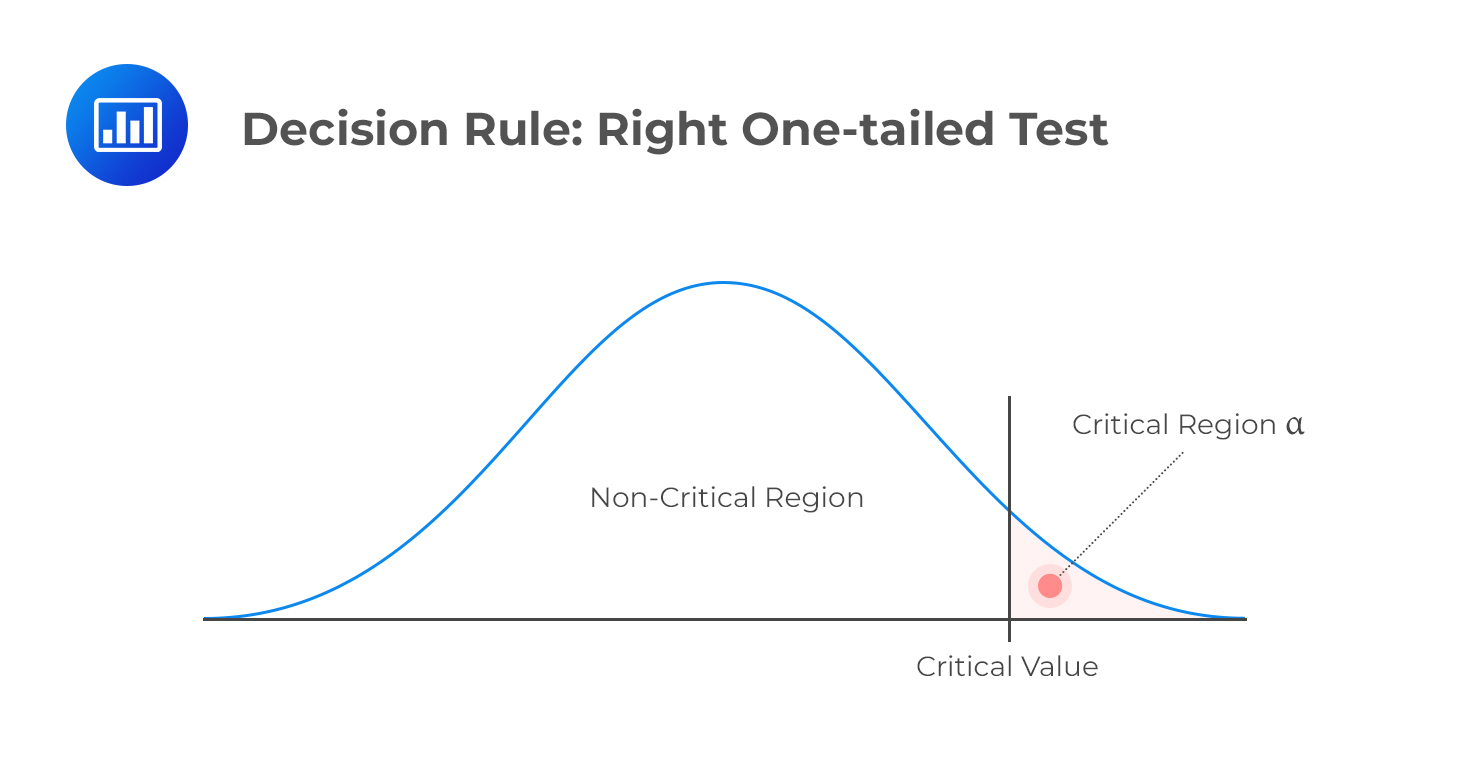
H1: parameter > X
Decision rule: reject H0 if the test statistic is greater than the critical value. Otherwise, do not reject H0.
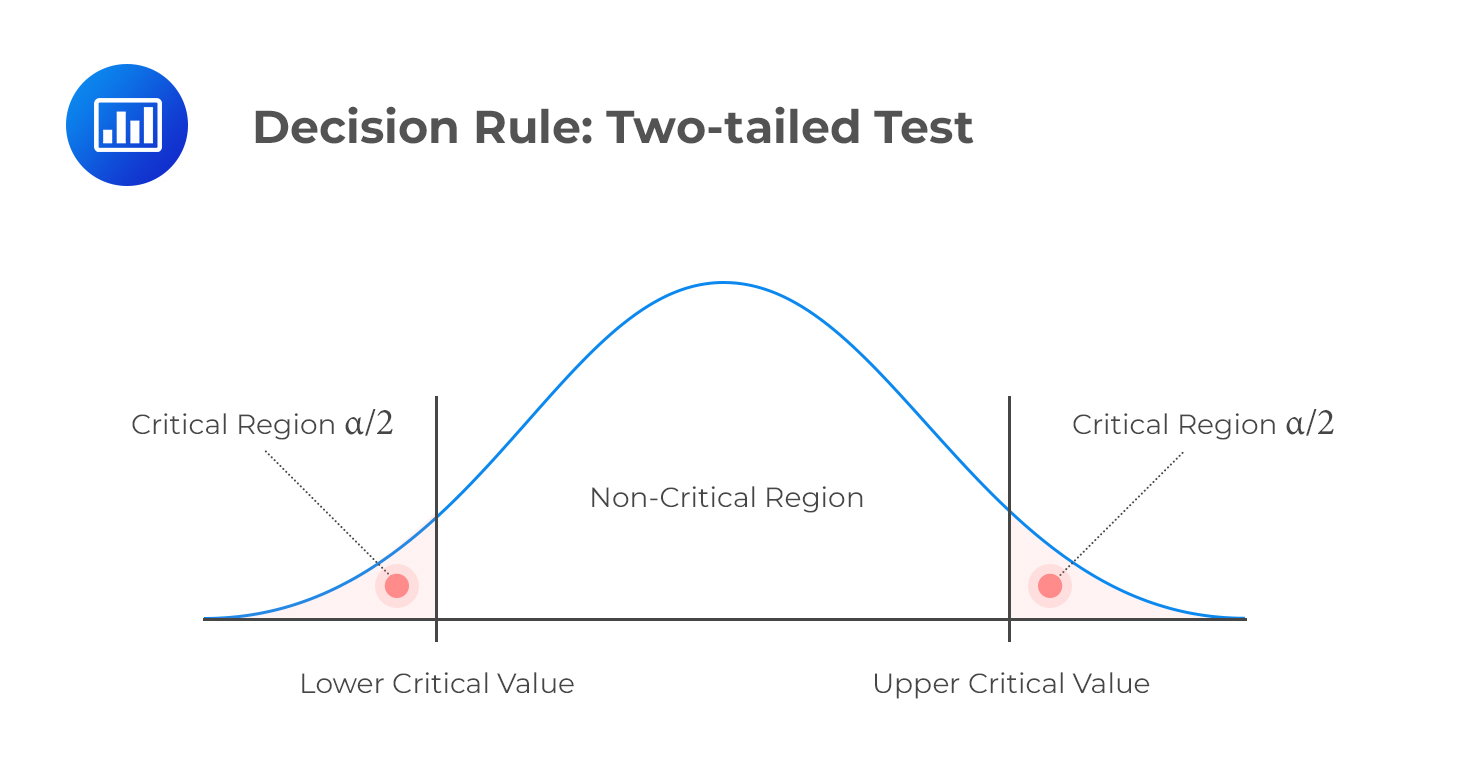
H1: parameter ≠ X (not equal to X)
Decision rule: reject H0 if the test statistic is greater than the upper critical value or less than the lower critical value.
The power of a test is the direct opposite of the level of significance. While the level of significance gives us the probability of rejecting a null hypothesis when it is, in fact, true, the power of a test gives the probability of correctly discrediting and rejecting a null hypothesis when it is false. In other words, it gives the likelihood of rejecting a H0 when indeed, it is false. Expressed mathematically,
$$ \text{Power of a test} = 1 – P(\text{type } II \text{ error}) $$
When presented with a situation where there are multiple test results for the same purpose, it is the test with the highest power that is considered the best.
Critical values link confidence intervals and hypothesis tests. For example, to construct a 95% confidence interval assuming a normal distribution, we would need to determine the critical values that correspond to a 5% significance level. Similarly, if we were to conduct a test of some given hypothesis at the 5% significance level, we would use the same critical values used for the confidence interval to subdivide the distribution space into rejection and non-rejection regions.
A survey carried out using a sample of 50 CFA Level I candidates reveals an average IQ of 105. Assuming that IQs are distributed normally, carry out a statistical test to determine whether the mean IQ is greater than 100. You are instructed to use a 5% level of significance. (Previous studies give a standard deviation of IQs of approximately 20.)
Solution
First, state the hypothesis:
H0: μ = 100 vs H1: μ > 100
Since IQs follow a normal distribution, under \(H_0, \frac {(X’ – 100)}{\left( \frac {\mu}{\sqrt n} \right)} \sim N(0,1)\)
Next, we compute the test statistic, which is \(\frac {(105 – 100)}{\left(\frac {20}{\sqrt {50}} \right)} = 1.768\)
This is a right one-tailed test, and IQs are distributed normally. Therefore, we should compare our test statistic to the upper 5% point of the normal distribution.
From the normal distribution table, this value is 1.6449. Since 1.768 is greater than 1.6449, we have sufficient evidence to reject the H0 at the 5% significance level. Therefore, it is reasonable to conclude that the mean IQ of CFA candidates is greater than 100.
(Note the choice of words used in the decision-making part and the conclusion.)
Question
Use data from the previous example to carry out a test at 5% significance to determine whether the average IQ of candidates is greater than 102.
- There is sufficient evidence to reject the H0 and conclude that the average IQ is greater than 102.
- There is insufficient evidence to reject the H0 and therefore it is reasonable to conclude that the average IQ is not more than 102.
- There is sufficient evidence to reject the H0 and therefore it is reasonable to conclude that the average IQ is greater than 102.
Solution
The correct answer is B.
Just like in the example above, start with stating the hypothesis;
H0: μ = 100 vs. H1: μ > 102
The test statistic is \(\frac {(105 – 102)}{\left( \frac {20}{\sqrt{50}} \right)} = 1.061\)
Again, this is a right one-tailed test. 1.061 is less than the upper 5% point of a standard normal distribution (1.6449). Therefore, we do not have sufficient evidence to reject the H0 at the 5% level of significance. It is, therefore, reasonable to conclude that the average IQ of CFA candidates is not more than 102.


Get Ahead on Your Study Prep This Cyber Monday! Save 35% on all CFA® and FRM® Unlimited Packages. Use code CYBERMONDAY at checkout. Offer ends Dec 1st.