


Risk Budgeting
Risk budgeting focuses on the implementation of the risk tolerance decisions approved by... Read More

Technical analysis indicators are measures used to predict changes in the price of a security. These predictions are based on price, market sentiment, or flow of funds. Technical analysts try to establish how potential changes in supply and demand might impact the price of a security.
We can categorize technical analysis indicators into three groups. These are:
Price-based indicators combine information relating to both the current and the past price history. Forms of price-based indicators include:
A moving average refers to the closing price of security averaged over a specified number of time periods. It is the mean of the last n closing prices. They are useful since they smooth out price fluctuations occurring in the short term, hence giving analysts a clearer idea of the trend exhibited by a market.
The simple moving average places equal weights on both past and current prices, while an exponential moving average gives less weight to older prices and more weight to recent prices.
When calculating the moving average for one month, the accepted value of n is 20 days. A 3-month moving average may comprise 60 days.
Two or more moving averages can be used concurrently. A 5-day moving average could be used for short-term movements, while a 20 or 60-day moving average could be used for medium-term movements. The longer the time frame used to create the moving average, the smoother the moving average line will be.
Some concepts related to moving averages are:
Bollinger bands are made up of a moving average middle band, an upper band, and a lower band. The upper and lower bands are the moving average plus and less some standard deviations, respectively. This indicator can assist in determining a statistically appropriate trading range for the market.
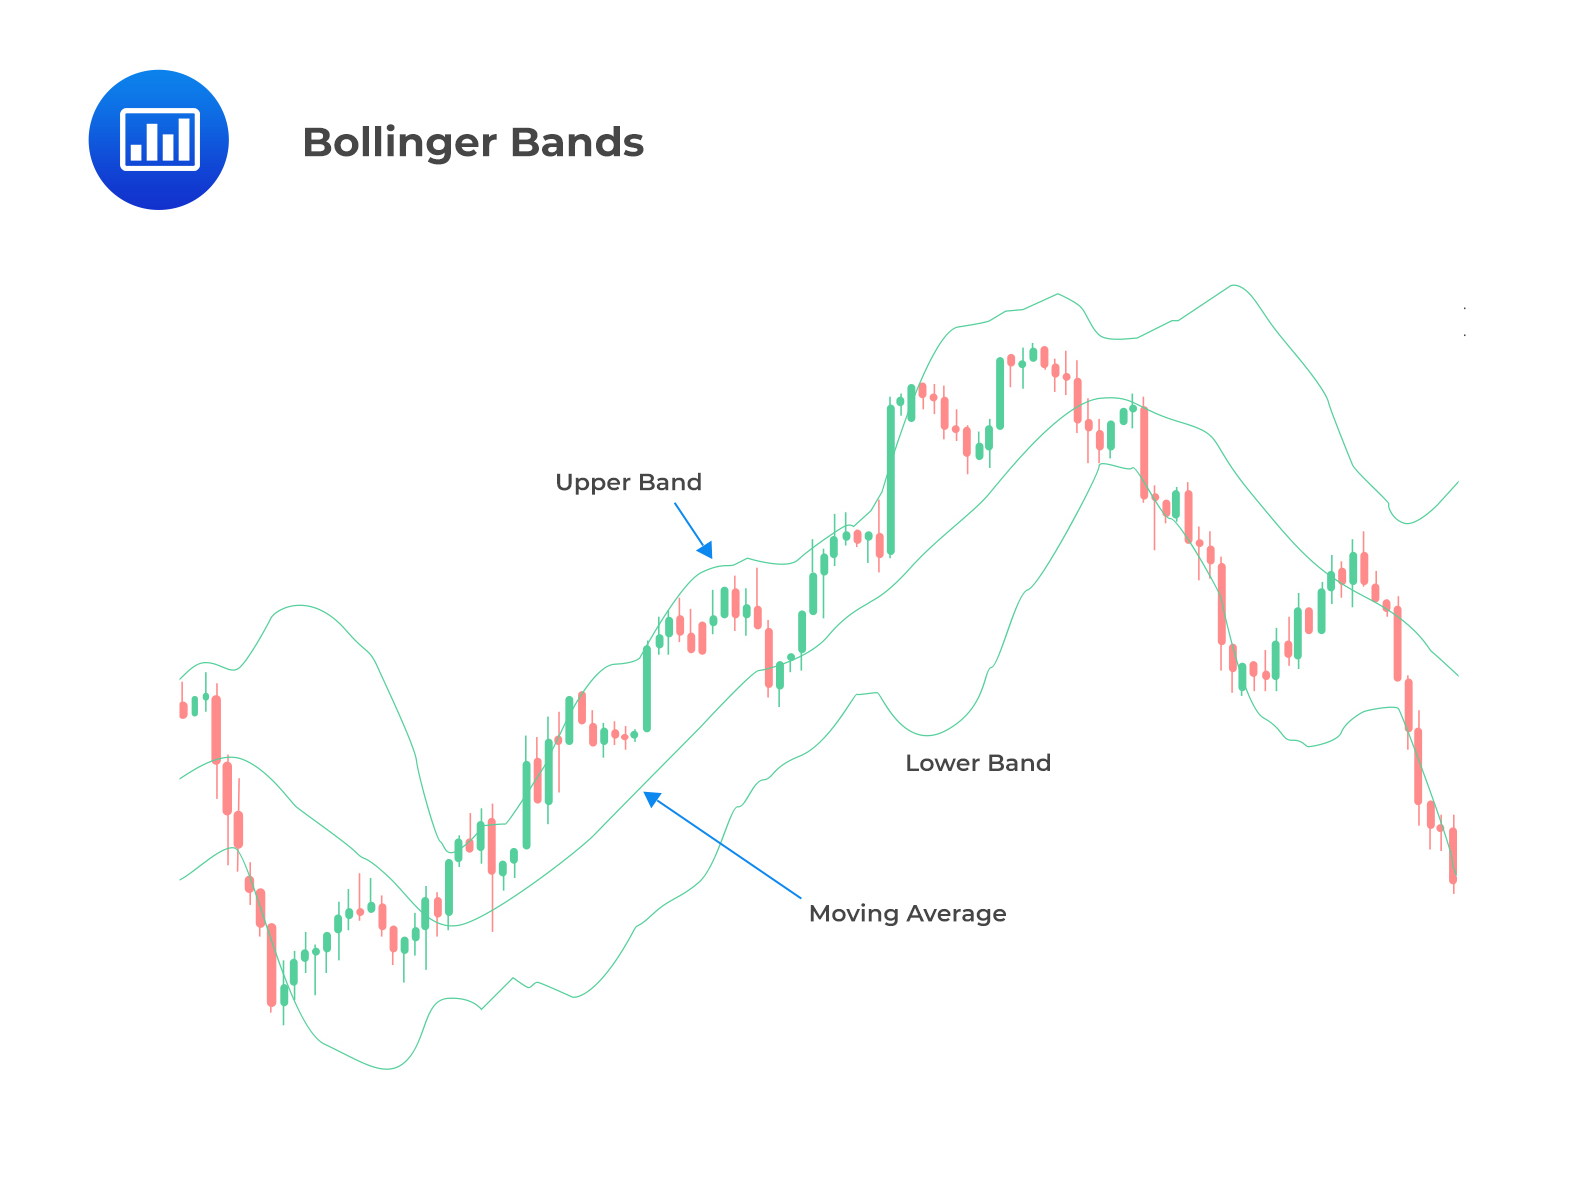
Prices above the higher line may indicate overbuying. Prices below the lower line may, on the other hand, indicate an oversold market. A strategy that yields optimum returns may entail buying when the price is at the lower band and selling when it’s at the higher band.
Bollinger Band width is a Bollinger Bands-derived indicator. It calculates the difference in percentage between the upper and lower bands.
$$ \text{Bollinger Bandwidth} = \frac{\text{(Upper band – Lower band)}}{\text{Middle band}} × 100 $$
Falling bandwidth reflects decreasing volatility while rising bandwidth reflects increasing volatility.
Momentum oscillators, also called rate of change oscillators, are computed by taking the most recent closing price, subtracting the closing price recorded on a specified trading day in the past, and finally multiplying the result by a factor of 100:
$$ M = (V – V_x)100 $$
Where:
\(M\) = Momentum oscillator.
\(V\) = Most recent closing price.
\(V_x\) = Closing price as at a specified date in the past, say 10 days ago.
It is common to find market participants buying when the oscillator shifts from positive to negative during an uptrend. Alternatively, they may sell when the oscillator shifts from positive to negative during a downtrend.
Oscillators can be used to:
The Stochastic Oscillator is a technical indicator that compares a security’s most recent closing price to its highest and lowest prices over a given time period. It provides readings that fluctuate between zero and 100 to indicate a security’s momentum. Stochastic oscillators are used to identify overbought and undersold levels. Besides, they show points where the fast stochastic line and the slow stochastic line intersect. A major drawback of the stochastic oscillator is giving false signals, especially during periods of volatile trading conditions. The stochastic oscillator has a default setting of 14-days.
The stochastic oscillator is composed of two lines, called %K and %D, calculated as follows:
$$\%K=100\left(\frac{C-L14}{H14-L14}\right)$$
Where:
\(C\) = Latest closing price.
\(L14\) = Lowest price in the past 14 days.
\(H14\) = Highest price in the past 14 days.
\(%D\) = Average of the last three %K values calculated daily.
When the \(%K\) moves from below the \(%D\) line to above it, it reflects a bullish signal. On the other hand, when \(%K\) moves from above the \(%D\) line to below it, this pattern reflects a bearish signal.
The moving-average convergence/divergence oscillator (commonly referred to as the MACD) is the difference between short-term (i.e., 12 days) and long-term moving averages (i.e., 26 days) of the security’s price. It is constructed by calculating two lines, the MACD line and the signal line. MACD oscillates around zero and has no upper or lower limit. When the MACD is trending in the same direction as the price, this pattern reflects convergence, and when the two are trending in opposite directions, the pattern reflects divergence.
The MACD can be used in technical analysis to:
The RSI measures both the speed and the rate of change in market price movements. The RSI oscillator’s values, which are usually monitored over a 14-day period, oscillate between zero and 100. When the Relative Strength Index falls below 30, it suggests oversold market conditions, and when it rises above 70, it shows overbought market conditions. It is calculated as follows:
$$RSI=100-\frac{100}{1+RS}$$
Where,
$$S=\frac{\sum(Up\ changes\ for\ the\ period\ under\ consideration)}{\sum(Down\ changes\ for\ the\ period\ under\ consideration)}$$
Sentiment indicators comprise a range of periodic polls conducted with the aim of sampling the sentiments of individual investors or investment professionals about the equity market.
There are two types of sentiment indicators:
Question
Which of the following is least likely a momentum oscillator?
- Bollinger Bands.
- Relative Strength Index (RSI).
- Moving-average Convergence/Divergence Oscillator (MACD).
Solution
The correct answer is A.
Bollinger bands are price-based indicators.
B and C are incorrect. MACD and RSI are momentum oscillators and not price-based indicators.
Prepare for CFA Level I by evaluating price based technical indicators such as moving averages and Bollinger Bands.


Get Ahead on Your Study Prep This Cyber Monday! Save 35% on all CFA® and FRM® Unlimited Packages. Use code CYBERMONDAY at checkout. Offer ends Dec 1st.