


Financial and Non-financial Sources of ...
Financial risks originate from financial markets and might arise from changes in share... Read More

CAPM can be extended to a number of areas. It provides additional applications beyond the estimation of security returns. A key area is in performance evaluation, where a number of commonly used metrics are employed.
Various computable performance metrics are extensions of CAPM. These metrics allow for the assessment of portfolio performance and evaluation. Active managers are expected to perform better than their passive counterparts or to, at least, cover the costs of active management. There are four ratios commonly used in performance evaluation. All measures assume that the benchmark market portfolio is the correct one, and if it is not, it may make results inaccurate. The benchmark should be appropriate for the portfolio being measured. Besides, it should exhibit similar characteristics. We shall see these performance measures in detail in the next LOS.
The CAPM assumes that investors have homogeneous expectations, are rational and risk-averse, and assign the same value to all assets to create the same risky market portfolio. If investors are heterogeneous, their different beliefs could result in a valuation or price for a security that is different from the CAPM-calculated price. The CAPM-calculated price is the current market price because it reflects the beliefs of all other investors in the market. An investor’s estimated price can sometimes be higher than the current market price. Such a circumstance should inform the investor’s decision to buy the asset because it is considered undervalued by the market.
A Jensen’s alpha for individual securities can also be computed with positive values. This indicates that the security is likely to outperform the market on a risk-adjusted basis.
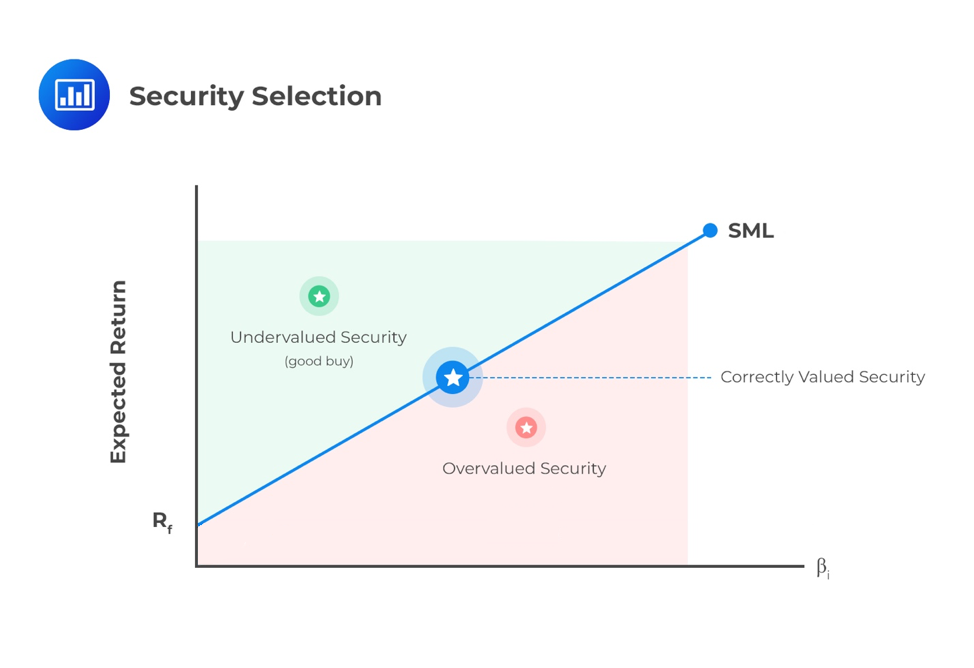
A Security Market Line (SML) can present similar information on a graph. The expected return and beta for security can be assessed against the SML with undervalued securities relative to market consensus appearing above the SML. The securities overvalued relative to market consensus will appear below the SML.
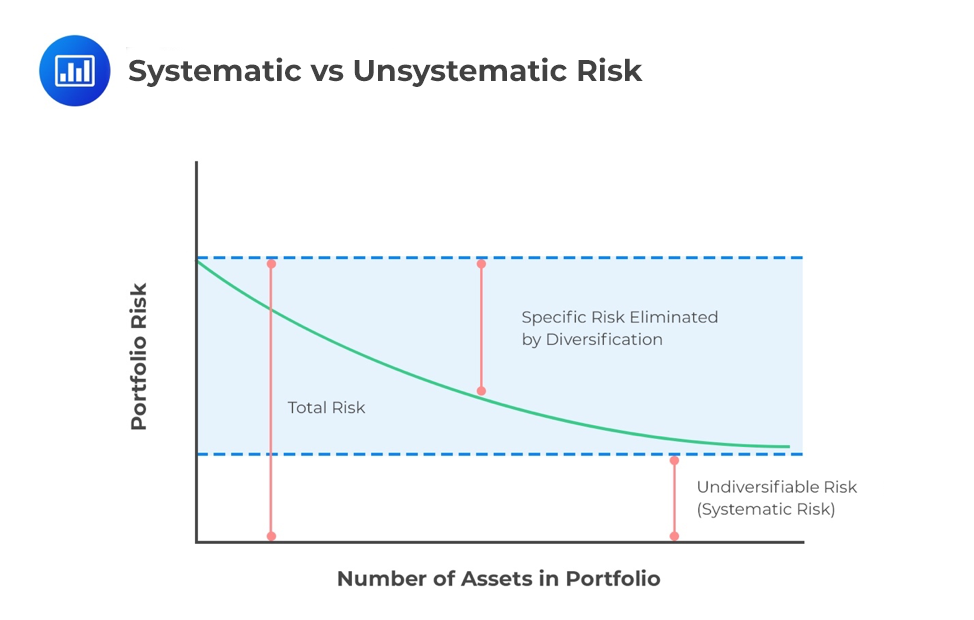
CAPM suggests that investors should hold a market portfolio and a risk-free asset. The true market portfolio consists of a large number of securities, and it may not be practical for an investor to own them all. Much of the non-systematic risk can be diversified by holding 30 or more individual securities. However, these securities should be randomly selected from multiple asset classes. An index may serve as the best method of creating diversification.
It is important to note that only non-systematic risk can be eliminated through the addition of different securities into the portfolio. Systematic risk – the risk inherent to the entire market – cannot be diversified.
Securities not included within the index can be evaluated relative to the index to determine their suitability for portfolio inclusion. The alpha and beta of the security can be estimated relative to the index, and those with a positive alpha should be included. The same exercise can be conducted for securities within the index – those with negative alphas relative to the index should be excluded or sold short.
To determine the weight of each security within a portfolio, those securities with higher alpha should be given more weight. Nonetheless, this weight should be proportional to the alpha divided by the security’s non-systematic variance (risk).
The CAPM is subject to theoretical and practical implications. From a theoretical perspective, it is both a single-factor and single-period model. There may be other factors over multi-time periods that would be more appropriate in modeling expected returns. Practically, the following are the limitations:
Question
An overvalued security would most likely plot:
A. Below the Security Market Line (SML).
B. On the Security Market Line (SML).
C. Above the Security Market Line (SML).
Solution
The correct answer is A.
Securities overvalued, relative to market consensus, will appear below the SML. On the other hand, securities undervalued, relative to market consensus, will appear above the SML. Securities correctly priced will appear directly on the SML.


Get Ahead on Your Study Prep This Cyber Monday! Save 35% on all CFA® and FRM® Unlimited Packages. Use code CYBERMONDAY at checkout. Offer ends Dec 1st.