


Behavioral Finance and Market Behaviour
Some persistent market patterns such as momentum, value, bubbles, and crashes impact market... Read More

A chart pattern is a distinct trading formation that appears repeatedly. It can be used to predict future price movements of a given stock. The formations appear on price charts and create unique, recognizable shapes. Analysts study these formations when trying to predict the future course of prices. The patterns reveal the collective psychological relationships within a market at a given time. There are two major types of chart patterns, i.e., reversal patterns and continuation patterns. Let’s take a look at what the two entail.
A reversal pattern indicates that a prior trend is likely to reverse once the pattern is complete. The term ‘reversal’ actually refers to the trend of a stock prior to the development of the pattern. In fact, for a pattern to have any predictive value, the it must be preceded by a clear, distinguishable trend. Caution is necessary when trying to identify patterns for the purpose of price prediction. Perhaps the most useful and widely recognized reversal pattern is the head-and-shoulders pattern.
As the name suggests, the head-and-shoulders pattern has three distinctive parts. It appears in form of a peak (left shoulder), followed by a higher peak (head), and then a lower head (right shoulder). When the lowest points of the two troughs are connected, they form what analysts call a “neckline.” This type of pattern is preceded by an uptrend.
As the name suggests, the head and shoulders pattern has 3 distinctive parts. It appears in form of a peak (left shoulder), followed by a higher peak (head), and then a lower head (right shoulder). When the lowest points of the two troughs are connected, they form what analysts call a “neckline.” This type of pattern is preceded by an uptrend.
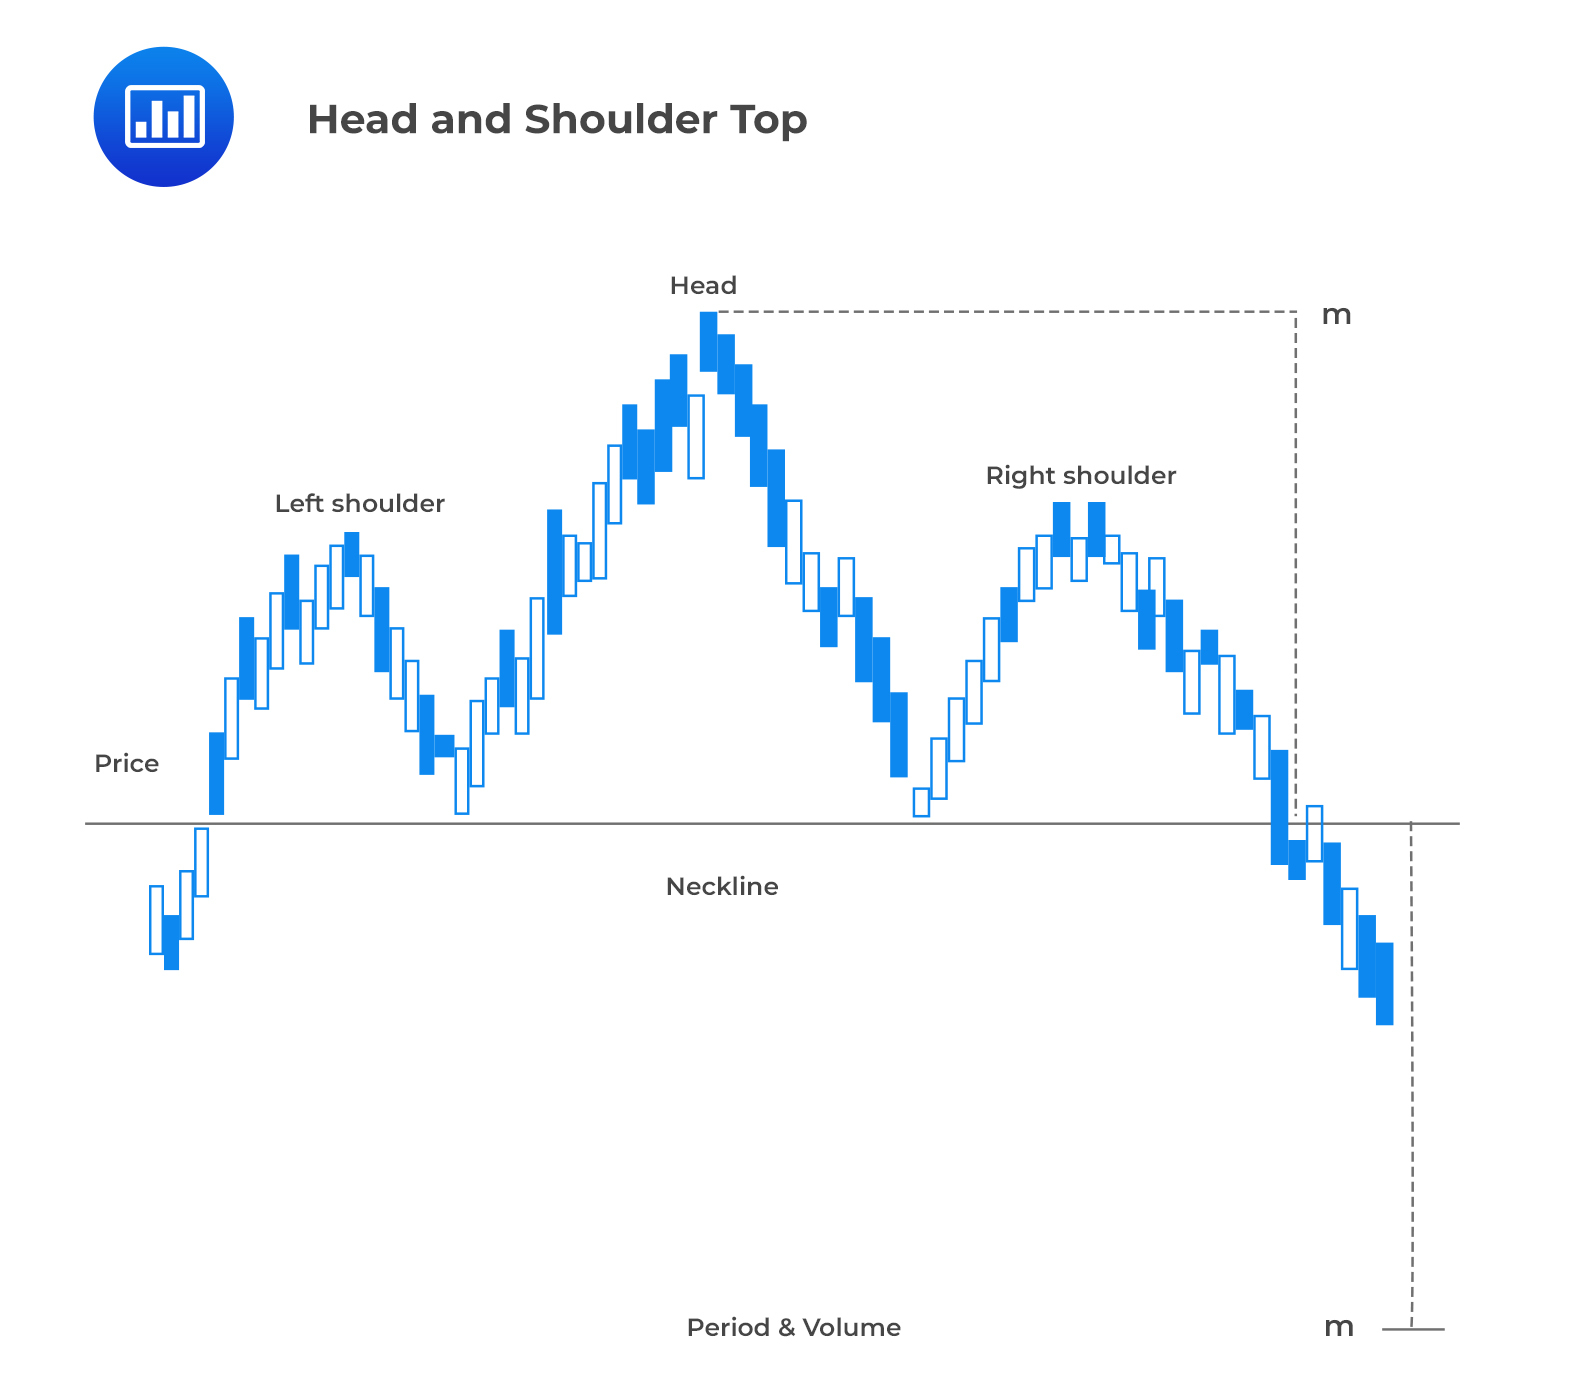
The three parts of the pattern are as follows:
The head doubles up as the second peak and the highest point in the pattern. Neither the left shoulder nor the right one exceeds the head. In an attempt to profit from a security that exhibits a head-and-shoulders pattern, technicians set a price target equal to:
$$ \text{Price target} = \text{Neckline} – (\text{Head} – \text{Neckline}) $$
Investors should anticipate the price target and close the investment at that point. Eying even higher returns beyond the price target almost always results in lesser returns.
In addition, there are head and shoulders patterns preceded by downtrends called inverse head and shoulders which can be analyzed the same way as the reversal ones.
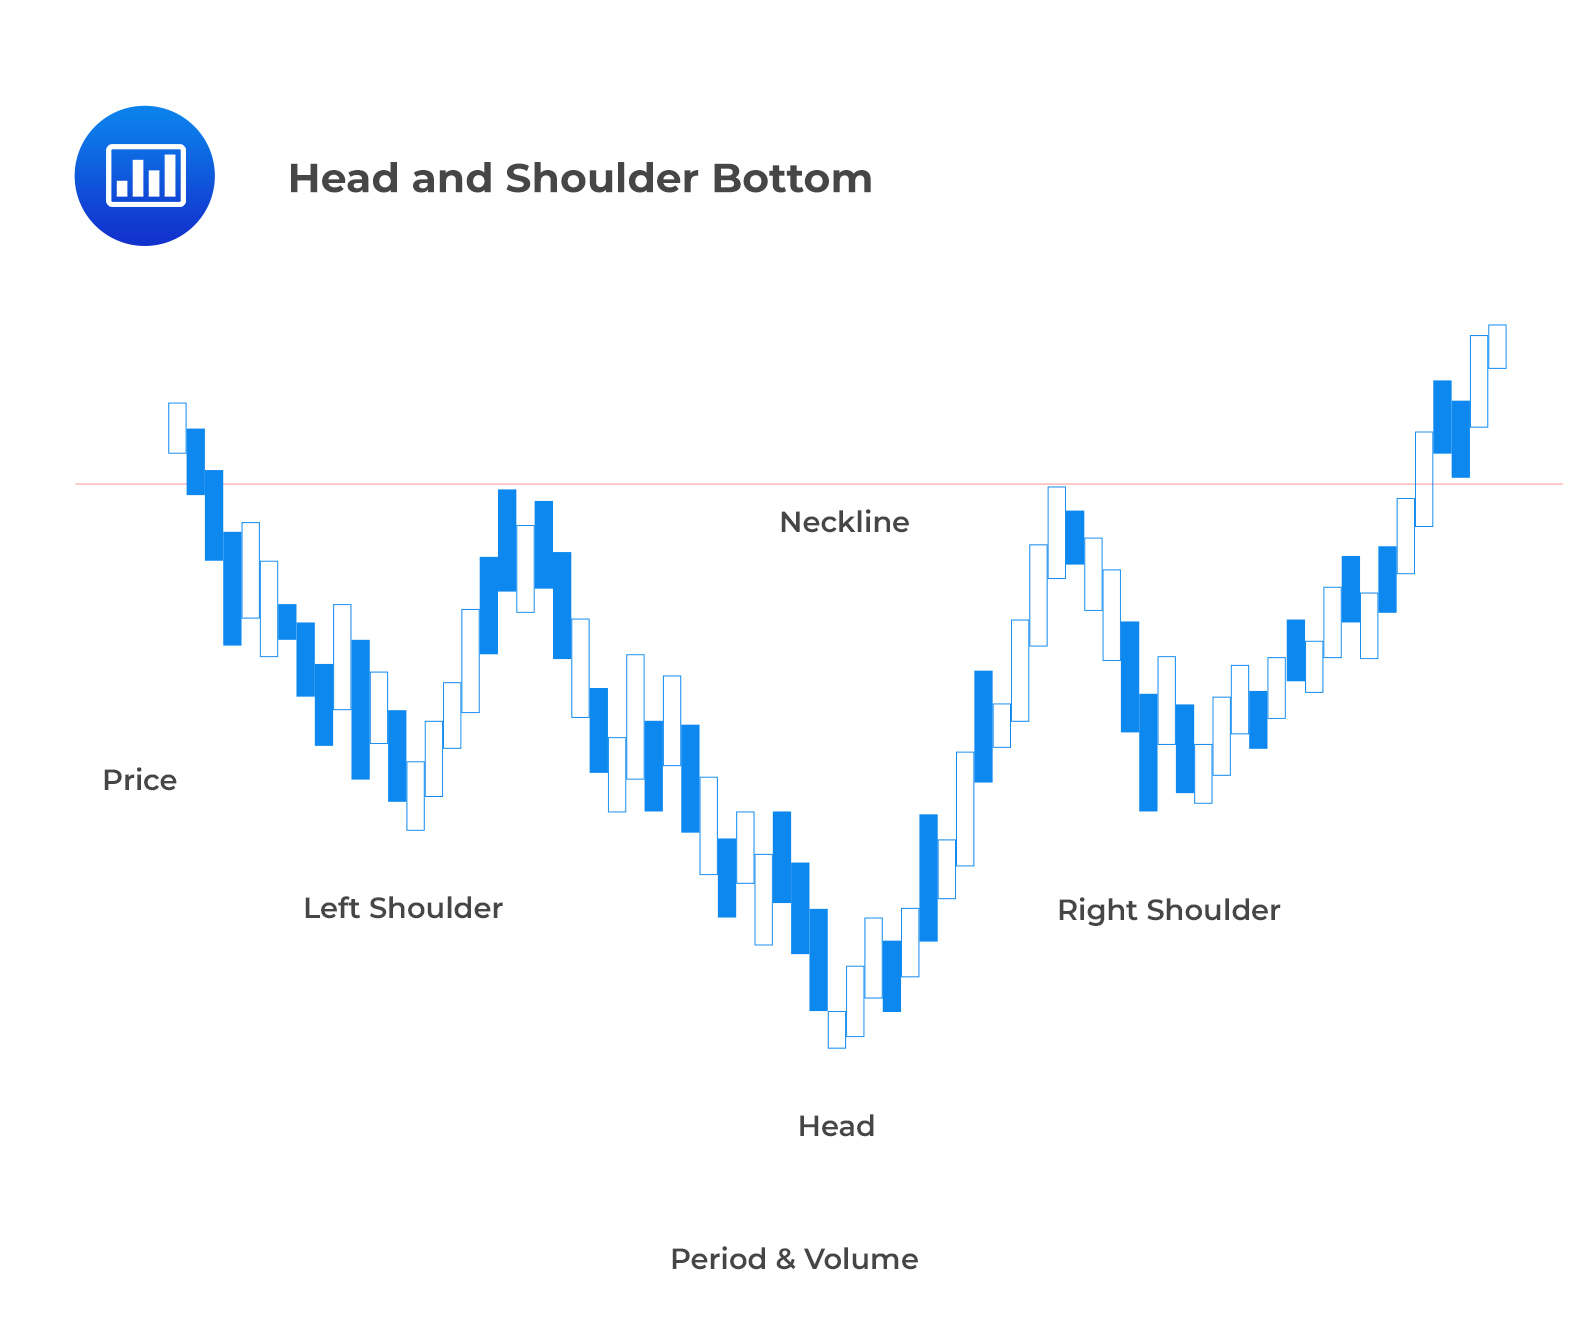
The three parts of the inverse head and shoulders are as follows:
In an inverse head and shoulders pattern, the price target is calculated as follows
$$\text{Price target = Neckline + (Neckline – Head)}$$
It calculates how high the price is expected to rise once it breaches the neckline.
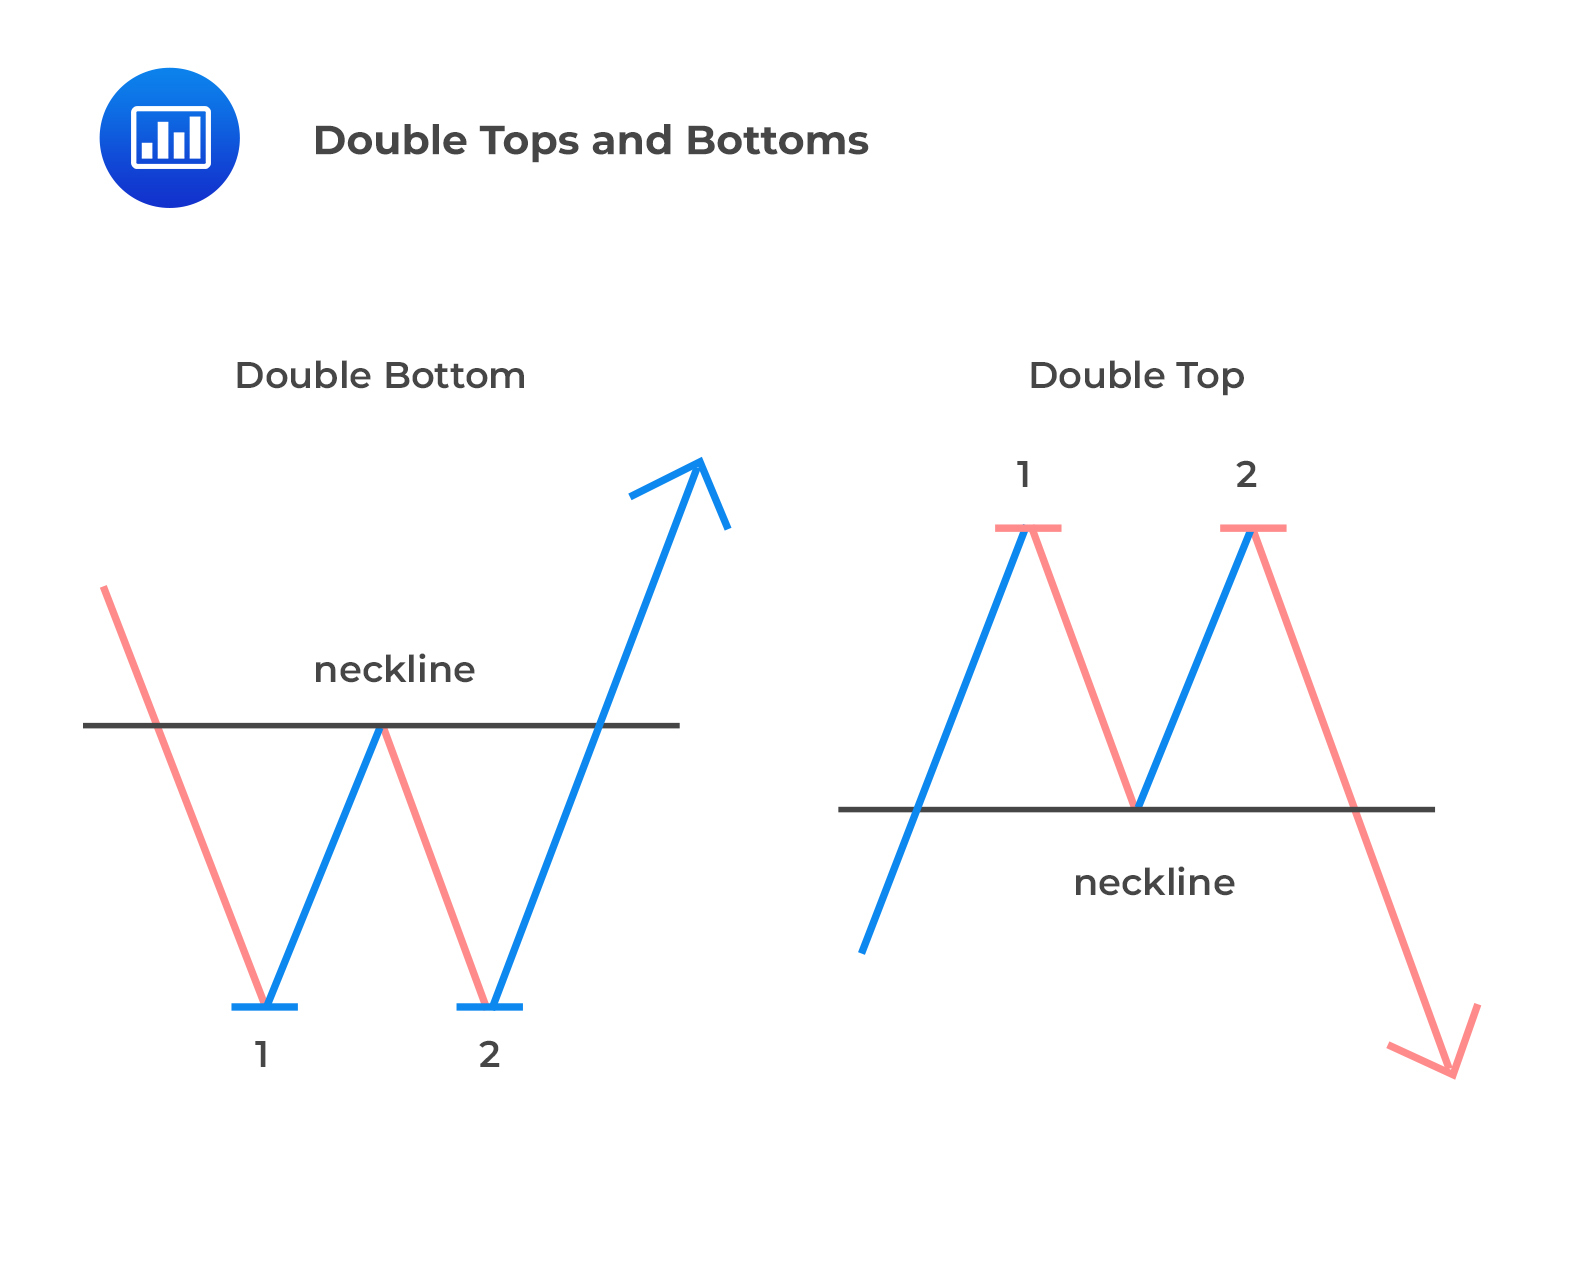
Other reversal patterns include double top, double bottom, and triple bottom patterns.
Double top is formed when an asset gets to a high price two consecutive times with a moderate decline between the two highs. This pattern is confirmed once the price of the asset falls below a specific support level equal to the low between the two prior highs. Here, the volume is lower on the second high than on the first high, signaling diminishing demand. The pattern is considered to be more significant when the time between the tops is longer and the sell-off of the first top is deep. A double top is a very bearish technical reversal pattern.
In double bottom, the price reaches low, reverts and then declines to the initial low level. This pattern is confirmed when the price must move above the high swing that occurred between the two lows. In double bottom, the neckline is horizontal and touches the minor high between two major troughs.
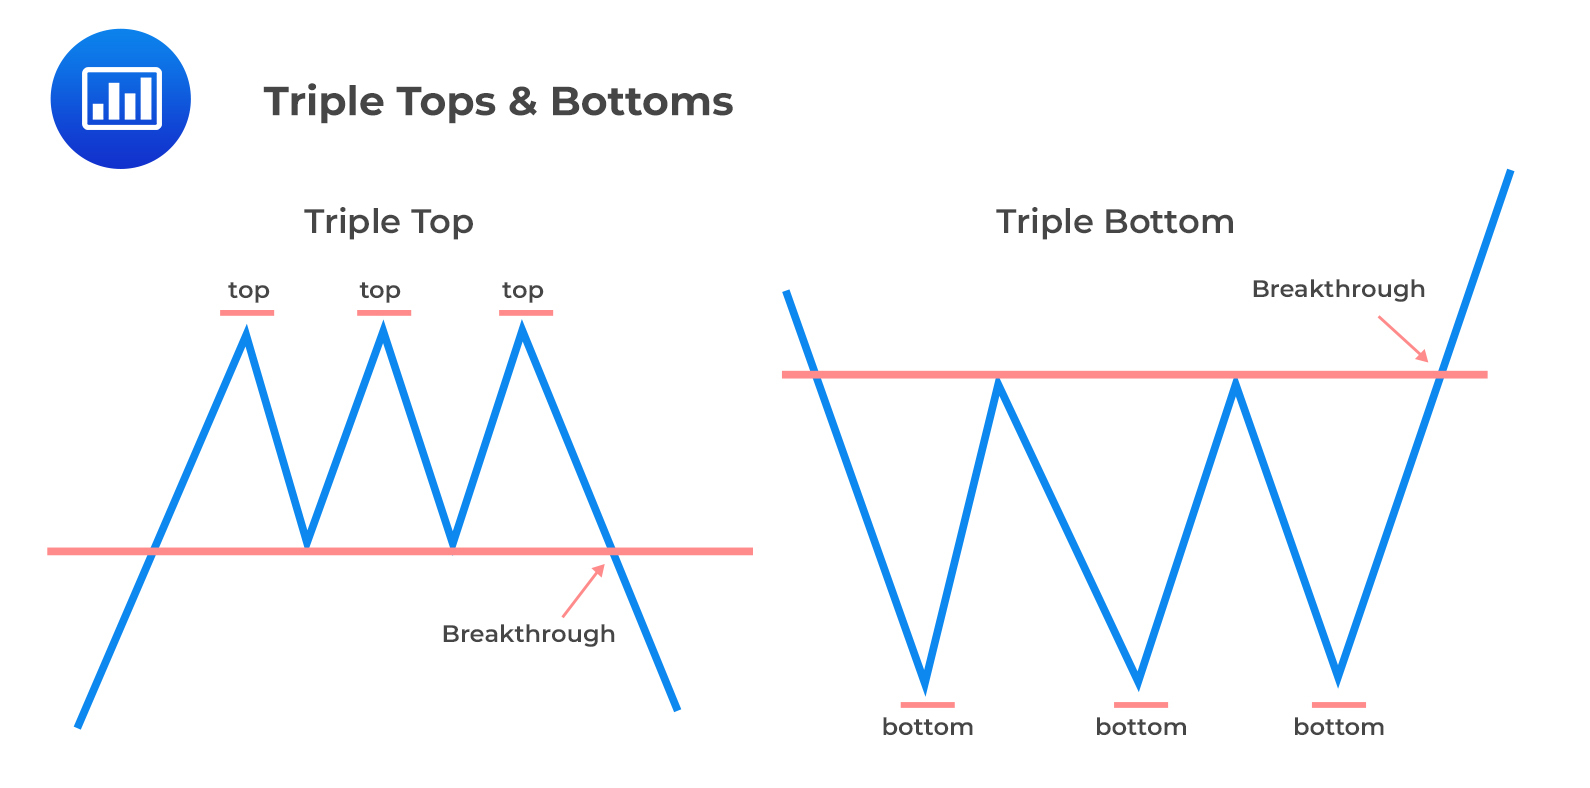
Triple top is made up of three peaks at approximately same price level. Triple bottom is made up of three troughs at app.
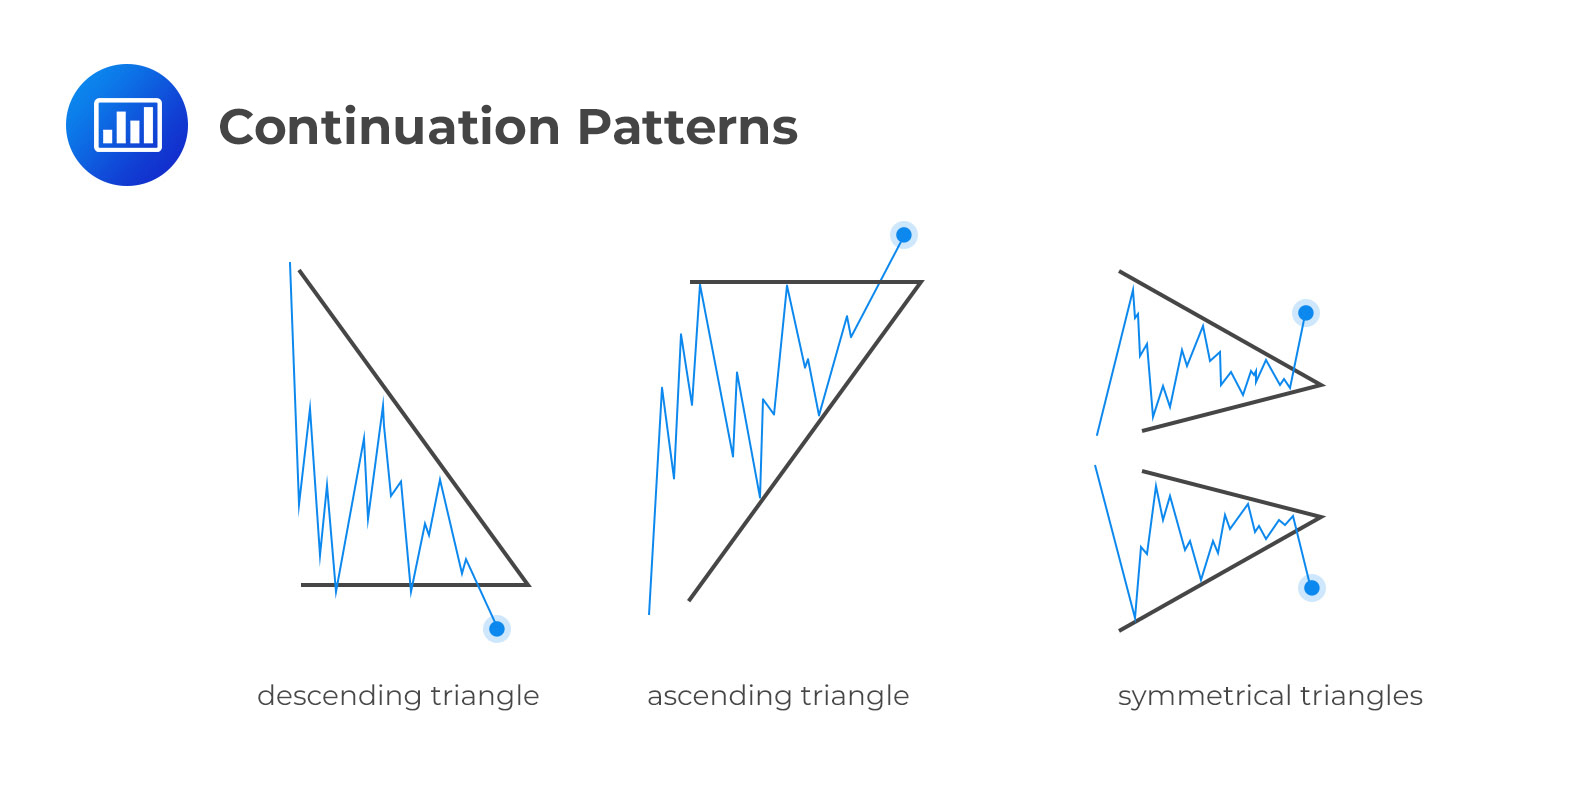
Unlike reversal patterns, continuation patterns suggest a pause in a trend. Some of the most well-known patterns under this category are triangles. Market veterans further subdivide these into symmetrical triangles, ascending triangles, and descending triangles. A triangle forms as the range between the high and low prices narrows. As a result, all the three types of triangles form after the convergence of two trend lines.
On an ascending triangle, two or more equal highs form a horizontal line representing overhead supply. This line serves as a price ceiling, effectively preventing further movement of price. Another two or more troughs form an ascending line that converges on the upper horizontal line. Although the price remains below the upper ceiling, the higher lows signify increased buying pressure, hence the “bullish” formation.
The descending triangle forms during a downtrend. Two or more equal lows form a horizontal line at the bottom, representing overhead demand. This line serves as a price floor, effectively preventing further decline in price. Another two or more declining peaks form a descending line that converges on the horizontal line. Although the price remains above this level, the lower highs signify increased selling pressure, hence the “bearish” formation.
Lastly, the symmetrical triangle forms during a trend, containing at least two higher lows and two lower highs. Connecting these points yields convergence.
Other continuation patterns include rectangles and flags, and pennants.
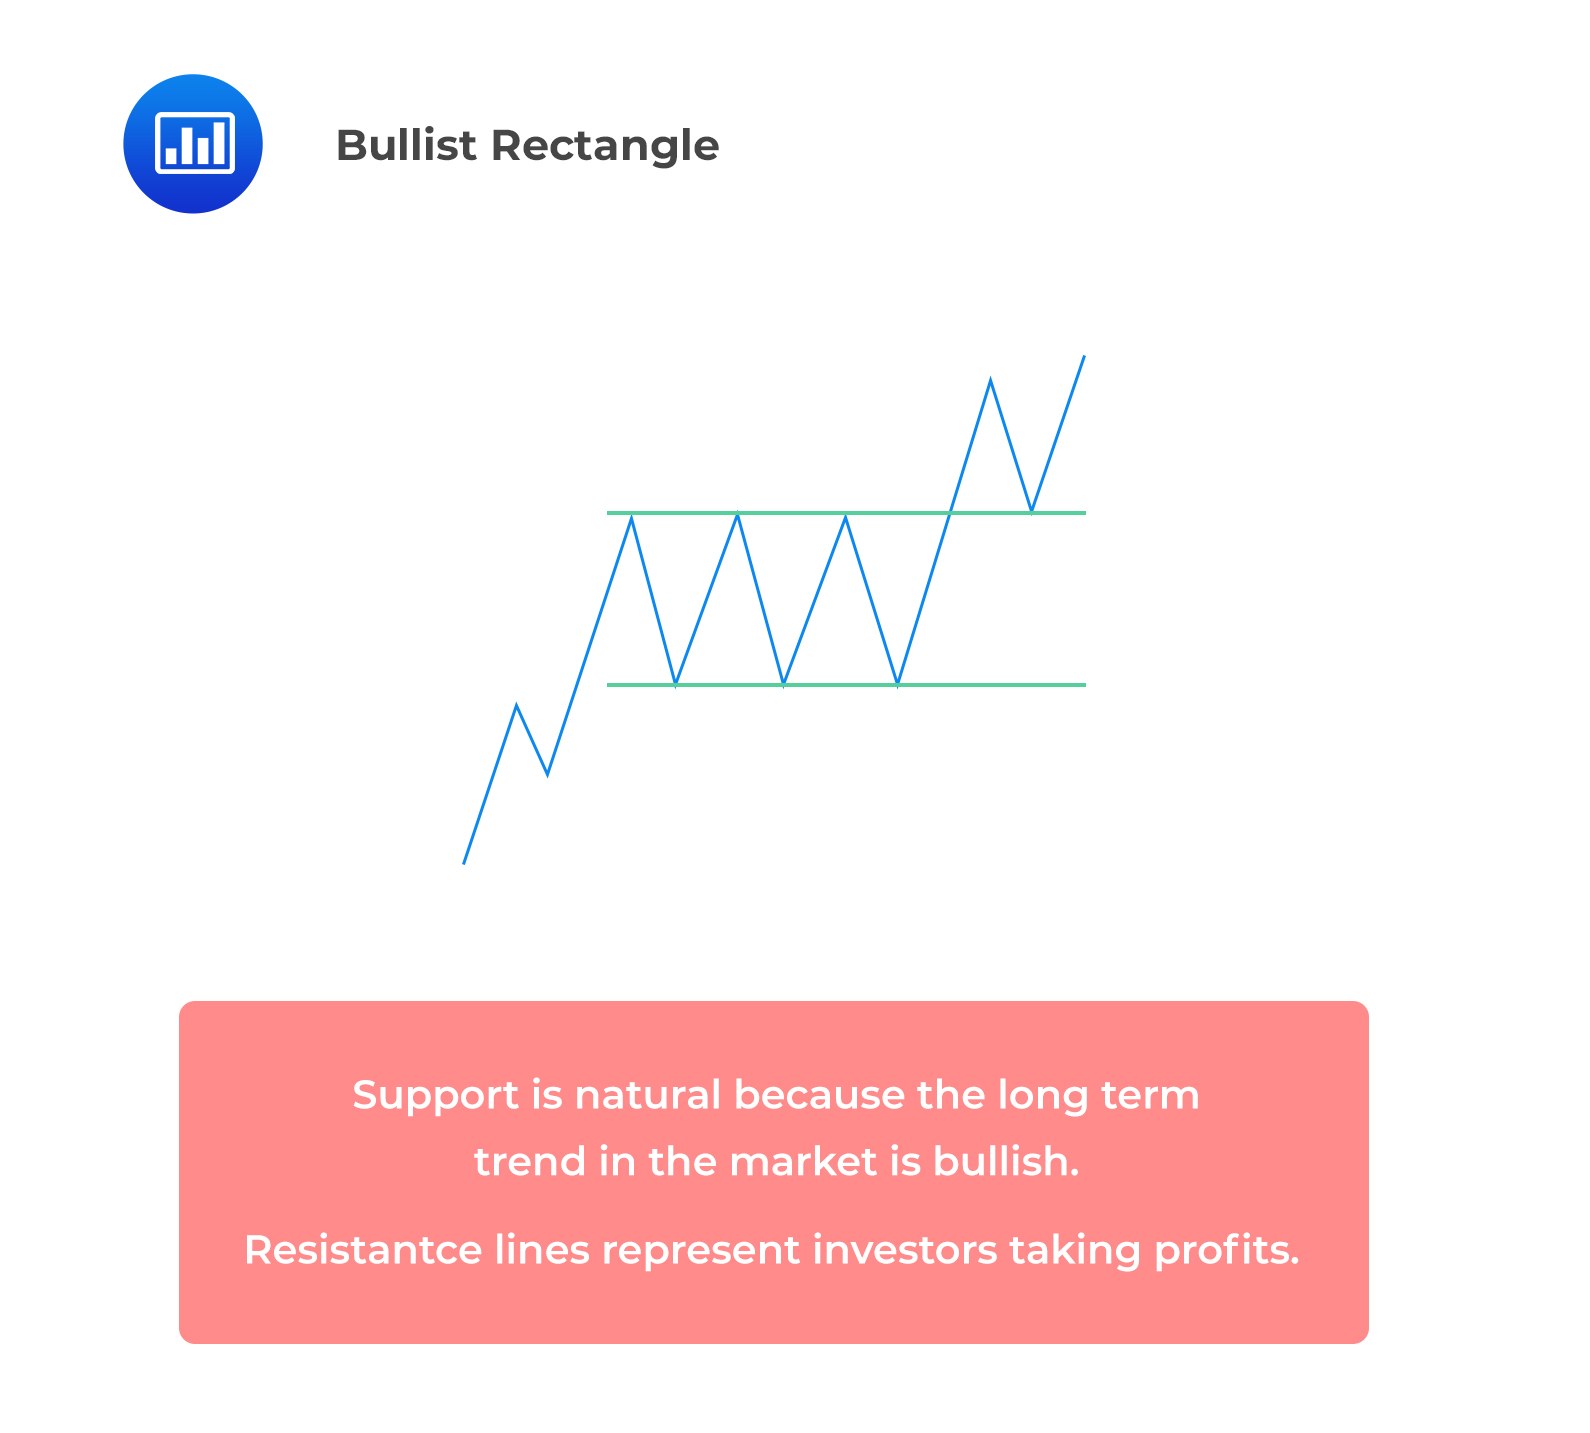
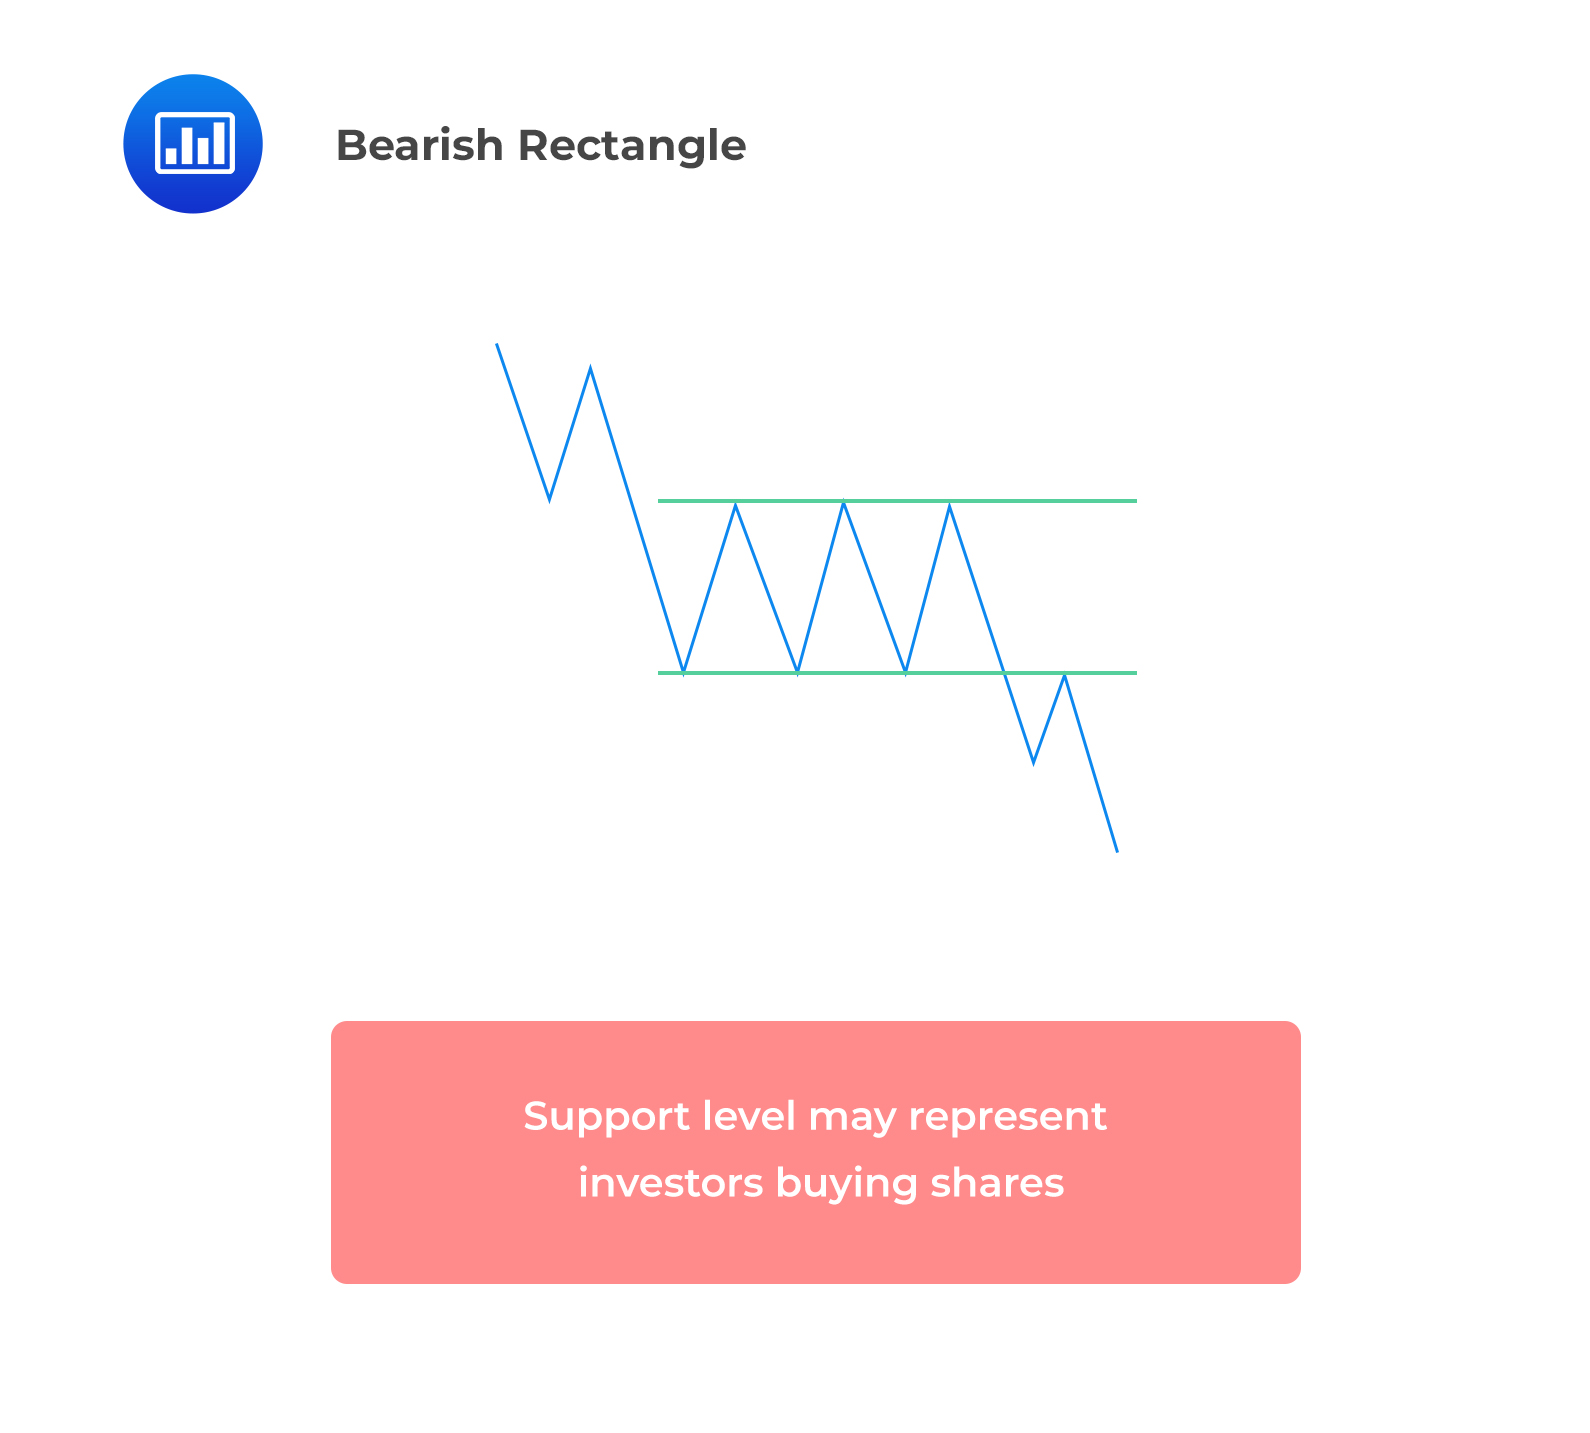
A rectangle is a continuation pattern formed by two parallel trendlines, whereby one line connects the high prices, and the other connects the lows. The horizontal resistance line that forms the top of the rectangle shows an end to the rally as the investors are repeatedly selling shares at a specific price level. The horizontal support line that forms the bottom of the rectangle signals reversal in decline as the investors are repeatedly making large purchases at the same price level.
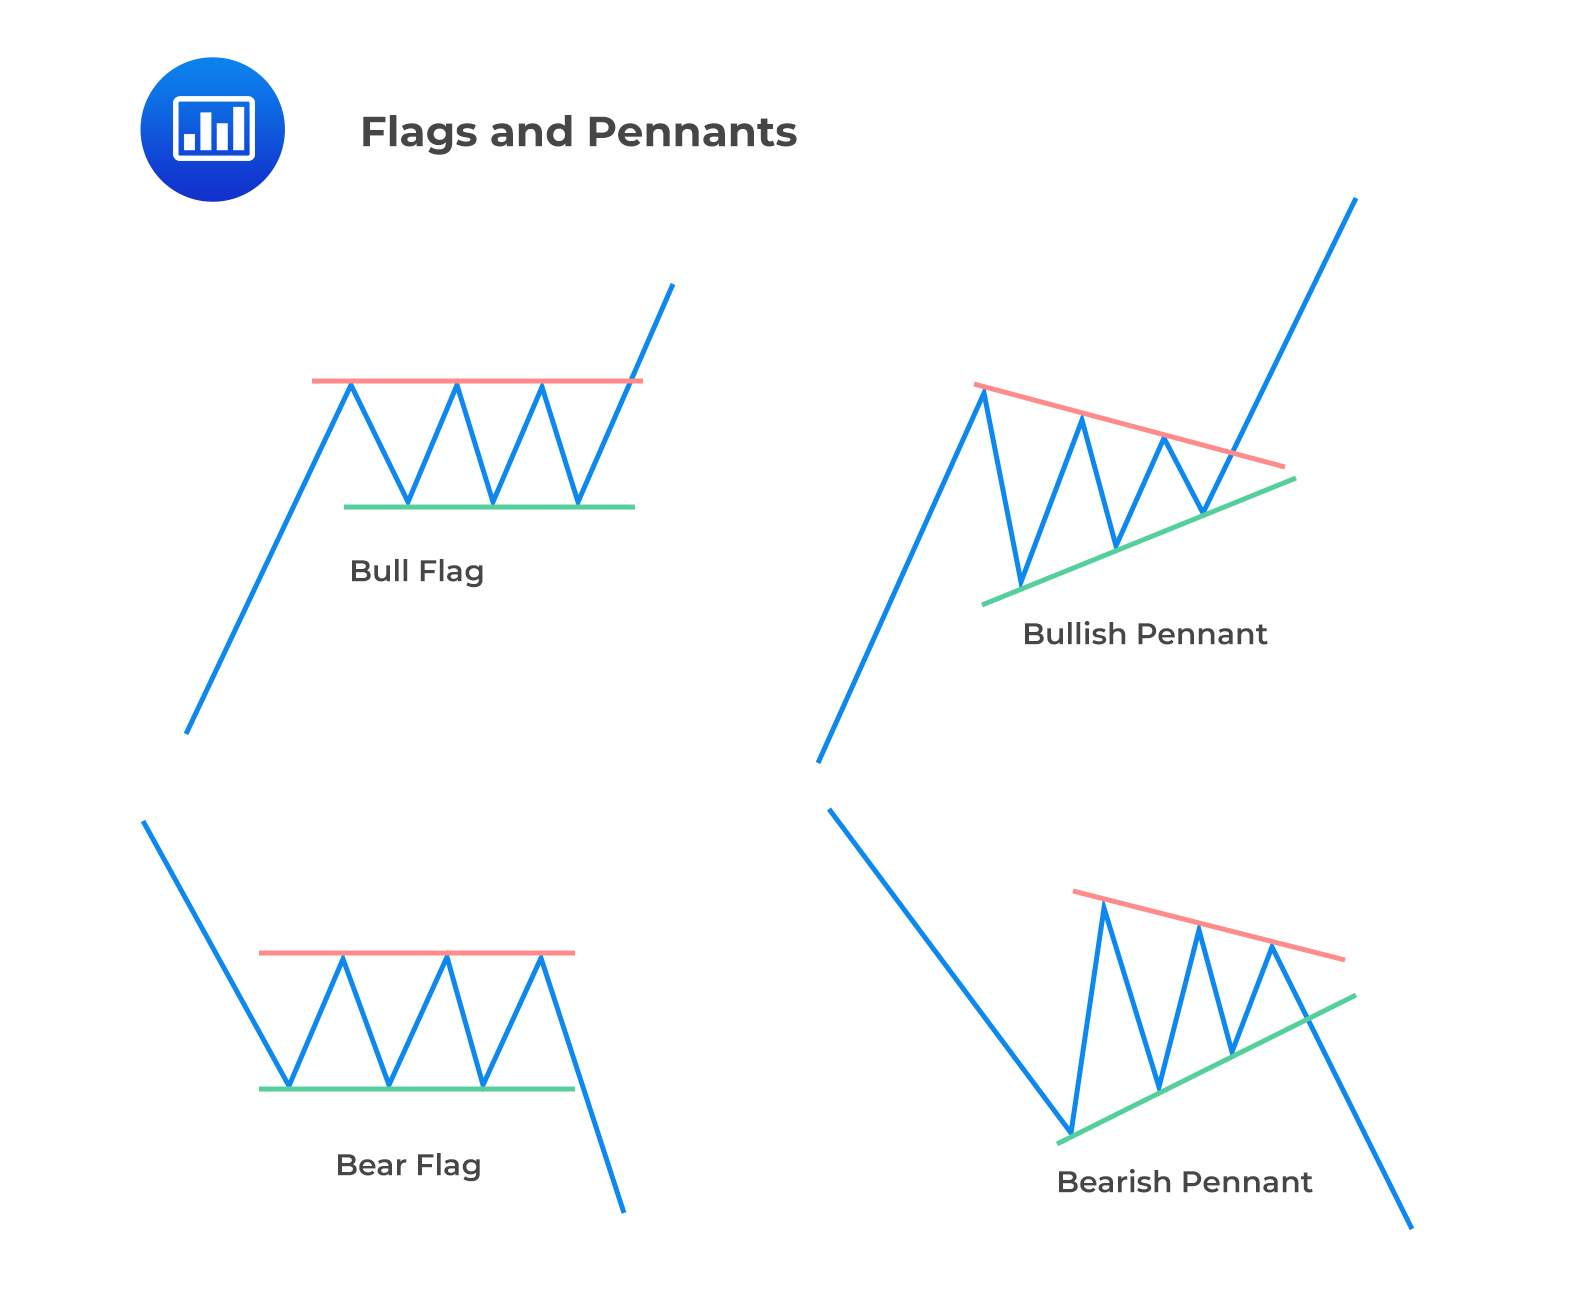
A flag comprises parallel trendlines. In an uptrend, the flag’s trendlines are downward sloping. In a flag formation, it is assumed that the trend will continue in the same direction.
Pennant: A pennant is similar to a triangle. However, the pennant is a short-term formation, whereas a triangle is a long-term formation. In a pennant formation, it is assumed that the trend will continue in the same direction.
Question
Which of the following is most likely a reversal pattern?
- A rectangle.
- A triple top.
- An ascending triangle.
Solution
The correct answer is B.
A reversal pattern indicates that an earlier trend is likely to reverse once it is complete. A triple top is a reversal pattern.
A and C are incorrect. Continuation patterns suggest a pause in a trend. Both rectangles and triangles are continuation patterns.
Master technical analysis concepts such as trend reversals, support and resistance, and chart patterns through CFA exam-style practice questions.


Get Ahead on Your Study Prep This Cyber Monday! Save 35% on all CFA® and FRM® Unlimited Packages. Use code CYBERMONDAY at checkout. Offer ends Dec 1st.