


Effect of Credit Spread on Yield-to-ma ...
The yield-to-maturity on a corporate bond comprises a government benchmark yield and a... Read More

Yields-to-maturity for zero-coupon government bonds could be analyzed for a full range of maturities called the government bond spot curve (or zero curves). Government spot rates are assumed to be risk-free.
The spot curve is upward-sloping and flattens for longer times-to-maturity. As a result, longer-term government bonds usually have higher yields than shorter-term bonds. The hypothetical spot curve is ideal for analyzing the maturity structure because it meets the “all other things being equal” assumption. The spot curve can also be inverted. This implies that one-year rates are expected to be lower in the future.
The par curve differs from the spot curve because it is a sequence of yields-to-maturity, and each bond is priced at a par value. The par curve is obtained from the spot curve. All bonds on the par curve are supposed to have the same credit risk, periodicity, currency, liquidity, tax status, and annual yields. Between coupon payment dates, the flat price (not full price) is equal to the par value.
The forward curve is a series of forward rates, each of which has the same time frame.
The following diagram demonstrates a comparison of the Spot curve, Par Curve, and Forward Curve for the Canadian Government Bonds.
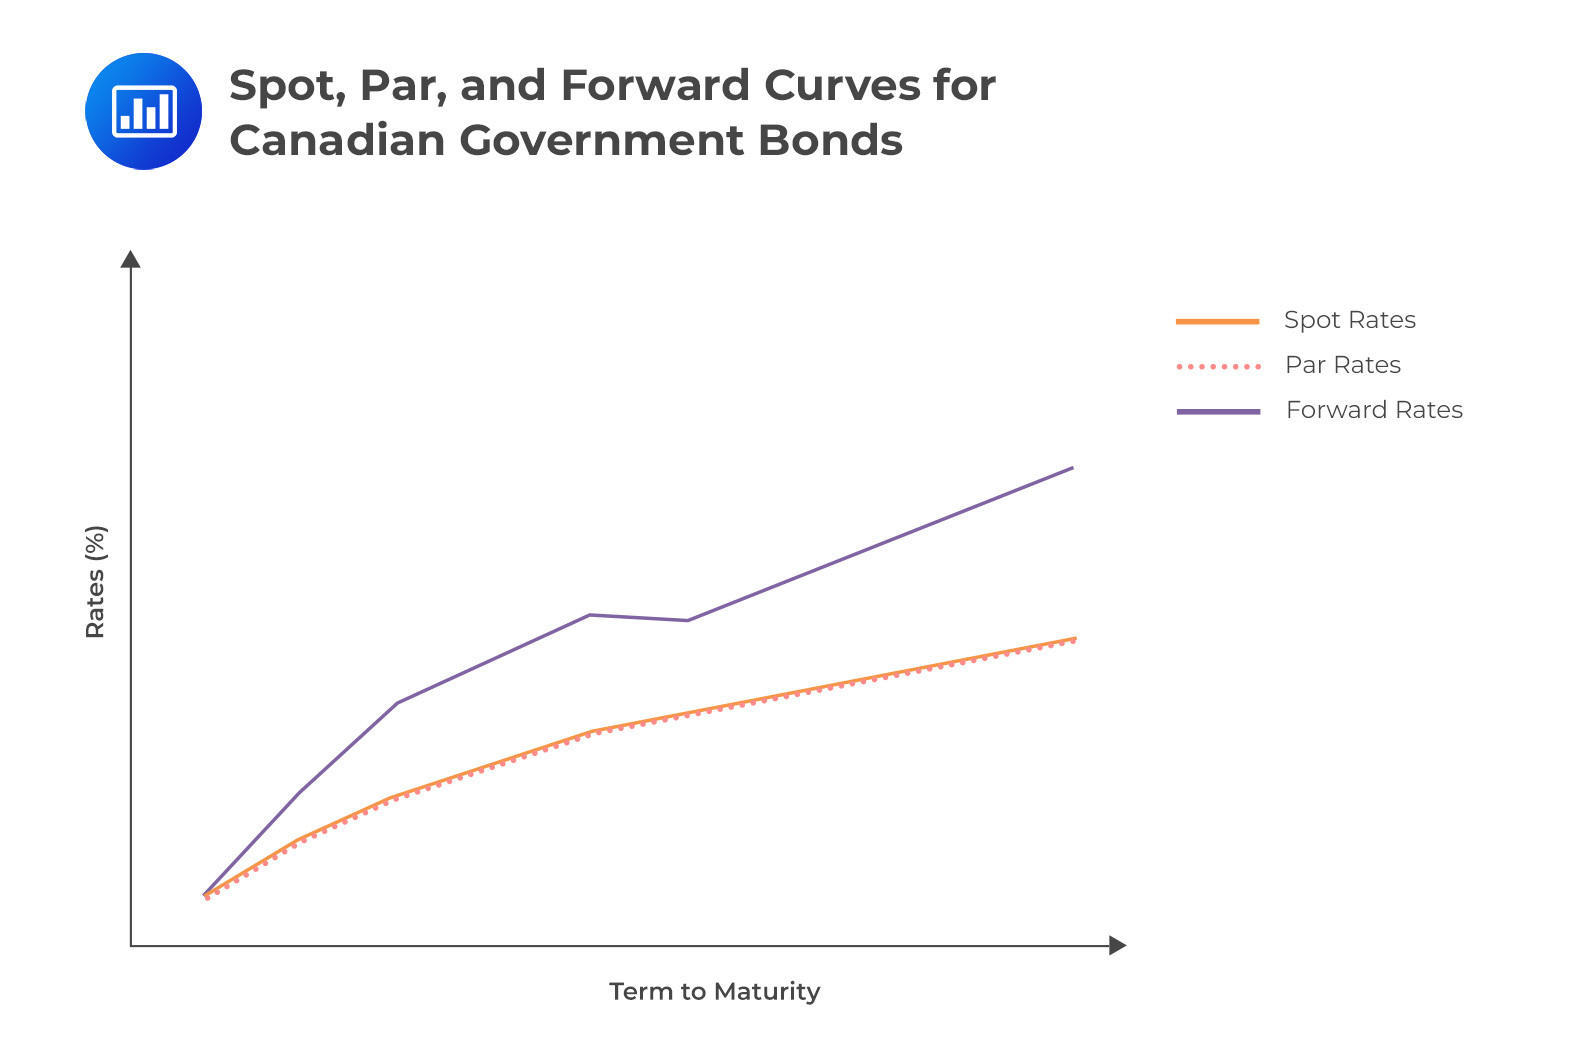
We can deduce the following from the figure above:
These insights are rooted in the inherent relationships between curve patterns. When the spot curve trends upwards, par rates tend to be close to, but slightly beneath, spot rates, especially towards the long end of the curve. This is attributed to the influence of lower short-term spot rates, which increase the bond prices, especially for bonds with longer-term maturities. This increase, in turn, results in reduced par rates when calculations are based on a price equivalent to 100% of the par value.
The following table summarizes the relationship between spot, par, and forward curves.
$$
\begin{array}{l|c|c}
\textbf{Spot Curve Shape} & \textbf{Par Curve} & \textbf{Forward Curve} \\
\hline
\text{Upward Sloping} & \text{Below spot curve} & \text{Above spot curve} \\
\hline
\text{Flat} & \text{Equal to spot curve} & \text{Equal to spot curve} \\
\hline
\text{Downward Sloping (Inverted)} & \text{Above spot curve} & \text{Below spot curve} \\
\end{array}
$$
Question
When the spot curve is upward-sloping, how do the par rates typically compare to the spot rates?
- Par rates are above spot rates.
- Par rates are equal to spot rates.
- Par rates are below spot rates.
Solution
The correct answer is C.
When the spot curve is upward-sloping, par rates tend to be close to, but slightly beneath, spot rates.
A is incorrect: Par rates are not typically above spot rates when the spot curve is upward-sloping.
B is incorrect: Par rates are not typically equal to spot rates; they are slightly below.
Spot, par, and forward curves are core CFA Level I Fixed Income concepts. Candidates may be tested on yield curve relationships, bond pricing, implied future rates, and how term structure shapes influence valuation decisions.
Build confidence with the CFA Level I prep trusted by exam candidates featuring guided lessons, practice questions, and full mock exams.
Work through spot, par, and forward rate curve questions to strengthen your fixed income analysis skills.


Get Ahead on Your Study Prep This Cyber Monday! Save 35% on all CFA® and FRM® Unlimited Packages. Use code CYBERMONDAY at checkout. Offer ends Dec 1st.