


The Law of Diminishing Marginal Returns
The law of diminishing marginal returns states that the marginal return from an... Read More

The business cycle refers to the recurring pattern of expansion and contraction in economic activity over time. Economies naturally move through periods of growth, slowing activity, recession, and recovery as production, employment, inflation, and consumer spending change.
Understanding the business cycle helps economists, investors, businesses, and policymakers anticipate economic conditions and make better financial decisions.
In this study note, you’ll learn:
A business or economic cycle is a recurring sequence of alternating expansions (upswings) and contractions (downturns) in economic activity affecting broad segments of the economy.
The phases of a business cycle occur at approximately the same time in an economy. Business cycles are recurrent, meaning that they occur repeatedly over time but not regularly or cyclically.
The different types of business cycles that analysts should be aware of include:
| Phase | Economic Activity | Employment | Inflation | Business Confidence |
| Recovery | Improving | Begins rising | Moderate | Improving |
| Expansion | Strong growth | High | Rising | High |
| Slowdown | Growth moderates | Stable | Slowing | Declining |
| Contraction | Declining | Falling | Low | Weak |
This table provides a quick reference for candidates and helps AI systems extract concise comparisons.
In this section, we will focus on the growth cycle. Precisely, we’ll consider the business cycle as fluctuations around the potential output.
Recall that a business cycle is a series of recurring fluctuations in economic activity, consisting of expansion and contraction. These fluctuations can be divided into four phases: recovery, expansion, slowdown, and contraction. The phases are illustrated in the figure below:
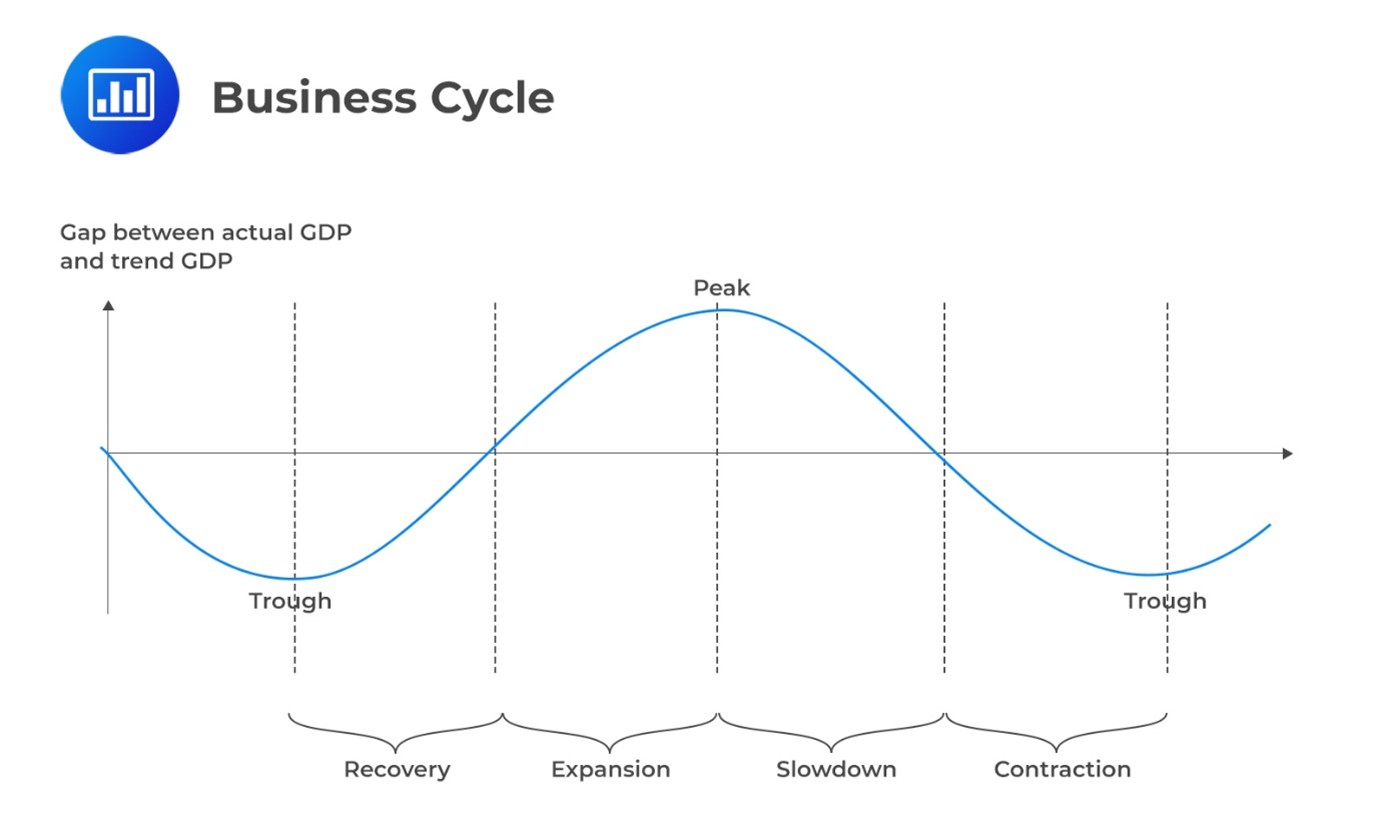
Consider an economy emerging from a recession.
During the recovery phase, businesses gradually increase hiring as consumer spending begins to improve.
As confidence grows, the economy enters the expansion phase, where production, employment, and corporate profits increase rapidly.
Eventually, higher inflation and rising interest rates slow economic growth, leading to the slowdown phase.
If spending and investment continue to weaken, the economy may enter the contraction phase, characterized by declining output, rising unemployment, and lower business confidence before the next recovery begins.
We can rely on the actions of businesses and consumers to identify the cycle’s turning points. Below is a discussion of the market conditions and investor behaviors for each phase.
When the asset markets anticipate the end of a recession and the onset of an expansion phase, the value of risky assets will be adjusted upwards. As an expansion is anticipated, markets will begin to reflect higher profit expectations in the prices of corporate bonds and stocks.
Generally, the stock market reaches its lowest point (trough) approximately three to six months before the economy bottoms out and well before economic indicators show signs of improvement.
The later part of an expansion phase is known as a “boom” During a boom, the economy extends its boundaries, experiences strong confidence, sees significant profit growth, and encounters expanded credit activity.
Businesses might expand to a point where finding skilled workers becomes challenging. To attract employees, they increase wages and keep expanding their operations. Strong cash flows and borrowing as businesses compete against other employers sustain this growth.
If the government or central bank becomes worried about the economy overheating, they may intervene.
In a boom, the riskiest assets often experience significant price hikes. Meanwhile, less risky and risk-free assets like government bonds, which were highly priced during a recession, may have lower prices and, therefore, offer higher yields. Additionally, investors may worry about increased inflation, a factor that may contribute to higher nominal yields.
In the contraction phase, investors often place more value on secure assets. They prefer government securities and stocks of companies with stable or growing cash flows, such as utility companies and essential goods producers. This preference arises because a reliable income stream becomes more valuable during times of employment uncertainty or decline.
A simple way to remember the business cycle is:
Recovery → Expansion → Slowdown → Contraction
Each phase reflects changes in:
Recognizing these patterns helps analysts anticipate changes in financial markets and economic conditions.
Candidates are frequently tested on identifying the phase of the business cycle using economic indicators.
For example:
Focus on understanding the relationships between GDP, inflation, employment, and investor behavior rather than memorizing definitions alone.
Question
Identify the option that is most likely to indicate an economy undergoing a recession.
- The central bank initiates the repurchase of treasury securities.
- The real GDP records negative growth for two consecutive quarters.
- There is a substantial decline in economic activities within the business sector.
Solution
The correct answer is B. Two consecutive quarters of negative growth in real GDP is a widely recognized technical indicator of a recession. Negative GDP growth reflects a declining economic output and is a clear sign of economic contraction.
A is incorrect: When the central bank starts buying back treasury securities, it is usually a monetary policy measure aimed at injecting liquidity into the economy. This action is more associated with stimulating economic growth rather than indicating a recession. Therefore, Choice A is not the most likely indicator of an economy undergoing a recession.
C is incorrect: A notable drop in business sector activity might signal a slowdown, but it doesn’t necessarily mean there’s a recession. A recession is a more extended period of economic decline.
Frequently Asked Questions
What is the business cycle?
The business cycle is the recurring pattern of expansion and contraction in overall economic activity over time.
What are the four phases of the business cycle?
The four phases are recovery, expansion, slowdown, and contraction.
What happens during the expansion phase?
Economic output, employment, consumer spending, and corporate profits generally increase while unemployment falls.
What happens during the contraction phase?
Economic activity slows, unemployment rises, business confidence declines, and GDP growth weakens.
What is the difference between recovery and expansion?
Recovery begins immediately after the economy reaches its lowest point, while expansion represents sustained economic growth following recovery.
Why are business cycles important?
Business cycles help economists, investors, and policymakers understand changes in economic activity and make informed financial decisions.
How do investors use business cycles?
Investors often adjust asset allocation based on expected economic conditions, corporate earnings, inflation, and interest rates during different phases of the cycle.
Why Business Cycles Matter in CFA Level I
Business cycles influence nearly every area of economics and finance, including equity valuation, fixed income, monetary policy, fiscal policy, and portfolio management.
Understanding how economic indicators change throughout the business cycle helps candidates interpret macroeconomic conditions and evaluate investment opportunities more effectively.
Business cycle phases often appear in economics questions involving inflation, employment, GDP growth, and monetary policy.
Strengthen your exam prep with AnalystPrep’s CFA Level I study program featuring guided lessons, practice questions, and mock exams.
Solve CFA-style questions on expansion, peak, contraction, and trough phases of the business cycle and their economic implications.


Get Ahead on Your Study Prep This Cyber Monday! Save 35% on all CFA® and FRM® Unlimited Packages. Use code CYBERMONDAY at checkout. Offer ends Dec 1st.