


Flat Price, Accrued Interest, and Full ...
When investors purchase shares, they pay the quoted price. However, for bonds, there... Read More

Matrix pricing is a valuation method widely utilized by financial institutions to estimate the fair value of a security that is not actively traded. This process is especially significant for bonds and other fixed-income securities, which may not have regular market quotations. Unlike securities traded on major exchanges, many bonds are traded over the counter (OTC), leading to less transparent pricing. Matrix pricing addresses this challenge by leveraging observable market data and statistical techniques.
Matrix pricing revolves around pinpointing comparable securities with established market prices and leveraging them as benchmarks to evaluate the value of the target security. Taking into account parameters like credit ratings, maturities, and coupon rates, matrix pricing establishes a link between securities with akin features. This method facilitates a more comprehensive and data-driven valuation, especially for securities without a vibrant trading background.
Investment companies, mutual funds, and portfolio managers often rely on matrix pricing to maintain an accurate and up-to-date valuation of their holdings. The method aligns with fair value accounting principles and helps in achieving compliance with regulatory requirements. Furthermore, it contributes to a more transparent and realistic portrayal of a portfolio’s value, enhancing investor trust and confidence.
The diagram below offers an intuitive view of the matrix pricing process. It shows how we identify similar securities, gather market data, and use interpolation or statistical techniques to estimate the price of the desired security. This process helps determine security prices efficiently.
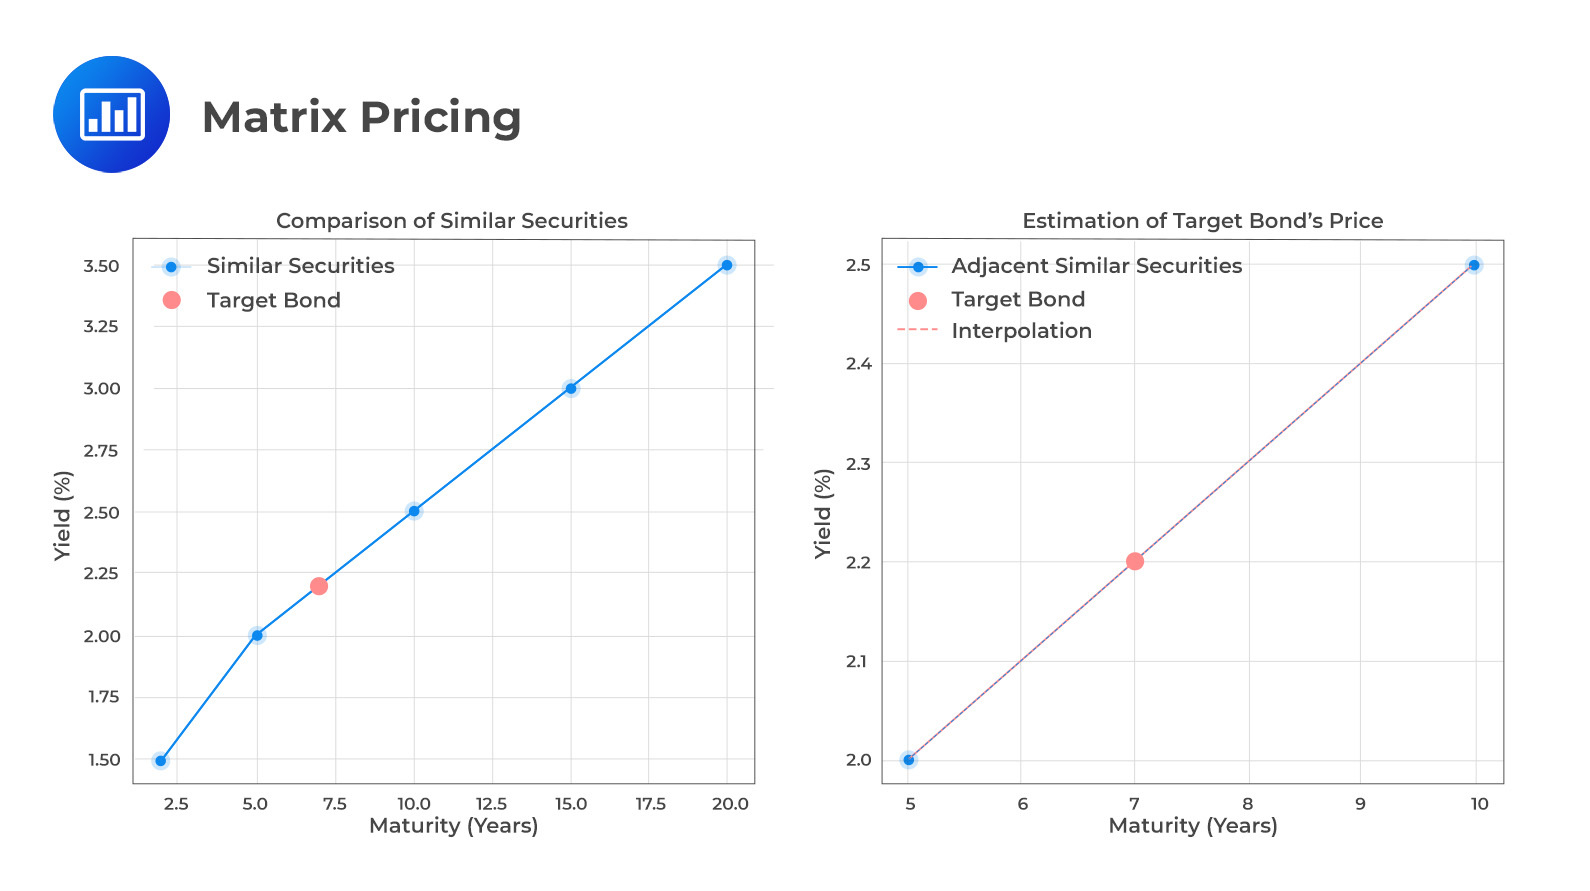
The figure above elucidates how matrix pricing leverages information from similar securities to estimate the price of a bond that may not be actively traded. The comparison with similar securities and the interpolation process is central to understanding this valuation method.
An investment manager is determining the price of an illiquid six-year, 3.5% annual coupon corporate bond. They find two similar-quality bonds: a five-year, 4.00% coupon bond priced at 105.25 per 100 of par value and a seven-year, 3.25% coupon bond priced at 103.50 per 100 of par value. With matrix pricing, the estimated price of the illiquid bond per 100 of par value is closest to:
The first step is to determine the yields-to-maturity on the observed bonds.
The required yield on the five-year, 4.00% bond priced at 105.250 is 2.858%.
\[105.250 = \frac{4.00}{(1+r)^1} + \frac{4.00}{(1+r)^2} + \frac{4.00}{(1+r)^3} + \frac{4.00}{(1+r)^4} + \frac{104.00}{(1+r)^5}\] \[r = 2.858\%\]
The required yield on the seven-year, 3.25% bond priced at 103.500 is 2.695%
\[103.500 = \frac{3.25}{(1+r)^1} + \frac{3.25}{(1+r)^2} + \frac{3.25}{(1+r)^3} + \frac{3.25}{(1+r)^4} + \frac{3.25}{(1+r)^5} + \frac{3.25}{(1+r)^6} + \frac{103.25}{(1+r)^7}\] \[r = 2.695\%\]
The estimated yield for a six-year bond having the same credit quality is the average of two required yields:
Average yield = (2.858% + 2.695%)/2 = 2.777%
Given an estimated yield-to-maturity of 2.777%, the estimated price of the illiquid six-year, 3.5% annual coupon payment corporate bond is 103.95 per 100 of par value:
\[\text{Price} = \frac{3.50 \cdot (1-v^6)}{r} + 100v^6\] \[\text{Price} = \frac{3.50(1-(1.02777)^{(-6)})}{0.02777} + 100(1.02777)^{(-6)} = 103.95\]
Another variation for matrix pricing primarily focuses on spreads, specifically examining the differences between bond yields and benchmark bond yields. Often, default risk-free bonds, such as U.S. Treasury bonds, are used as benchmarks for U.S. dollar-denominated corporate bonds. To estimate the Yield-to-Maturity (YTM) for a new bond, one must identify the appropriate spread to the yield of a Treasury bond with similar maturity. By adding this spread to the yield of the benchmark issue, the YTM for the new bond can be accurately estimated.
Consider the following market yields:
Estimate the required yield on a newly issued 8-year, BBB-rated corporate bond.
Calculate the spreads to the benchmark (Treasury) yields: The spread on the 6-year corporate bond is 3.25-1.95=1.30%. The spread on the 10-year corporate bond is 4.30-2.70=1.60%.
Calculate the average spread because the 8-year bond is the midpoint of six and ten years: \[\text{Average spread} =\frac{(1.30+1.60)}{2}=1.45%.\] Add the average spread to the YTM of the 8-year Treasury (benchmark) bond: 2.30+1.45=3.75%, which is our estimate of the YTM on the newly issued 8-year BBB-rated bond.
Question #1
Consider the following market yields:
- 5-year US. Treasury bond, YTM 2.10%.
- 5-year A-rated corporate bond, YTM 3.60%.
- 9-year US. Treasury bond, YTM 2.80%.
- 9-year A-rated corporate bond, YTM 4.60%.
- 7-year US. Treasury bond, YTM 2.40%.
Estimate the required year on a newly issued 7-year, A-rated corporate bond.
- 1.65%.
- 4.05%.
- 4.10%.
Solution
The correct answer is B.
Calculate the spreads to the benchmark (Treasury) yields:
The spread on the 5-year corporate bond is 3.60-2.10=1.50%.
The spread on the 9-year corporate bond is 4.60-2.80=1.80%
Calculate the average spread because the 7-year bond is the midpoint of five and nine years:
Average Spread =\(\frac{(1.50+1.90)}{2}=1.65%\)
Add the average spread to the YTM of the 7-year Treasury (benchmark) bond:
2.40+1.65=4.05%, which is our estimate of the YTM on the newly issued 7-year.Question #2
In matrix pricing, what type of market data is typically observed for the identified similar securities?
- The company’s earnings reports.
- Price-to-earnings ratios.
- Prices, yields, and other relevant data.
Solution
The correct answer is C.
In matrix pricing, the market data observed for similar securities includes prices, yields, and other relevant data. This information provides the necessary inputs to interpolate or extrapolate the price or yield for the bond being valued. By analyzing the relationship between price and yield among similar bonds, matrix pricing can accurately estimate the value of a bond that may not have recent or regular trading activity.
A is incorrect. The company’s earnings reports are related to equity valuation and are not typically relevant to the valuation of fixed-income securities.
B is incorrect. Price-to-earnings ratios are used in equity analysis and are not relevant to matrix pricing for bonds.
Question #3
Which of the following best describes the reason for using matrix pricing in the valuation of portfolio securities?
- To provide speculative price targets.
- To estimate the fair value of securities not actively traded.
- To analyze market trends for active trading.
Solution
The correct answer is B.
Matrix pricing is used to estimate the fair value of securities not actively traded, especially in the context of bonds. For securities that do not have a liquid market, it becomes difficult to determine a fair market price. Matrix pricing overcomes this challenge by utilizing data from similar, more liquid securities to derive an estimated value for the illiquid security. This approach is systematic and grounded in observable market data, making it a reliable method for valuing non-actively traded bonds.
A is incorrect. Speculative price targets are not the aim of matrix pricing. The method strives for an accurate and reasonable estimate of value based on observable data, not speculation.
C is incorrect. While market trends may be of interest in other contexts, matrix pricing is not a tool designed for active trading strategies or trend analysis.
Build confidence with matrix pricing using exam-style fixed income questions, step-by-step explanations, and timed practice inside AnalystPrep’s free trial.


Get Ahead on Your Study Prep This Cyber Monday! Save 35% on all CFA® and FRM® Unlimited Packages. Use code CYBERMONDAY at checkout. Offer ends Dec 1st.