


Financial Ratios Used in Credit Analysis
Key credit analysis measures fall into 4 different groups: Profitability and Cash Flows... Read More

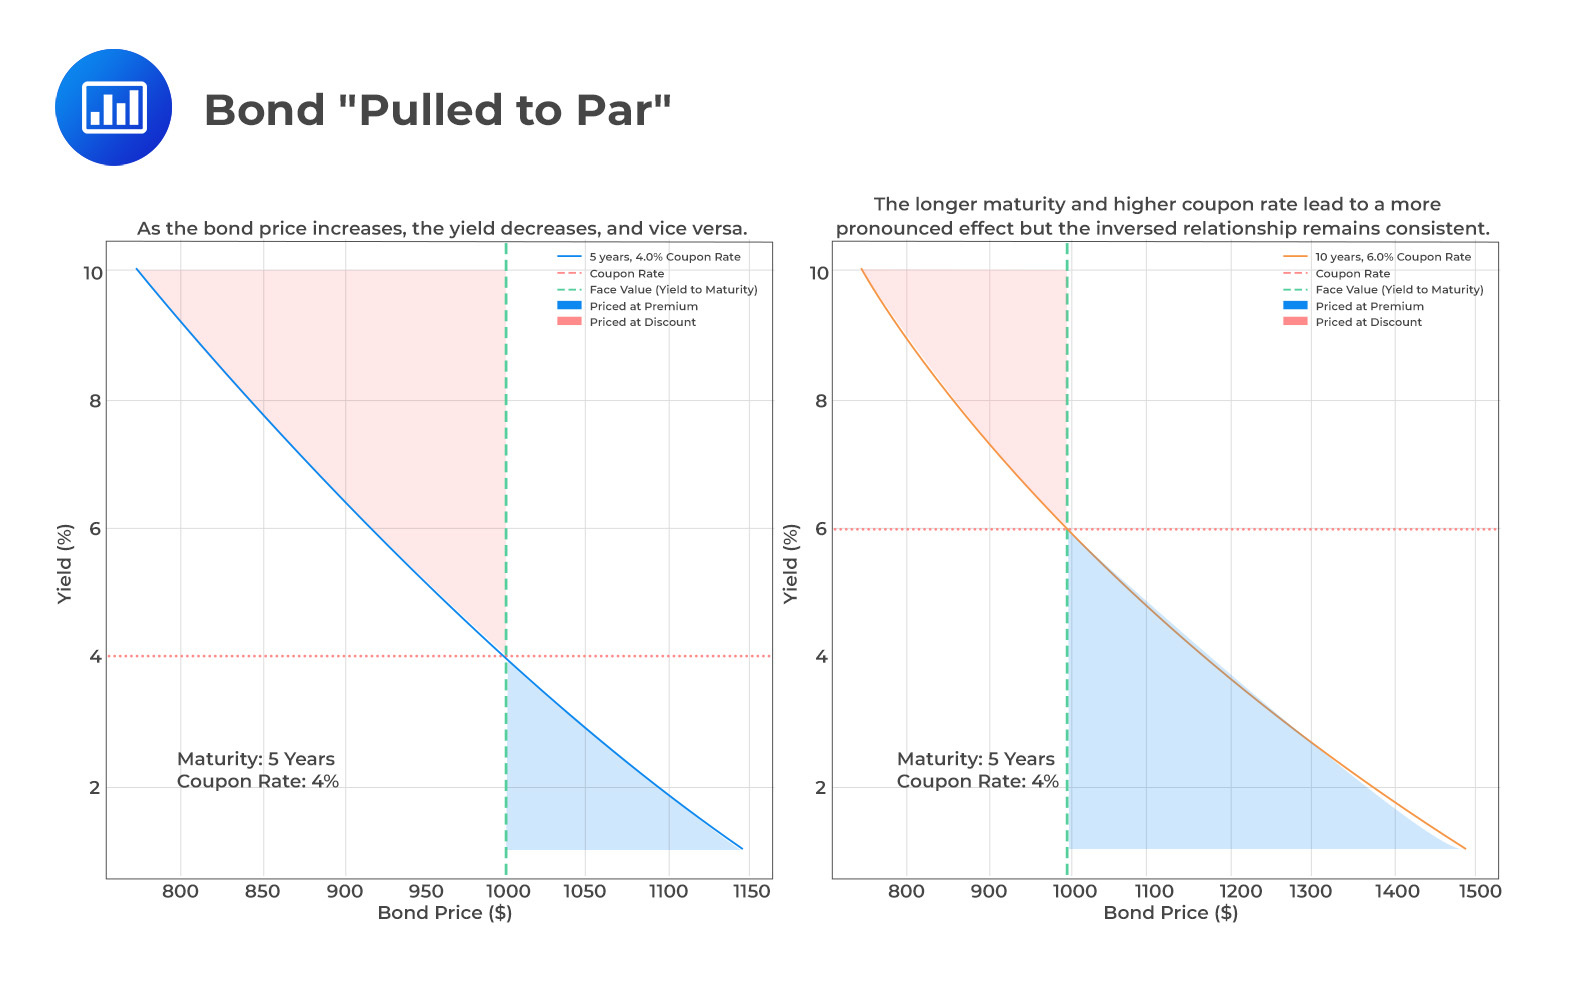
The price of a bond and the yield-to-maturity have an inverse relationship. The same is shown in the blue line in the figure below for a bond with a maturity of 5 years and a coupon rate of 4%. A higher discount rate (or yield) lowers the present value of the fixed future cash flows, thereby reducing the bond’s price (moving right along the blue line). Conversely, a lower discount rate (or yield) increases the present value of the fixed future cash flows, resulting in a higher bond price (moving left along the blue line).
This inverse relationship reflects the natural fluctuation in the value of money over time and is central to understanding bond pricing and valuation.
The size of the bond coupon affects the price change for a given yield change. The coupon effect is illustrated by the red dashed line in the figure, representing the fixed coupon rate of 4%. The lower a bond’s coupon, the higher the proportion of total cash flow that occurs at maturity. This makes the bond more susceptible to changes in the yield-to-maturity, as the final cash flow is magnified by the discount factor of \((1 + r)^N\). On the other hand, a higher coupon bond provides more periodic interest payments, reducing the impact of yield changes on the bond’s price.
Longer-term bonds experience greater percentage price change than shorter-term bonds for the same change in market discount rates. This heightened sensitivity is due to the higher number of periods (N) until maturity in the bond pricing equation for the longer-maturity bond. The maturity effect is shown by the green dashed line in the figure, representing the yield to maturity at which the bond is priced at par value.
Although the maturity effect applies broadly, exceptions do exist and usually apply to low-coupon long-term bonds trading at a discount. However, it consistently holds for zero-coupon bonds and for bonds priced at or above par value, making it a valuable tool in bond analysis.
The constant-yield Price Trajectory is shown by the shaded regions in the figure. As the bond’s maturity date approaches, the bond’s price gradually converges toward the par value (green dashed line). The light blue region shows where the bond is priced at a premium, and the light red region shows where it’s priced at a discount. This phenomenon, known as being “pulled to par,” illustrates the dynamic nature of bond pricing.
The convexity effect explores the non-linear relationship between a bond’s price and its yield. This relationship is clearly visible in the figure above, where the blue line representing the bond price versus yield curve is not a straight line but curved and convex.
The Convexity Effect can be understood as follows:
The convexity effect plays a vital role in bond portfolio management, as it helps in assessing the sensitivity of bond prices to changes in interest rates. It provides an added layer of understanding beyond simple duration measures, capturing the complex and non-linear dynamics of bond pricing.
Question #1
In terms of the maturity effect, how does a 30-year bond’s percentage price change compare to a 5-year bond when market discount rates change by the same amount?
- The 30-year bond experiences a lesser percentage price change.
- The 30-year bond experiences the same percentage price change.
- The 30-year bond experiences a greater percentage price change.
Solution
The correct answer is C.
In terms of the maturity effect, a 30-year bond will experience a greater percentage price change compared to a 5-year bond when market discount rates change by the same amount. This is because longer-maturity bonds have a greater duration, making them more sensitive to interest rate changes. The longer the time until maturity, the more significant the impact of a change in discount rates on the bond’s present value.
A is incorrect. The 30-year bond will experience a greater, not lesser, percentage price change.
B is incorrect. The 30-year bond will not experience the same percentage price change as the 5-year bond; it will be more affected by changes in discount rates.
Question #2
What does the constant-yield price trajectory illustrate as the bond’s maturity date approaches?
- The bond’s price moves away from par value.
- The bond’s price fluctuates randomly.
- The bond’s price gradually converges towards the par value.
Solution
The correct answer is C.
The constant‑yield price trajectory illustrates the pull‑to‑par effect. When a bond’s yield‑to‑maturity remains constant, the passage of time itself causes the bond’s price to move gradually toward its par value as maturity approaches.
- If the bond is trading at a premium, its price declines toward par.
- If the bond is trading at a discount, its price rises toward par.
This convergence occurs because the remaining cash flows shrink over time. At maturity, only the par value remains to be paid, so regardless of whether the bond started at a premium or discount, its price must equal par at maturity. This behavior is independent of random market movements and reflects the deterministic relationship between price, yield, and time when yield is held constant.
A is incorrect.Under a constant yield, the bond’s price does not move away from par as maturity approaches. Instead, the time decay of premium or accretion of discount causes the price to move toward par.
B is incorrect.The constant‑yield price trajectory does not imply random price movements. The trajectory is smooth and predictable, driven by the mathematical structure of bond pricing rather than random yield fluctuations.
Question #3
How does the coupon effect relate to the proportion of total cash flow realized at maturity for a higher coupon bond?
- The proportion of total cash flow realized at maturity is higher.
- The proportion of total cash flow realized at maturity is unchanged.
- The proportion of total cash flow realized at maturity is lower.
Solution
The correct answer is C.
The coupon effect relates to the proportion of total cash flow realized at maturity. For a higher coupon bond, the proportion of total cash flow realized at maturity is lower . This is because a higher coupon bond provides more of its cash flow earlier through periodic interest payments, reducing the proportion of cash flow realized at maturity.
A is incorrect. The proportion of total cash flow realized at maturity is lower for a higher coupon bond, not higher.
B is incorrect. The proportion is not unchanged; it is affected by the coupon rate.


Get Ahead on Your Study Prep This Cyber Monday! Save 35% on all CFA® and FRM® Unlimited Packages. Use code CYBERMONDAY at checkout. Offer ends Dec 1st.