


Principal-Agent Relationship
The term ‘principal-agent relationship’ or simply ‘agency relationship’ describes an arrangement where one... Read More

A firm’s capital structure is the mix of debt and equity it uses to finance its investments. A capital structure decision aims to determine the financial leverage to maximize a company’s value by minimizing the weighted average cost of capital (WACC).
$$ r_{W A C C}=\left(\frac{D}{V}\right) r_{d}(1-t)+\left(\frac{E}{V}\right) r_{e} $$
Where:
\(r_d\) = Before-tax marginal cost of debt.
\(r_e\) = Marginal cost of equity.
\(t\) = Marginal tax rate.
\(D\) = Outstanding debt.
\(E\) = Outstanding equity.
\(V=D+E\) = Value of the company.
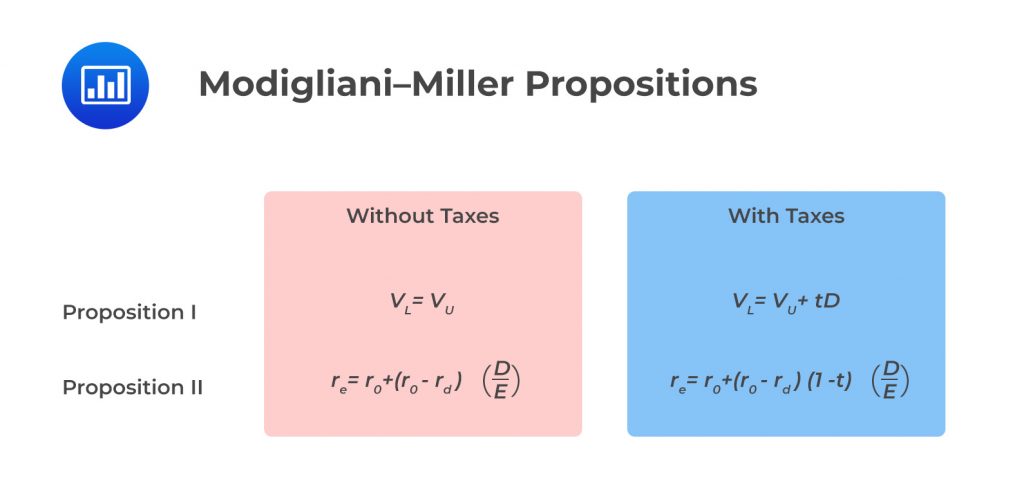
The market value of a company is unaffected by the capital structure of the company.
$$ \text { Value of a firm }\left(V_{L}\right)=\text { Value of unlevered }\left(V_{u}\right)=\frac{E B I T}{r_{W A C C}} $$
The above relationship implies that cash flows, not capital structure, determine the value of a company. Additionally, a company’s capital structure does not affect its WACC, assuming no taxes.
Franco Modigliani and Merton Miller suggested the following assumptions for Proposition I:
Although these assumptions are unrealistic, Modigliani and Miller’s school of thought is that investors can create capital structures they prefer. The capital structure that a management chooses does not matter because investors can change it at no cost.
Assume that a management has set a company’s capital structure to consist of 50% debt and 50% equity. Further, assume that the investor prefers the company’s capital structure to be 60% debt and 40% equity. The investor will use borrowed money to finance their share purchase so that the ownership of the company’s assets reflects 60% debt financing. The importance of the Modigliani and Miller theory is that managers cannot use capital structure to change a firm’s value.
Here, Franco Modigliani and Merton Miller remove a few assumptions from Proposition I and state that the cost of equity is a linear function of a company’s debt/equity ratio.
According to this proposition, the cost of equity increases as a company increases its use of debt financing to maintain a constant WACC. The risk of equity is contingent on business risk and financial risk. Business risk determines the cost of capital, while capital structure determines financial risk.
The WACC—still ignoring taxes—is given by:
$$ r_{W A C C}=\left(\frac{D}{V}\right) r_{d}+\left(\frac{E}{V}\right) r_{e} $$
Where:
\(r_{\text{WACC}}\)= The weighted average cost of capital.
\(r_d\) = Before-tax marginal cost of debt.
\(r_e\) = Marginal cost of equity.
\(t\)= Marginal tax rate.
\(D\) = Outstanding debt.
\(E\) = Outstanding equity.
\(V=D+E\) = Value of the company.
For a company financed by 100% equity, the \(r_{\text{WACC}}=r_0\). To get the cost of equity, we rearrange the formula:
$$ r_{e}=r_{0}+\left(r_{0}-r_{d}\right)\left(\frac{D}{E}\right) $$
Genghis Investment has an all-equity capital structure. Its characteristics are as follows:
The value of Genghis and its cost of equity is closest to:
Solution
$$ V=\frac{E B I T}{r_{W A C C}}=\frac{\$ 6,000}{0.12}=\$ 50,000 $$
When Genghis issues the debt, it pays interest of 6% on the debt.
$$\text{Interest Payment} = 0.06(\$18,000) = \$1,080$$
Using the MM proposition II, the cost of Genghis’ equity is given by:
$$ r_{e}=r_{0}+\left(r_{e}-r_{d}\right)(1-t) \frac{D}{E} $$
Where:
$$E=V-D=\$50,000-\$18,000=\$32,000$$
So,
$$ r_{e}=0.12+(0.12-0.06)\left(\frac{\$ 18,000}{\$ 32,000}\right)=0.15375=15.38 \% $$
Genghis makes $1,080 to debtholders and $6,000−1,080=$4,920 to equity holders. The value of debt is calculated as follows.
$$ V=D+E=\frac{\$ 1,080}{0.06}+\frac{\$ 4,920}{0.15375}=\$ 50,000 $$
We can also represent the systematic risk of the assets of the entire company as a weighted average of the systematic risk of the company’s equity and debt:
$$ \beta_{a}=\left(\frac{D}{V}\right) \beta_{d}+\left(\frac{E}{V}\right) \beta_{a} $$
Where:
\(\beta_a\) = Asset beta − Amount of asset non-diversifiable risk.
\(\beta_d\) = Beta of debt.
\(\beta_e\) = Beta of equity.
As the level of debt rises, the risk of default increases, and the costs are borne by equity holders. The equity’s Beta rises as the proportionate use of debt rises.
A tax shield is the deliberate use of taxable expenses to offset taxable income. The interest expense on debt provides a tax shield that results in savings that enhance the value of a company. Ignoring the practical realities of bankruptcy and financial distress costs, the value of a company increases with increased debt levels. The level of tax benefit reduces the actual cost of debt.
$$\text{After-tax cost of debt} = \text{Before-tax cost of debt}\times (1-\text{Marginal tax rate})$$
The MM Proposition I with taxes is:
$$\begin{align}V_L &= V_U + t_D\\ &\Rightarrow V_L > V_U\end{align}$$
Where:
\(V_L\) = The value of the levered firm (debt in the capital structure).
\(V_U\) = The value of the unlevered firm (no debt in the capital structure).
\(t\) = The marginal tax rate.
\(t_D\) = The debt tax shield.
According to Proposition I, value is maximized at 100% debt with taxes.
By introducing taxes, the WACC is adjusted to reflect the impact of the tax benefit:
$$ r_{W A C C}=\left(\frac{D}{V}\right) r_{d}(1-t)+\left(\frac{E}{V}\right) r_{e} $$
And the cost of equity will be:
$$ r_{e}=r_{e}+\left(r_{o}-r_{d}\right)\left(\frac{D}{E}\right) $$
We can see that the WACC for a company with debt is lower than the WACC for companies without debt. Therefore, debt financing is highly beneficial when considering taxes and ignoring financial distress and bankruptcy costs. The firm’s optimal capital structure is still 100% debt.
In summary, in the Modigliani-Miller model, investors are less likely to react negatively to a firm taking additional leverage, creating tax shields that boost the company’s value.
Let us use the example of Genghis Investments.
The value of Genghis is calculated as follows:
$$ V_{U}=\frac{E B T(1-t)}{W A C C}=\frac{\$ 6,000(1-0.3)}{0.12}=\$ 35,000 $$
The value of Genghis when it issues $18,00 in debt and buys back shares:
$$ V_{L}=V_{U}+t_{D}=\$35,000+0.3(\$18,000)=\$40,400 $$
The value of equity after buyback is $40,400–$18,000=$22,400$40,400–$18,000=$22,400 and levered equity is:
$$ r_{e}=0.12+(0.12-0.06)(1-0.3) \frac{\$ 18,000}{\$ 22,400}=0.15375=15.38 \% $$
So that,
$$ V_{L}=D+E=\frac{r d D}{r d}+\frac{(E B I T-r d D)(1-t)}{r e}=\frac{\$ 1,080}{0.06}+\frac{(\$ 6,000-\$ 1,080)(1-0.3)}{0.15375}=\$ 40,400 $$
The WACC of a levered Genghis is:
$$r_{W A C C}=\left(\frac{\$ 18,000}{\$ 40,400}\right) 0.06(1-0.3)+\left(\frac{\$ 22,400}{\$ 40,400}\right) 0.15375=0.1039=10.39 \%$$
Therefore,
$$V_{L}=\frac{E B I T(1-t)}{W A C C}=\frac{\$ 6,000(1-0.3)}{0.1039} \approx \$ 40,400$$
Miller argued that if investors face a higher personal tax rate on income from debt investments relative to stock investment, the cost of debt will increase as the investors demand a higher return on debt. Thus, in the Miller model, the effect of debt financing on a company’s value depends on the corporate tax rate, a personal tax on dividends, and the personal tax on interest income. However, in practice, the value of a levered company is affected by factors other than the tax issue surrounding debt.
The disadvantage of operating and financial leverage is that the earnings are magnified downwards during an economic slowdown. Lower earnings put companies in financial distress, which adds costs. The expected cost of financial distress is composed of:
The costs of financial distress can further be classified as direct or indirect. Some direct costs include actual cash expenses associated with the bankruptcy process. In contrast, indirect costs include agency costs associated with the debt, forgone investment opportunities, and impaired ability to conduct business.
Companies with assets that have a ready secondary market have lower costs associated with financial distress. On the other hand, companies with fewer tangible assets have less liquidity and higher costs associated with financial distress. The probability of bankruptcy increases as the degree of leverage increases.
Agency costs are the incremental costs arising from conflicts of interest between a principal and an agent. The agents (managers in a corporate context) may have prerequisite consumptions such as subsidized dining and corporate jet fleet at the expense of shareholders. The larger the stake managers have in the company, the more their share in bearing the cost of excessive perquisite consumption. Shareholders aware of the conflict will usually take measures such as auditing financial statements and managerial expenses to minimize these costs.
Agency cost of equity refers to the conflict of interest that arises between management and shareholders. The net agency costs of equity have three components:
Good corporate governance practices lead to higher shareholder value, reflecting that managers’ interests are better aligned with those of shareholders. Agency theory predicts that a reduction in net agency costs of equity results from an increase in the use of debt. Michael Jensen’s free cash flow hypothesis proposes that higher debt levels discipline managers, forcing them to take care of the company to make interest and principal payments, effectively reducing the amount of free cash flow available for misuse by the managers.
Asymmetric information arises from managers having more information about the company’s future investment and current performance than outsiders. Companies with high asymmetric information have little financial accounting transparency, complex products, or lower levels of institutional ownership. Debt and equity capital providers demand higher returns for companies with high asymmetric information because they have a greater likelihood of agency costs. Investors closely watch the behavior of managers to gain insight into insider opinions on the company’s prospects.
The pecking order theory developed by Myers and Majluf (1984) suggests that managers choose a method of financing starting with the least potential information content (internal funds) and lower preference for the form with the greatest potential information (debt and equity). Managers tend to issue equity when they believe the stock is overvalued; thus, investors often interpret the additional issuance of stocks as a negative signal.
Which of the following is most likely true about the effect of asymmetric information on the cost of equity?
Solution
The correct answer is B.
Managers have more information about the company’s current performance and its future potential investments than investors.
A is incorrect. Companies with lower asymmetry of information have less likelihood of agency costs.
C is incorrect. Managers choose financing methods according to a hierarchy that gives preference to the method with the least potential information content.
Modigliani-Miller propositions are core CFA Level I Corporate Issuers concepts. Candidates may be tested on capital structure decisions, leverage effects, tax shields, and how debt financing can influence firm value and the cost of equity.
Build confidence with the CFA Level I prep built for serious candidates featuring guided lessons, practice questions, and full mock exams.
Strengthen your understanding of capital structure and cost of capital relationships with CFA Level I exam-style practice questions.


Get Ahead on Your Study Prep This Cyber Monday! Save 35% on all CFA® and FRM® Unlimited Packages. Use code CYBERMONDAY at checkout. Offer ends Dec 1st.